Momentum Monday 12 February

Welcome to Momentum Monday.
Someone once said to me that running a share market research business is an oxymoron. When Markets are hot, everyone wants you. When Markets are not, THAT IS WHEN THEY NEED YOU MOST, but yet its crickets!.
So now I approach this Monday’s commitment.
To be honest I don’t know how much I can add at this point. Everything is up. So enjoy the read. Try to steer clear of the obvious ones and the opportunity cost of doing nothing is quite large. PS That person also said, “Don’t do it.” - I should have listened.
With reporting season here, remember for those who utilize Quality metrics, if you want to know whether your companies’ latest financials have arrived, look at the data table. If you see “TTM” and that the financial year ends June, then you know the latest half year figures are being counted.

Interesting links
Weekend Watchlist with Shares for Beginners this week covered a stock discussed with members with all the risks a good mining story would want. It is LYC Lynas Rare Earths. Listen here to the replay
Our most recent webinar for non-members was held recently in the lead up to the reporting season. The content is basic for members, however if you feel someone needs to watch it so as they can convince themselves Watch here
“Empower Others” referral program Learn more here
Follow us on Social Media Facebook Linkedin Instagram or X (formerly Twitter)
This week’s content is as follows:
Broader market sentiment
Member corner
Stocks in the “Shine Zone” (including changes)
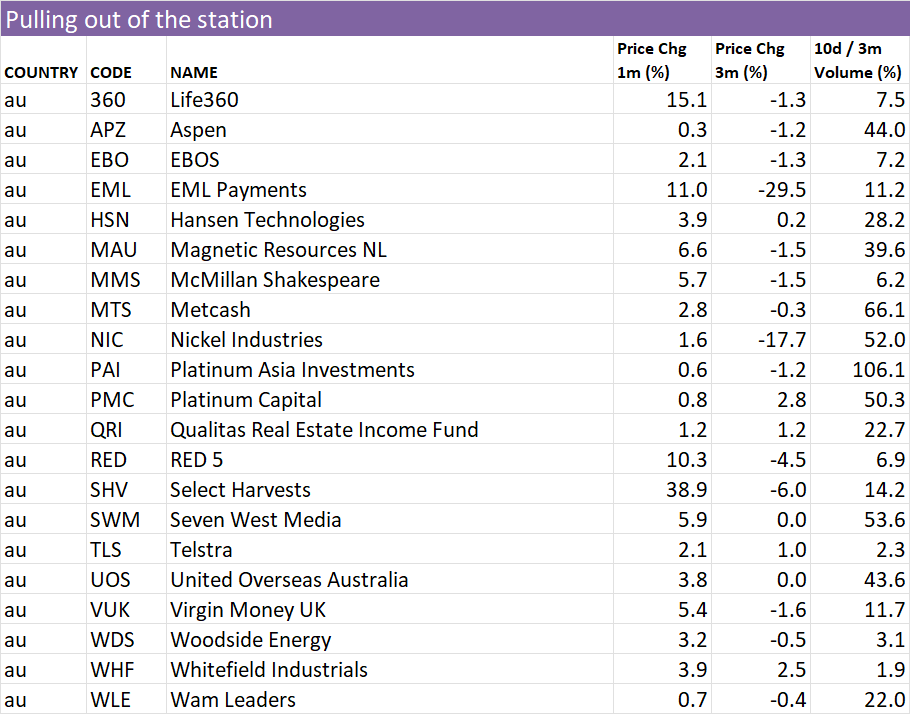
Buses pulling out of the station (volume + price movers)
52 week high screen (including changes)
A reminder that you don’t have to read all this contribution. Simply scroll to the area of interest.
Broader Market Sentiment
We look at the direction of both the US and ASX markets to gain an understanding of the broader sentiment at the minute. It is important to stress here that I DO NOT use this to time my entry or exit out of stocks. I prefer to use the individual charts of stocks to do that. However I find it useful in helping us determine how aggressive/cautious traders should be in their trading. In short the more positive the broader market is the more risks you can take and vice versa.
US / S&P500
The first ever close above 5,000 was a good way to end the week for the S&P500. Closing up for the fifth consecutive week even better.

S&P500 Weekly chart
What can you say about the world’s largest market hitting all time highs?
On a pleasing note, it is quarterly reporting season in the US and the mega-techs have done quite well Microsoft, and especially Meta, have shot the lights out and dragged the market with them.
As an aside, I looked at what the S&P500 was in depths of COVID despair. I saw a weekly close at 2304.9. At the end of the past week the index finished at 5022.1. For those that don’t have enough fingers or toes, that is a 118% gain! What I am saying is if you see a company reference COVID it is for marketing purposes only. In case you are wondering, the index first crossed 4,000 in April 2021.

Back to markets it was a good week with the broader index rising 1.4%. A catalyst for the market was the revision lower in December’s consumer price index. January’s CPI figures are due out next week.
I could talk more… but I will stop… (think less and make more money!)
At all time highs, I still remain in equities globally.
AUS S&P/ASX200
Despite the down week for the S&P/ASX200, we are still at the upper end of support this week, but I am hopeful.

S&P/ASX200 Weekly chart
We heard from the Reserve Bank a long winded explanation via the new process why interest rates should remain on hold. While it is obvious nothing can be taken from it, I do enjoy a fresh out of Uni journo cadet asking an almost 40 year experienced banker why interest rates are what they are. I mean… like… how would they afford their $1250 VIP tickets to Taylor Swift and I can’t get them to respond to an email!... (the world has gone mad!) Maybe I will get into bitcoin?
The update from Cettire also told me a lot about the hgh end of the consumer cycle which still for most part is ok. High-end property sales excluded, it is clear to me there is a two-pace cost of living crisis. The costs are either there, or they are not. If it supports our portfolios I can’t complain. The chorus of too high are starting to emerge. I will just keep my eye on the chart. But it is clear that in such times it is best to be with stocks that are as I would like to call them, “price makers” versus those who are “price takers” where there is no flexibility and what they receive and spend is due to forces beyond their own. Good evidence of that was provided by Boral and Cochlear during the week.
This is of course a reminder that the half year reporting season is underway so if your companies did not provide a sales or operational update recently, they will when their full accounts are disclosed. While not too relevant from a Momentum perspective, it can have a big impact.
So I remain in equities locally, if for no other reason that our world’s largest market is so strong (please read above).
Member corner
In this section we will provide a detailed chart assessment, on a maximum of ten stocks weekly, on companies from those of you in the Gallery.
We welcome stock requests to be analysed from members. We will also be looking at the charts of some of the more actively researched stocks for the week. We will try to rotate through a selection so as to not make the charts stale, however we will likely not cover a stock within 2 months of when it was last discussed.
If you want to see what has been written about a stock recently, go to the discussion area.

We will not be making up suggestions. If there are no changes to the most viewed list and/or there are no suggestions from members, then no stocks will be covered.
To learn of the methods used to analyse companies in this section, refer to my Momentum Journey series that I articulate here in three parts.
They will help provide context on what I am writing about and the editorial angle of this report.
Also look at the market capitalisation and liquidity before making any decisions!
And again, if you have a stock you would like analysed from a momentum perspective, please write it into the comments section below or email us at @stockopedia.com.au">support@stockopedia.com.au
If no one asks….how am I supposed to know?
ASX: WDS - Woodside Energy
StockRank 78
Momentum Rank 36
QM Rank 60
VM Rank 71
A$31.86
We have just crossed the two month threshold by one day, so again we talk about Woodside Energy (ASX:WDS)

Personally I find this quite interesting as I see no endearing qualities in the chart at all. When I last spoke of it two months ago I “spoke of that $39 resistance level and that remains in play. Otherwise this continues to be avoided…. Long term structural support remains at $20.”
To be fair the stock continues to be in a downtrend despite the recent mini-bounce, and I can’t look past that $39 mark. I hope it smashes it (I really do!) but for now this price taker remains an avoid.
ASX: NCK - Nick Scali
StockRank 97
Momentum Rank 99
QM Rank 99
VM Rank 94
A$15.11
Another stock which just crossed the two month threshold and has been included as a stock on a weekend watchlist is Nick Scali (ASX:NCK) .

ASX:NCK 1 year Daily chart
And it has certainly been a nice trend with the market appreciating the recent update. Back when it was covered a little over two months ago, we spoke of Anthony Scali reducing their holding in the business. We spoke of NCK’s high quality and I said, “I would prefer a clean break above it ($12.42 - $12.61) for the stock to have any chance of reaching the previous all time high of $16.”
So what happened? We got the break and the stock is now $14.93.
That said the recent pop has been parabolic therefore traders would be advised to take profits to see what happens next as a pullback would not be out of the question.
A parachute stop would be appropriate for those yet to hold. If you prefer a structural level, I do look back to the previous range where resistance now becomes support.
ASX:WHC - Whitehaven Coal
StockRank 100
Momentum Rank 94
QM Rank 99
VM Rank 99
A$7.48
Another stock that makes it by a day on the two month rule is Whitehaven Coal (ASX:WHC)

When it was last discussed I mentioned why I thought it was the right time to get into WHC. Since then the stock has gone up to new short term higher highs. But it has retraced. My parachute stop of $7.00 became irrelevant, when it hit a high of $8,43. AS I trade this stock, short term support became my stop at $7.81. The price is still falling and I won’t get back in until it stops around the $7.23 -$7.25 mark hopefully..
ASX:PME - Promedicus
StockRank 72
Momentum Rank 98
QM Rank 99
VM Rank 50
A$106.77
Just in case everyone missed it the first time. Pro Medicus (ASX:PME) is a pin up boy for fans like me.

I last covered the stock in November last year. I spoke of the good set up with the break above $60, the pullback and the entry. At that time I got in. I am still in and will be (given when I got in) for as long as the price stays above $89.95. (The stop goes up as the price goes up.)
Other than its shape and the numbers which clearly shows why it is running, yet is the most expensive stock on the exchange, I can’t really add much. There may be something more to say in two months time?
ASX:DUG - Dug Technology
StockRank 78
Momentum Rank 94
QM Rank 95
VM Rank 69
A$2.51
Perhaps it is not immediately clear to many why DUG Technology (ASX:DUG) keeps appearing in this list. But it was there for much of last week.

To be honest it is pretty clear to me. It has also been talked about quite a bit in this and other forms (look under ‘Discussion’ for more detail). When we last spoke about it in October we talked about the good setup. Looking at the chart the stock held resistance…. Just. (This is a timely reminder that I only have the time to deal with closing prices… and that is getting much harder these days.) While it did spend a short day in range it got out of there soon enough.
So there is nothing else to say. This has and still continues to be a good setup. In case you are interested, I have a stop at $2.12 which coincides with the previous higher high, and what I am saying is structural support.
ASX:BHP- BHP Billiton
StockRank 89
Momentum Rank 75
QM Rank 83
VM Rank 87
A$46.30
Another stock that makes it by a day on the two month rule is BHP (ASX:BHP). As the biggest stock on exchange this does not surprise me. Nor does what I am about to say.

ASX:BHP 1 year Daily chart
Back at that point we acknowledged the break of the downward move. Readers will be glad to see the price did keep running. But alas. As is the case with price takers, their price came back in line with Iron Ore/Oil prices (Actually… take your pick).
The disposition on BHP remains more positive than negative, and I would maintain a stop loss above $42.70 for the stock. The pullback, whilst frustrating, is necessary if it is going to eventually climb out of this quagmire.
But as I said last time, if you are running an index style fund, please ignore what I said. For those interested here is the commentary from last time.
ASX:BOE - Boss Energy
Momentum is a double edged sword. As I have mentioned many times, if you are going to play this space you will get your fingers burnt occasionally. As did holders of Uranium stocks on Friday, as did I as a holder in Boss Energy (ASX:BOE)
StockRank 57
Momentum Rank 98
QM Rank 86
VM Rank 52
A$5.23
The last we discussed BOE from a momentum perspective was in August last year. Back then the price was $3.23. After Friday’s 12.7% fall the price is $5.23.

ASX:BOE 1 year Daily chart
So what do I do now?
I mentioned back in August I use charts extensively with my Uranium exposures, BOE is no different. Ihave also mentioned that this space can be volatile so I don’t act on 50c moves. I of course wish the price was closer to the all time high than what it is, but its not.
So looking at the chart I see the two gaps created on the way up have almost filled. Gap filling is a concept we have talked before in the past. Given my gains in this stock I would like the price to stay in the $4.88 zone. That is the point of the previous higher high and would support price if that level holds.
Whether the fall in Uranium caused by plans from Canada’s leading producer Cameco to expand production is the driver of a bigger drop, I don’t know. But I had to laugh when someone patted themselves on the back for selling Cameco… but then they bought BOE ad PDN .
Either way the charts will tell me, and I have set my level.
ASX:CTT - Cettire
StockRank 79
Momentum Rank 93
QM Rank 99
VM Rank 59
A$4.18
In what was a surprise to many market watchers was the good result from Cettire (ASX:CTT) which showed strong sales improvement and the price popped accordingly.

The last time we discussed CTT from a momentum perspective was back in March last year. We discussed the fickleness of the stock, its good set up and that structural support was $1.165 which the price stayed above hitting a low of $1.27.
It therefore maintained the upward trend and did so until it hit a ceiling in July that it butted its head against, but last week’s move broke through that clearly. So what now?
The stock is in an uptrend, but I am patient. Investors will note the gap and in time that will be filled. So I will be patient. In time, when that gap is close to being filled, assuming the stock is in an uptrend I may take some. That $3.50=ish looks in interesting and it, “won’t take long to know if I am wrong.” In the meantime though I congratulate long term believers in the business.
Should the stock keep rising and not fill the gap, again I will look at them when they cross all time highs
Stocks in the Shine Zone
To learn about the Shine Zone and how to use it, you can read it here.
The rules for inclusion in this list are based on those I like to see in a stock before considering a trade in it:
QM Rank above 80
Price is above the 2.5x ATR
50d MA is above the 200d MA
Price is greater than the 200d MA
Market cap greater than $200M
This is a very important point: the “Shine Zone” are rules for possible buying. They are not for holding and/or selling. If a stock falls out of the shine zone, use support levels to set your stops, or instigate a parachute stop if necessary. With markets moving sideways, one expects frequent changes in these lists.
If you feel there is a stock that should be included but is missing please let us know. This is a manual process and occasionally one gets through the cracks
Also look at the market capitalisation and liquidity before making any decisions!
Data is at 10 February and is sorted by the stock code.
Changes from last week
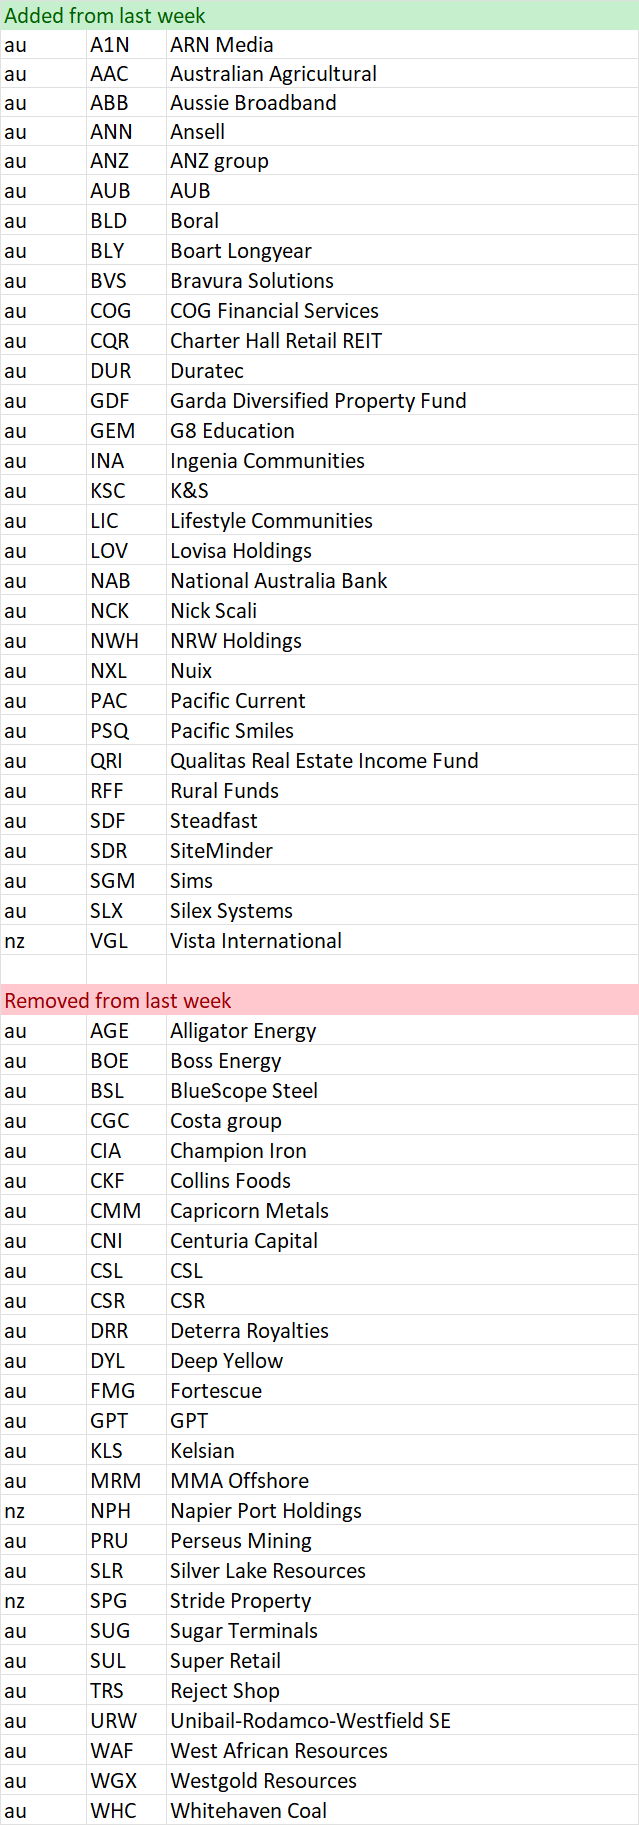
Shine Zone list as at 10 February

“Bus pulling out of the station”
To learn more about this screen read the following article on the objective of the screen
Here is a shortcut in understanding the reasons why a stock is removed:
Volume drop = Bus might be moving, but no one is on it
Price 1 mth < 0% = Bus has been cancelled
Price 3mths >= 3% = Bus has pulled out of the station
Also look at the market capitalisation and liquidity before making any decisions!
Data is at 10 February and is sorted by the stock code.
Changes from last week
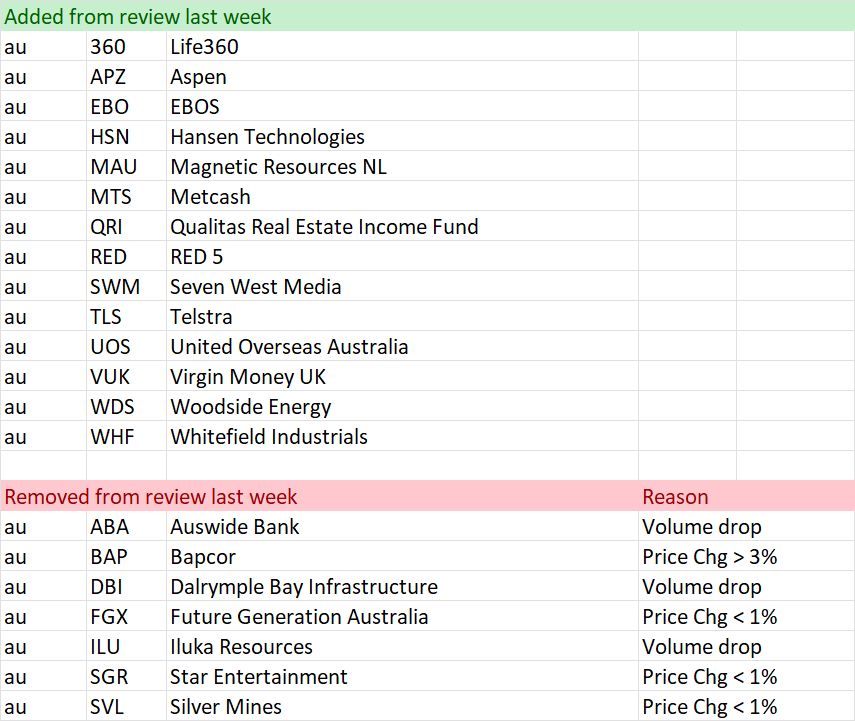
“Pulling out of the station” on 10 February
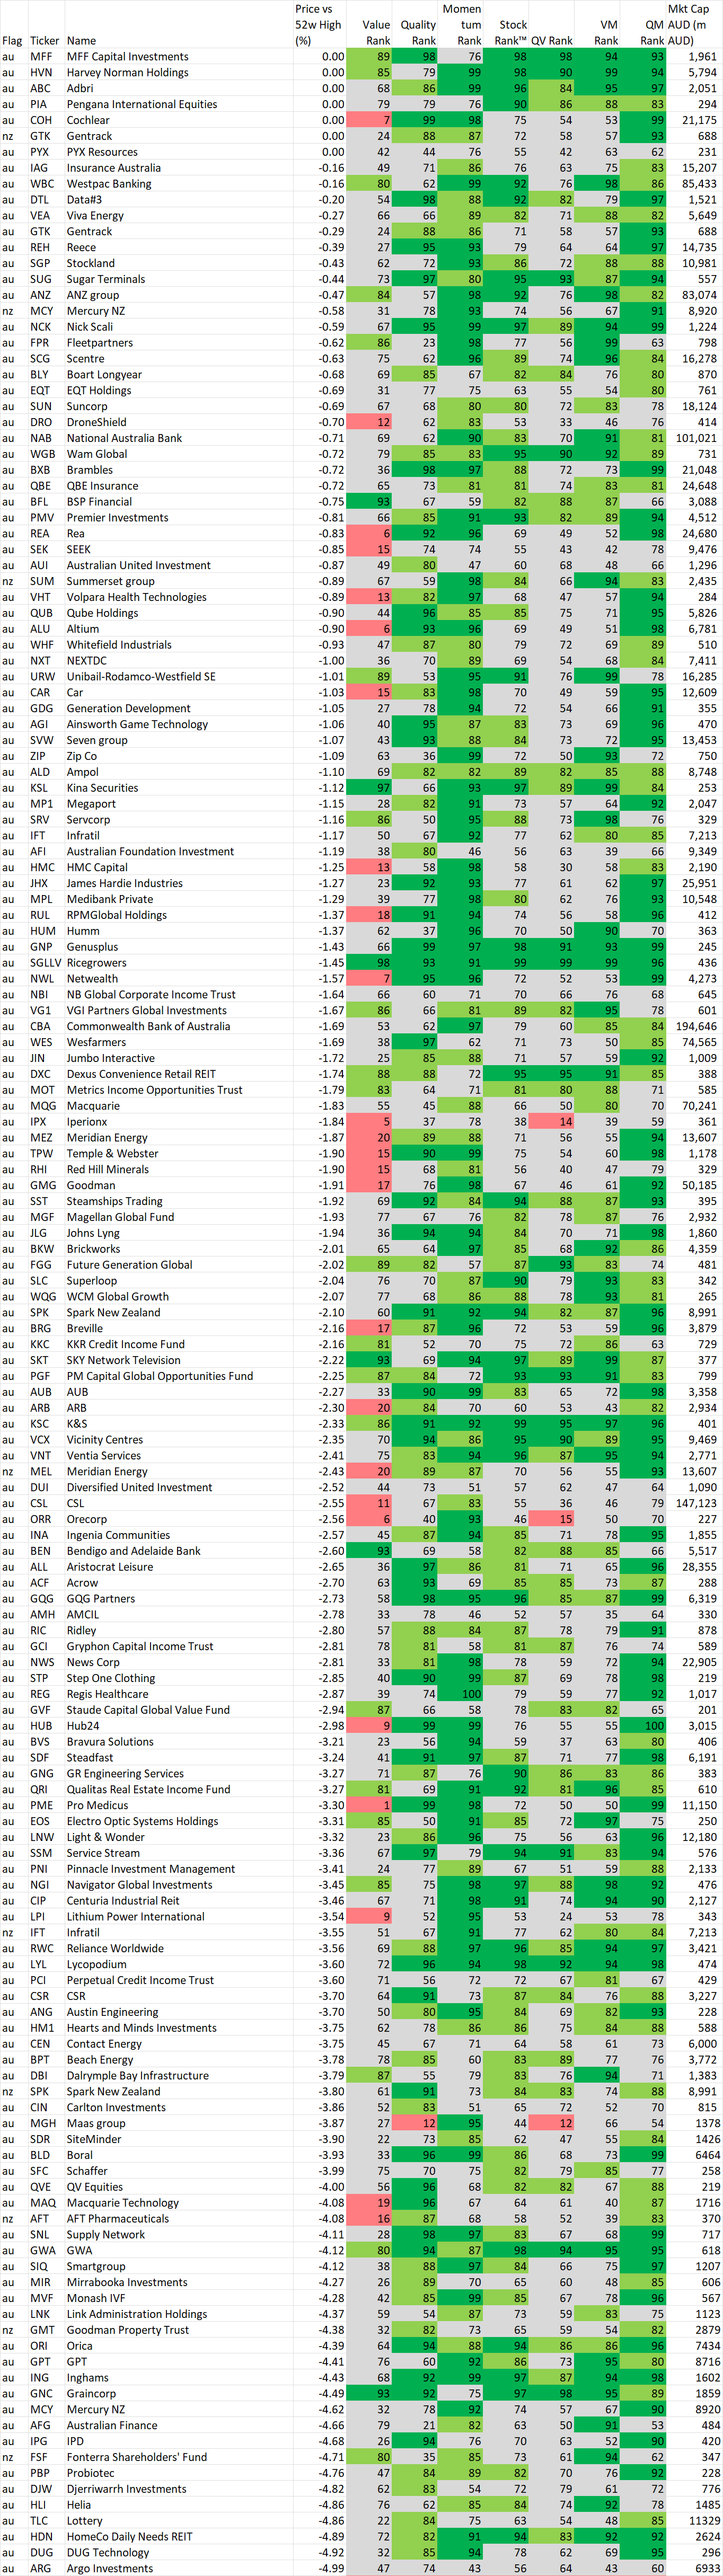
52 week high screen
In this section we identify stocks within 5% of their 52 week intraday high based on the idea, supported by academic studies, that stocks close to their 52 week highs tend to outperform. Weekly changes to the list will also be noted.
If you wish to recreate this screen in the screener select "Price vs 52 high" greater than -5% and Mkt Cap greater than $200M
A stock coming onto the list is NOT an automatic buy, just as a stock that leaves the list is NOT an automatic sell. As with the shine list, assess every chart on its merits. However movements on this list may alert you to interesting charts so be sure to look at Stockopedia and the chart first.
Data is at 10 February and is sorted by the stocks closest to their 52 week intraday high.
Also look at the market capitalisation and liquidity before making any decisions!
And remember, past performance is no guarantee of future performance.
Changes from last week
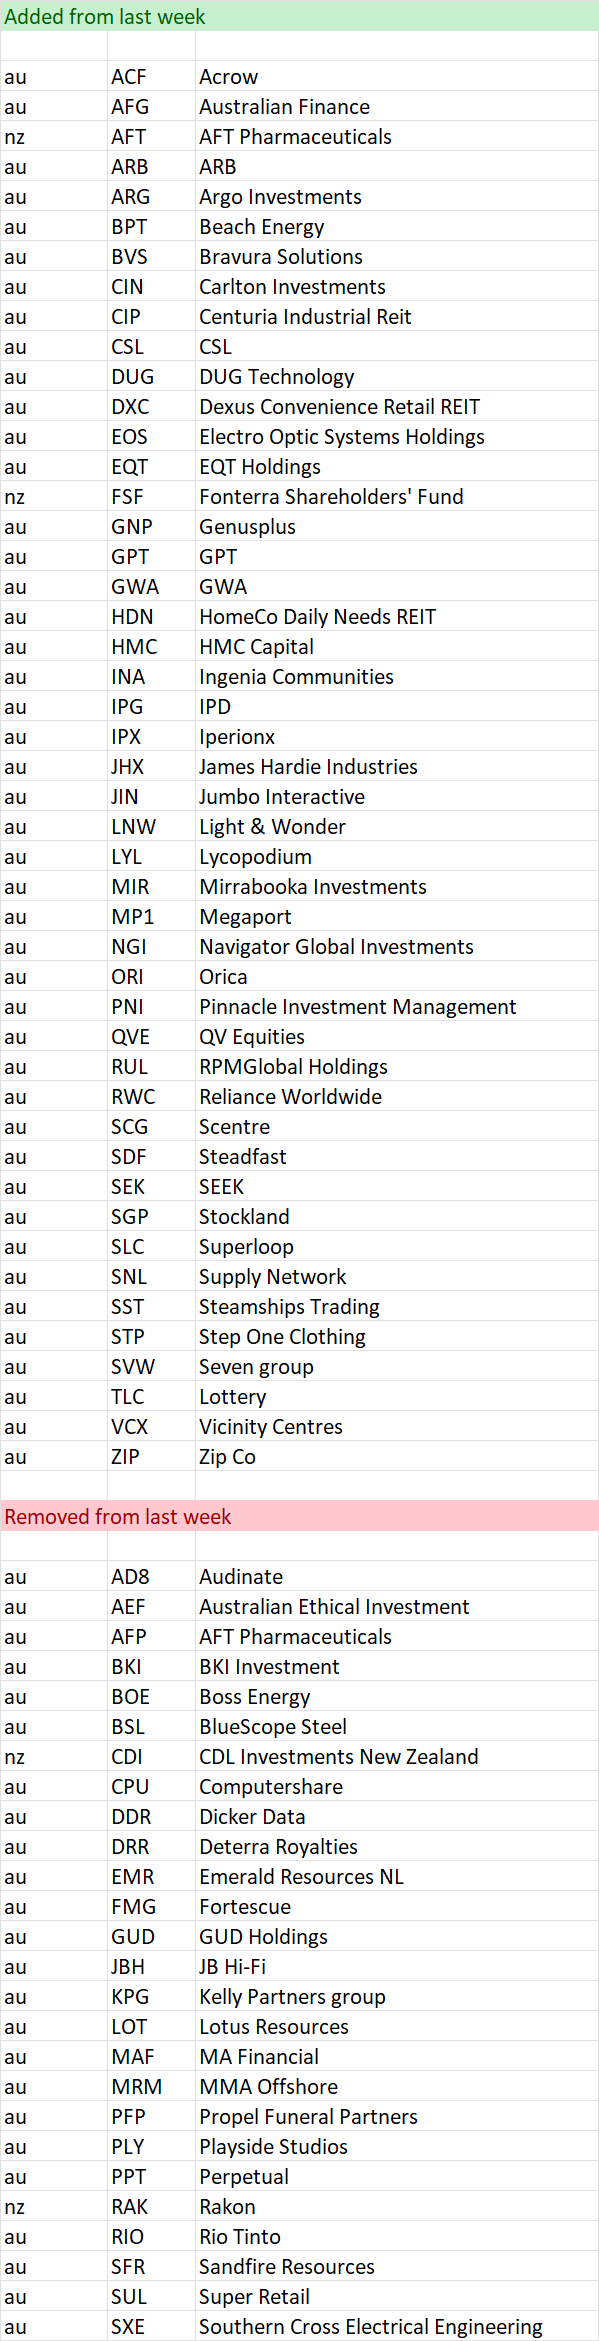
Stocks within 5% of their 52 week high as at 10 February
Important Information: Stockopedia Ltd ABN 39 757 874 670 UK business registration number 0637267 (“Stockopedia”) is an Authorised Representative of Daylight Financial Group Pty Ltd ABN 77 633 984 773 (“DFGPL”) which is the holder of an Australian Financial Services Licence (AFS Licence No. 521404).
Information in this commentary is current as at date prepared unless otherwise stated. However, please bear in mind that investments can go up or down in value, and that past performance is not a reliable indicator of future performance. For more Important Information please refer to the Disclaimer section of this website.
This communication may contain general financial product advice. It has been prepared without taking into account your personal circumstances, and you should therefore consider its appropriateness in light of your objectives, financial circumstances and needs before acting on it.
If our advice relates to the acquisition or possible acquisition of a particular financial product, you should obtain a copy of and consider the Product Disclosure Statement (PDS) before making any decision.
The author holds interests in PME, DUG and BOE and other companies listed in the data tables . This position can and will change at any time without notice.
Disclaimer
This is not financial advice. Our content is intended to be used and must be used for information and education purposes only. Please read our disclaimer and terms and conditions to understand our obligations.
2 comments
Elio,
Well it’s only the 2nd time I have read Momentum Monday and I am impressed. This is quite a list of stocks to consider. I like your analogy with the bus. I use the train and if it’s not going in the direction you wanted. Get off at the next station and plan your journey better for next time. Cheers.
Hi Peter,
Glad it adds value, so thank you for the feedback. Just to point out, the stocks are as per members requests and those most viewed in the platform. Looks like this week will be a much quieter one when posted Monday Morning (before open).
Warm Regards,
Elio