Momentum Monday 13 November

Welcome to Momentum Monday.
In Australia last week, a systems telecommunications failure which locked down many businesses and consumers, and a cyber hack at a major stevedore company keeping shipping containers locked away, shows us how critical infrastructure needs to flow for our economy to work smoothly.
These events are not expected to have lasting effects, though it reminds how connected our economy has become on infrastructure’s smooth operation. Ultimately the strength of an economy is a key support to our businesses so the latest events highlight risks that will need to be better managed.
Interesting links
Weekend Watchlist with Shares for Beginners Listen here This week it is Idp Education (ASX:IEL)
“Empower Others” referral program Learn more here
Follow us on Social Media Facebook Linkedin Instagram or X (formerly Twitter)
We are presenting a webinar to the ASA tomorrow on income investing. Register here if you are interested
This week’s content is as follows:
Broader market sentiment
Member corner
Stocks in the “Shine Zone” (including changes)
Buses pulling out of the station (volume + price movers)
52 week high screen (including changes)
A reminder that you don’t have to read all this contribution. Simply scroll to the area of interest.
Broader Market Sentiment
We look at the direction of both the US and ASX markets to gain an understanding of the broader sentiment at the minute. It is important to stress here that I DO NOT use this to time my entry or exit out of stocks. I prefer to use the individual charts of stocks to do that. However I find it useful in helping us determine how aggressive/cautious traders should be in their trading. In short the more positive the broader market is the more risks you can take and vice versa.
US / S&P500
Our second positive week in a row shows the US Market continues to bounce off support. And actually finished at 2 month highs.

S&P500 Weekly chart
Much of the week’s gains came on the last trading day of the week. This just one day after the market fell on concerns that the Fed believes it has not seen enough to suggest that inflation is under total control.
This Thursday news lead to the weakness on our market on Friday (more in moment) though it looks like US traders brushed that aside and continued to buy the bounce on Friday and see the S&P500 close up 1.3% for the week.
The next upside level we are looking at is 4582. This would see us create a new very short term higher high and entrench the low of October as a new higher low. I reiterate once again, if it wasn’t for the macro worry, the market in the US appears to be behaving normally.
Before we get too cocky…. I also shared this chart on 16th October

S&P500 2 year Daily chart
At that point we were at an integer where the index was close to the bottom lines of the upward and downward channels.
The index eventually kept falling, but the rebound over the past 2 weeks has taken us back to the upper line of the downward channel. If it fails to break above this in the coming weeks then recent lows on the downside become the next target
So following two positive weeks we remain in equities globally, but we are not out of the woods yet. Therefore prior comments about strong set ups and being prepared remain.
AUS S&P/ASX200
The world of Momentum Investing is a temptress. For much of last week we felt like we'd got our mojo back. Then in one day it was taken away from us with the ASX 200 finishing week down -0.02% for the week, effectively right back where we started

S&P/ASX200 Weekly chart
At least we are still nestled safely within the support zone for the moment. Last week I said one swallow doesn't make a summer, and while the market's reaction post the interest rate rise on Tuesday was pleasing, the end of the week reminded us that factors from overseas will always play a role on our market, whether we like it or not.
6474 continues to be the support level to watch. Hopefully the XJO stears well clear of it. Nothing last week has changed the view which is similar to the US, that if it wasn't for the macro noise, it's still an orderly market - notwithstanding the frustration. And that frustration compounded by the prolonged sideways nature of the market.
A number of companies reported their September results last week, and in general they were quite good. The Banks (notwithstanding increased home loan competition) saw good numbers, along with REA and ORI, they were the standouts in my view. Even XRO whose result was not too bad, felt the ire of negative sentiment, reminding us how powerful sentiment can be.
So remember, things don't always work the way you might think, no better exemplified than oil prices recently. I know not really a topic for here, but despite the potential for regional instability and OPEC agreeing to extend production cuts for longer, the price of crude has fallen significantly!

Brent Crude Oil 1 month performance
A timely reminder that from a sentiment perspective… forget the narrative…. Don't get angry… Trade the trade. Remain focused on good looking charts…. And if it looks hard, look elsewhere.
Member corner
In this section we will provide a detailed chart assessment, on a maximum of ten stocks weekly, on companies from those of you in the Gallery.
We welcome stock requests to be analysed from members. We will also be looking at the charts of some of the more actively researched stocks for the week. We will try to rotate through a selection so as to not make the charts stale. We will not be making up suggestions. If there are no changes to the most viewed list and/or there are no suggestions from members, then no stocks will be covered.
Also please note, we may receive a number more stocks than can be covered, therefore we retain the right to save it for another week, or ignore it all together.
To learn of the methods used to analyse companies in this section, refer to my Momentum Journey series that I articulate here in three parts.
They will help provide context on what I am writing about and the editorial angle of this report.
And again, if you have a stock you would like analysed from a momentum perspective, please write it into the comments section below or email us at @stockopedia.com.au">support@stockopedia.com.au
ASX: XRO - Xero Limited
StockRank 69
Momentum Rank 94
QM Rank 95
VM Rank 51
A$ 99.93
I mentioned above how investors may have been somewhat disappointed with the market’s reaction to Xero (ASX:XRO) latest result.

Despite turning profitable, generating positive cash and growing their client base, the stock was sold off quite aggressively.
The sell down is a continuation of a downtrend started from the peak in July.
When I last discussed the stock in June, the price was lower, and the stop of $97.11 was based on the price of around $113 at the time on a rising trend.
As the price rose, so too the stop loss. But then once a new lower low was created at the same level we last looked at, around $113, this had become the new structural support level. Failing to hold exemplified price exhaustion after a rapid run.
For those very brave investors, the previous support of $97.11 may prove to be a possible buying zone as you won't have to wait long to know if you are wrong from these levels, and you are somewhat supported by improved fundamental numbers.
This is further supported as the price pullback has taken the stock to the downside target that a failing double top would have indicated. (Calculated as the distance between the two peaks and the neck line (refer to the chart).
Just be wary in this market buying the dips can be a challenging strategy to execute as you are not supported by the market's levity.
ASX:PME Promedicus
StockRank 73
Momentum Rank 99
QM Rank 100
VM Rank 51
A$85.18
When I last discussed Pro Medicus (ASX:PME) I mentioned that a stop of $60 would be appropriate and I would like to see it retest all time highs.

ASX:PME 1 year Daily chart
Well it held that $60 range (as indicated by the support line in the chart above), then created a new all time high in June, retraced creating a new higher low and then made a renewed push. This was a text book set up and it doesn't get much cleaner than this.
If you are new to Momentum Investing, spend some time staring at the chart. Look at the higher highs and higher lows. It would be appropriate for a book if anyone is writing.
Fast forward to today, and it is now at close to all time highs again. A position now would see a parachute stop loss set at the structural short term higher low of $74.54. This is about 12% from Friday's price. For those patient enough, there may be better buying closer to support which would reduce the potential drawdown. But don't be picky…. Too many investors have missed this run over the years by acting too cute with the price.
ASX:IPD - IPG Limited
StockRank 79
Momentum Rank 84
QM Rank 94
VM Rank 65
A$ 3.92
For a fleeting moment during the week, IPD (ASX:IPG) was amongst the most viewed stocks among Stockopedia members.

ASX:IPD 1 year Daily chart
We last spoke of IPD back in August. I said hopefully the price could hold $3.98 and shoot the lights out with its report… and it did just that, eventually hitting a high of $5.
But then you will notice the price retraced (as you expect) and bounced to resistance but failed to break through. It pulled back to support, tried again but failed. This created a double top pattern which is an exhaustion pattern (just like XRO earlier) and the target immediately became $4.00 once the $4.50 support line was broken.

The price got there rapidly and has even fallen below that.
So I have mentioned before that I like the company, and I use charts to time my entry and exit here, so when will I get back in?
Since hitting the short term low of $3 69, the price has stabilised. I would love to see a mild retrace and then a rebound. Effectively until it crosses above $3.93 again, assuming it has had the pullback, I'll be in.
So the question you may be thinking is why not get in now if I like it?
In my view, after big falls like the stock has experienced, I like to see a period of consolidation for two reasons:
1. It suggests the panicked selling may be easing
2. Consolidation allows me to establish new support and resistance levels to monitor from here in.
This last point is a key reason I didn't buy straight away into the likes of RMD when it fell to $22. Two months on however and I can see a clear level of support at $21.60. I had been hoping to buy below $20, but if it holds this level it will be bullish. Fail and you can see that it may be significant.

ASX:RMD Price since start of September Daily Chart
Back to IPD, likewise I am waiting for key structural levels to form, though rest assured, a sign of life and I am back. If price falls no further from here it may be at $4.00 with a stop at $3.69
ASX:AHX Apiam Animal Health
StockRank 70
Momentum Rank 26
QM Rank 53
VM Rank 62
A$ 0.26
A member has requested we look at Apiam Animal Health (ASX:AHX) and to be frank, it’s why we don’t discuss value in this Momentum Monday section.

ASX:AHX 1 year Daily chart
We know opportunities remain strong for veterinary services in rural Australia. However there are absolutely no saving graces with this chart. It’s at all time lows and just can’t be considered from a momentum perspective until at least stops falling, then goes on a run, retraces and then goes again.
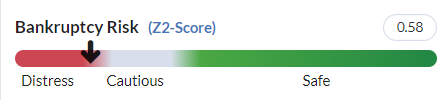
Until then, investors can’t even consider topping up in our view. ESPECIALLY given the insolvency risk levels as can been seen in Stockopedia. Tread very wearily.
ASX:ASX Limited
StockRank 63
Momentum Rank 50
QM Rank 64
VM Rank 56
A$ 57.46
The question was also asked of ASX (ASX:ASX) I last discussed ASX in March. I said $65.50 was obvious support. The stock is now at $57 and at multi year lows, its even lower than where it was at during the COVID correction.

ASX:ASX 1 year Daily chart
The question asked about its cash balance and what will be done with it. It’s quite large, though it fell off cliff for a number of reasons, one being excess cash lodged by participants dropped significantly over the year. In fact, Cash and financial assets mainly comprises ASX’s own cash and investments in financial assets backing amounts owing to participants. So one looks to the dividend and they pay 90% of profit in dividends. However they have changed this policy and announced that is will now be 80% to 90%
Basically they are a company that should be doing better, but they aren’t. The price reflects that. This is an incredibly key level here. If it fails to hold there is little in the way of structural support. Sub $50 a real possibility (as crazy as that may sound.)
Stocks in the Shine Zone
To learn about the Shine Zone and how to use it, you can read it here.
The rules for inclusion in this list are based on those I like to see in a stock before considering a trade in it:
QM Rank above 80
Price is above the 2.5x ATR
50d MA is above the 200d MA
Price is greater than the 200d MA
Market cap greater than $200M
This is a very important point: the “Shine Zone” are rules for possible buying. They are not for holding and/or selling. If a stock falls out of the shine zone, use support levels to set your stops, or instigate a parachute stop if necessary. With markets moving sideways, one expects frequent changes in these lists.
If you feel there is a stock that should be included but is missing please let us know. This is a manual process and occasionally one gets through the cracks
Data is at 11 November and is sorted by the stock code.
Changes from last week

Shine Zone list as at 11 November

“Bus pulling out of the station”
This section was introduced recently.
To learn more about this screen read the following article on the objective of the screen
Please let us know any feedback
Data is at 11 November and is sorted by the stock code.
Changes from last week

“Pulling out of the station” on 11 November

52 week high screen
In this section we identify stocks within 5% of their 52 week intraday high based on the idea, supported by academic studies, that stocks close to their 52 week highs tend to outperform. Weekly changes to the list will also be noted.
If you wish to recreate this screen in the screener select "Price vs 52 high" greater than -5% and Mkt Cap greater than $200M
A stock coming onto the list is NOT an automatic buy, just as a stock that leaves the list is NOT an automatic sell. As with the shine list, assess every chart on its merits. However movements on this list may alert you to interesting charts so be sure to look at Stockopedia and the chart first.
Data is at 11 November and is sorted by the stocks closest to their 52 week intraday high.
And remember, past performance is no guarantee of future performance.
Changes from last week

Stocks within 5% of their 52 week high as at November 11, 2023

Important Information: Stockopedia Ltd ABN 39 757 874 670 UK business registration number 0637267 (“Stockopedia”) is an Authorised Representative of Daylight Financial Group Pty Ltd ABN 77 633 984 773 (“DFGPL”) which is the holder of an Australian Financial Services Licence (AFS Licence No. 521404).
Information in this commentary is current as at date prepared unless otherwise stated. However, please bear in mind that investments can go up or down in value, and that past performance is not a reliable indicator of future performance. For more Important Information please refer to the Disclaimer section of this website.
This communication may contain general financial product advice. It has been prepared without taking into account your personal circumstances, and you should therefore consider its appropriateness in light of your objectives, financial circumstances and needs before acting on it.
If our advice relates to the acquisition or possible acquisition of a particular financial product, you should obtain a copy of and consider the Product Disclosure Statement (PDS) before making any decision.
The author holds PME and interests in companies listed in the data tables . This position can and will change at any time without notice.
Disclaimer
This is not financial advice. Our content is intended to be used and must be used for information and education purposes only. Please read our disclaimer and terms and conditions to understand our obligations.
No comments yet
No one has commented here yet! Why not be the first one?