Momentum Monday 13th May 2024

Welcome to Momentum Monday.
Well the US is at all time highs. I will take a bow, thanks very much. But will the market stay here forever? Of course it won’t. Don’t be stupid enough to believe otherwise.
I was actually quite surprised during Friday’s "Lunch ‘n Learn" session how few people knew this publication even existed. Anyway, I am glad you are here now. Please be sure to read the description of each section before getting into its content. Also be sure to ask any questions or suggestions if you have them in the comments section below.. If you are a little shy, email us at support@stockopedia.com.au
Interesting links
Weekend Watchlist run in conjunction with Shares for Beginners this week was an education piece of how being Forearmed is forewarned in the market when we look at BAP Bapcorp Listen here to the replay
We held our Friday Lunch ‘n Learn last week which covered a range of topics including tips on using the screener. Watch the replay here.
And if you missed it, please download the AVZ piece we published last week by clicking here
Our “Empower Others” referral program will be undertaking a change. For now we maintain the current system, be sure to Learn more here if you are interested in current plan
For any external commentary we make to the broader market, follow us on Social Media Facebook Linkedin Instagram or X (formerly Twitter)
This week’s content is as follows:
Broader market sentiment
Member corner
Stocks in the “Shine Zone” (including changes)
Buses pulling out of the station (volume + price movers)
52 week high screen (including changes)
A reminder that you don’t have to read all this contribution. Simply scroll to the area of interest.
Broader Market Sentiment
We look at the direction of both the US and ASX markets to gain an understanding of the broader sentiment at the minute. It is important to stress here that I DO NOT use this to time my entry or exit out of stocks. I prefer to use the individual charts of stocks to do that. However I find it useful in helping us determine how aggressive/cautious traders should be in their trading. In short the more positive the broader market is the more risks you can take and vice versa.
US / S&P500
Sentiment remains positive. Not just in the US of course, but worldwide with many exchanges seeing record all time highs.
With little in the way of Macro news to cause any instability, markets were left to their own devices to melt up, and they did just that.

S&P500 Weekly chart
The S&P rose a solid 1.85%. I am a firm believer that you need to be in the market more than you are out of it. And we use the squiggly lines to help us protect our capital as it is the market that should govern our overall sentiment, not the news.
Back to US Markets, and while new records weren't reached over there, the establishment of the new short term lower low of a month back at 4967 can provide some comfort for short term traders as a new support level. This especially given the subsequent 3 positive bars that have come since then, going some way of creating this as a level to watch.
But as Australian investors, of course I have to look for the negative - and the only things I can really see are that 1. The MACD moving averages are still the wrong way of each other where the slower moving average is above the faster one (though they are improving).

MACD and RSI since the start of April Weekly chart
The 2. Relates to that short term support level identified. If price doesn't proceed any further and infact pulls back and fails to find support at 4967, then sentiment I feel will dictate a fall to 4721. By no means disastrous, though for a trader with higher leverage perhaps that is.

There will be more consumer data to come out of the US next week which will likely confirm that inflation remains stick, and that hopes of further rate cuts coming sooner than later will be silenced. As mentioned before though, I am not the first to suggest this, and yet the market keeps going up - so why fight City Hall?
AUS S&P/ASX200
The emphatic break though I was hoping for came this week as the XJO rose 1.6% for the week and broke out of its sideways channel

S&P/ASX200 Weekly chart
I still maintain that traders will look to the 7547 for a change in short term sentiment, but its not this week. For the moment it is still positive.
The weekly RSI stays above 50 and its good to see the MACD which I mentioned last week was more of a lagging indicator, has turned the corner somewhat, tough it is still the wrong way around (despite being above the breakeven line.).
The sticky inflation and the idea that rates might go up before they come down again has not spooked the market, nor has a looming Federal Budget or tough state versions has thrown the Bulls off. You know the Bulls are grabbed by the horns when bad news is good news, and we are in that Goldilocks scenario right now with more info due next week, particularly in a macro sense.
Especially when the annual Macquarie Conference Jamboree saw little in the way of surprises for Fund Managers. This goes well for the idea that a period of stability is ahead - we shall see.
There is really not that much more to do at this stage but focus on riding the Bull for as long as we can. How long that will be I have no idea. But riding it I am. I see no need to change my broader market sentiment at this time and therefore I remain aggressive with my stocks at the minute.
Member corner
In this section we will provide a detailed chart assessment, on a maximum of ten stocks weekly, on companies from those of you in the Gallery.
We welcome stock requests to be analysed from members. We will also be looking at the charts of some of the more actively researched stocks for the week. We will try to rotate through a selection so as to not make the charts stale, however we will likely not cover a stock within 2 months of when it was last discussed.
If you want to see what has been written about a stock recently, go to the discussion area.

We will not be making up suggestions. If there are no changes to the most viewed list and/or there are no suggestions from members, then no stocks will be covered.
To learn of the methods used to analyse companies in this section, refer to my Momentum Journey series that I articulate here in three parts.
They will help provide context on what I am writing about and the editorial angle of this report.
Also look at the market capitalisation and liquidity before making any decisions!
And again, if you have a stock you would like analysed from a momentum perspective, please write it into the comments section below or email us at @stockopedia.com.au">support@stockopedia.com.au
IF NO ONE ASKS… HOW AM I SUPPOSED TO KNOW?!?
ASX: LAU - Lindsay Australia
StockRank 92
Momentum Rank 56
QM Rank 80
VM Rank 83
A$0.98
I thought I would start with a stock that had just crossed the two month mark from being discussed from a Momentum perspective and that was Lindsay Australia (ASX:LAU)

ASX:LAU 1 year Daily chart
We know it is regularly discussed and viewed because it is one of our NAPS stocks for 2024 and it was carried over from 2023.
At the time of the last momentum commentary I mentioned the stock had done nothing and I was waiting for some clear directional move. Well we got some on Tuesday with news it downgraded earnings expectations.
I mentioned the double top and the 80.5 cent target in September last year. Please read it here. And it looks like with the creation of a new lower low, that level has firmed as my target, irrespective of its inclusion in the NAPS portfolio for now.
It will take a move above $1.20 for my negative view to change.
ASX: GUD - GUD Holdings
StockRank 87
Momentum Rank 50
QM Rank 78
VM Rank 74
A$9.81
It was unsurprising that GUD Holdings (ASX:GUD) was amongst the most viewed stocks amongst Stockopedia members given it was recently covered by Chris. You can read that commentary here.

From a Momentum perspective, GUD was last discussed in September last year. Back then the chart looked very different as the stock glowed in the glory of the Davey pumps sale. Fast forward to today and the chart looks very different. I said at the time traders may want a parachute stop loss at $11.56. Further I said the stock from a investors perspective would prove better buying at $10.20. This is because ‘we won’t have to wait long until we are wrong. So are we wrong given the price has declined since it passed through $10.20. No I don’t think so but I would have a stop at $9.61, lest that $8.20 mark that was also mentioned in that previous correspondence comes into play. Long story short, I feel GUD is at a critical juncture price wise and we await the coming days to help us establish a firmer view either way.
Out of interest, if it does hold these levels I see an upside target of $12.40
ASX: PME - ProMedicus Limited
StockRank 73
Momentum Rank 99
QM Rank 100
VM Rank 50
A$115.15
And now is a poster boy for the QM investor - it is Pro Medicus (ASX:PME). A stock we last discussed from a Momentum perspective in February. At the time the stock was flying and doing nothing wrong. And then later that same week, it reported and fell quite heavily past our $89.95 support we had for it.

ASX:PME 1 year Daily chart
The day though that it broke below $89.95 put us in a negative mindset. But that ended up being the low of that period. It never went down further after that day, therefore we stayed in. So much so that the reversal has been swift and we are now at all time highs again… so ‘carry-on’ .
This is what I will do for as long as the price stays above $87.24. This may seem a long way down - but this is a very strong trend.
And even if you did sell on that specific day mentioned earlier, using these rules I have discussed ad nauseum before (refer to the introduction above) you were back in at $103…. This is just a normal day for a trader.
ASX: LYL - Lycopodium Limited
StockRank 98
Momentum Rank 91
QM Rank 97
VM Rank 93
A$12.22
A stock that just made its way onto the list of most viewed stocks over the week was Lycopodium (ASX:LYL). This was one of our best performers in the NAPS portfolio last year. Though we discussed it from a Momentum perspective back in June last year. Almost 12 months ago. You can read that commentary here

ASX:LYL 1 year Daily chart
Back then, albeit a long-time ago. I mentioned the sideways channel the stock appeared to be trading in. It subsequently created lower lows until ultimately it fell out of that range and matched the market until the lows of October. As the market has recovered though, so has LYL. It bounced back and even rose to above the channel, but again it looks like it is at an interesting juncture.
From it’s all-time high, the price plunged. Then it rebounded, but it was unable to break through that higher high level ($13.21). So keeping a pessimistic Aussie trader hat on, this puts me on alert for a possible double top and if we look at the next line, the downside target would be circa $8.77 which is not too far away from the lows of October and therefore would be a strong support level in my view.
On the upside, despite being bullish, I won’t look at this stock again until it crosses above the all time high of $13.21
Stocks in the Shine Zone
To learn about the Shine Zone and how to use it, you can read it here.
The rules for inclusion in this list are based on those I like to see in a stock before considering a trade in it:
QM Rank above 80
Price is above the 2.5x ATR
50d MA is above the 200d MA
Price is greater than the 200d MA
Market cap greater than $200M
This is a very important point: the “Shine Zone” are rules for possible buying. They are not for holding and/or selling. If a stock falls out of the shine zone, use support levels to set your stops, or instigate a parachute stop if necessary. With markets moving sideways, one expects frequent changes in these lists.
If you feel there is a stock that should be included but is missing please let us know. This is a manual process and occasionally one gets through the cracks
Also look at the market capitalisation and liquidity before making any decisions!
Data is at 11 May and is sorted by the stock code.
Changes from last week
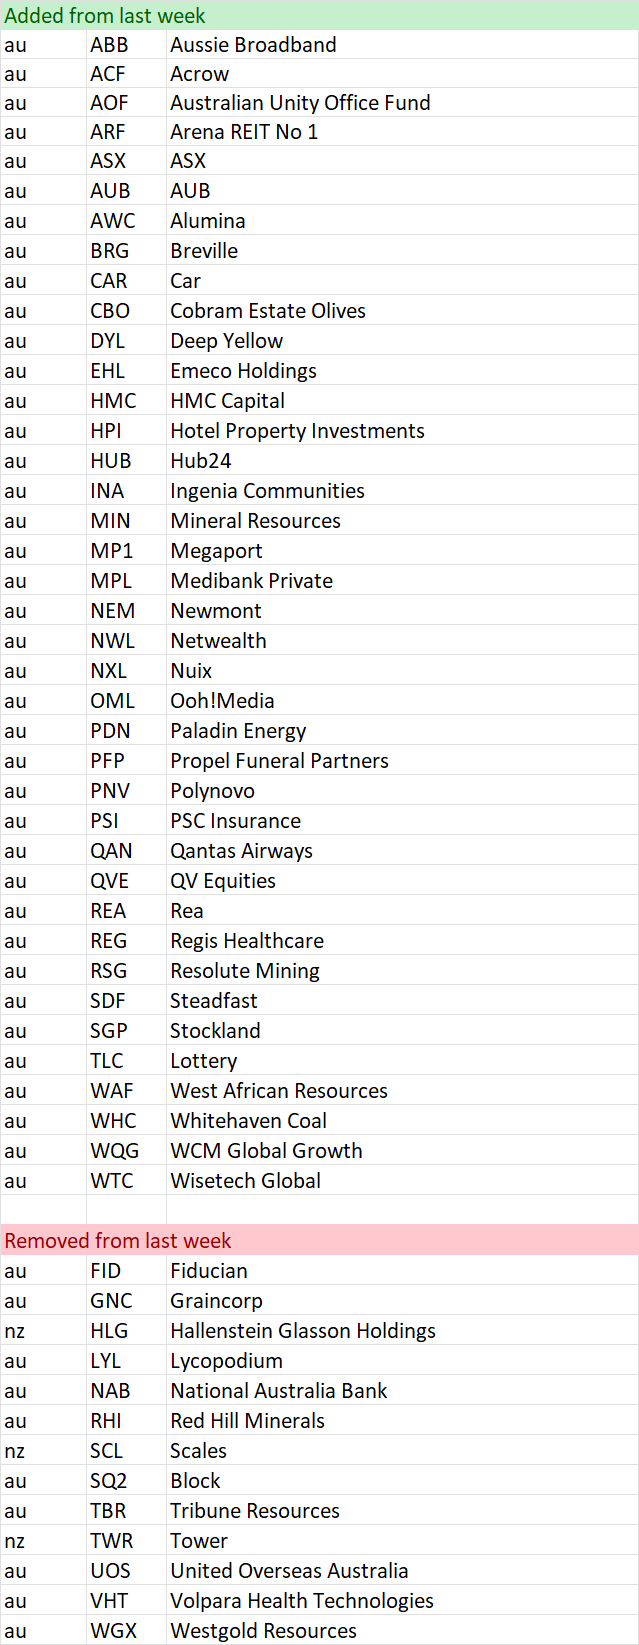
Shine Zone list as at 11 May

“Bus pulling out of the station”
To learn more about this screen read the following article on the objective of the screen
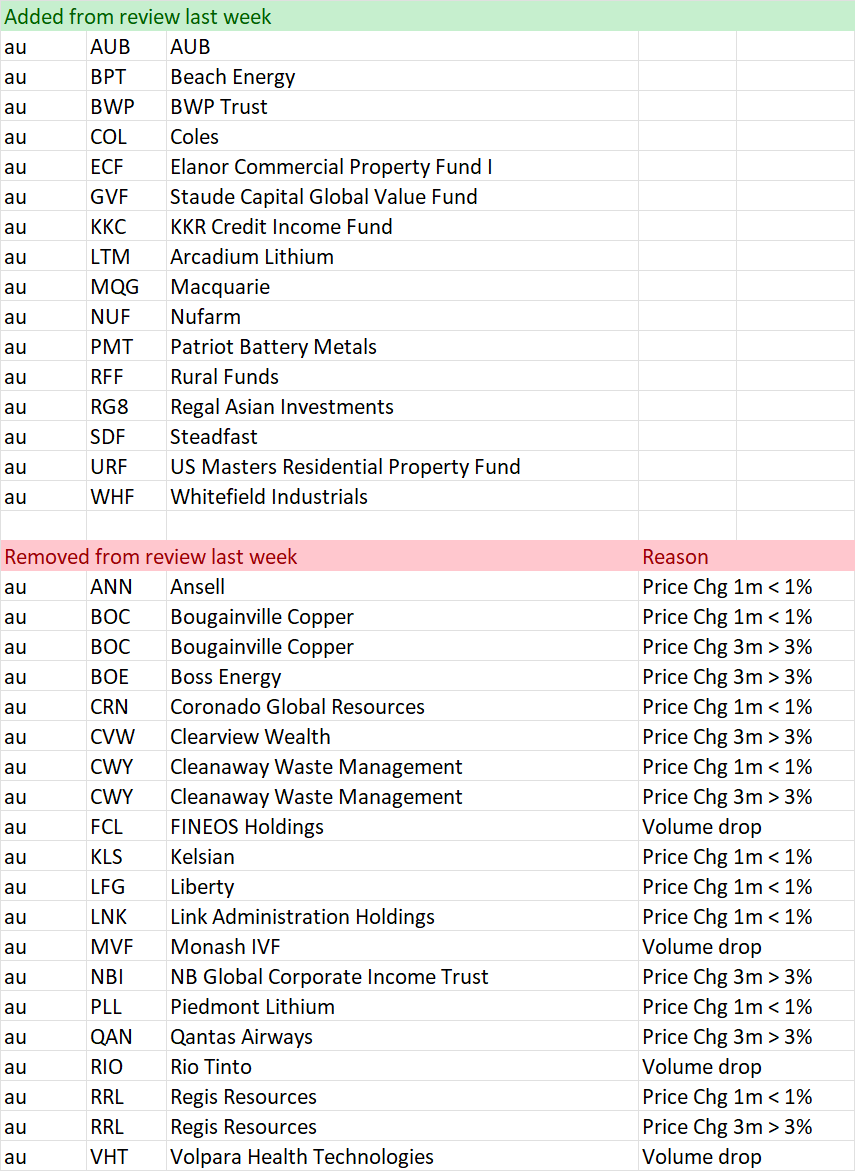
Here is a shortcut in understanding the reasons why a stock is removed:
Volume drop = Bus might be moving, but no one is on it
Price 1 mth < 0% = Bus has been cancelled
Price 3mths >= 3% = Bus has pulled out of the station
Also look at the market capitalisation and liquidity before making any decisions!
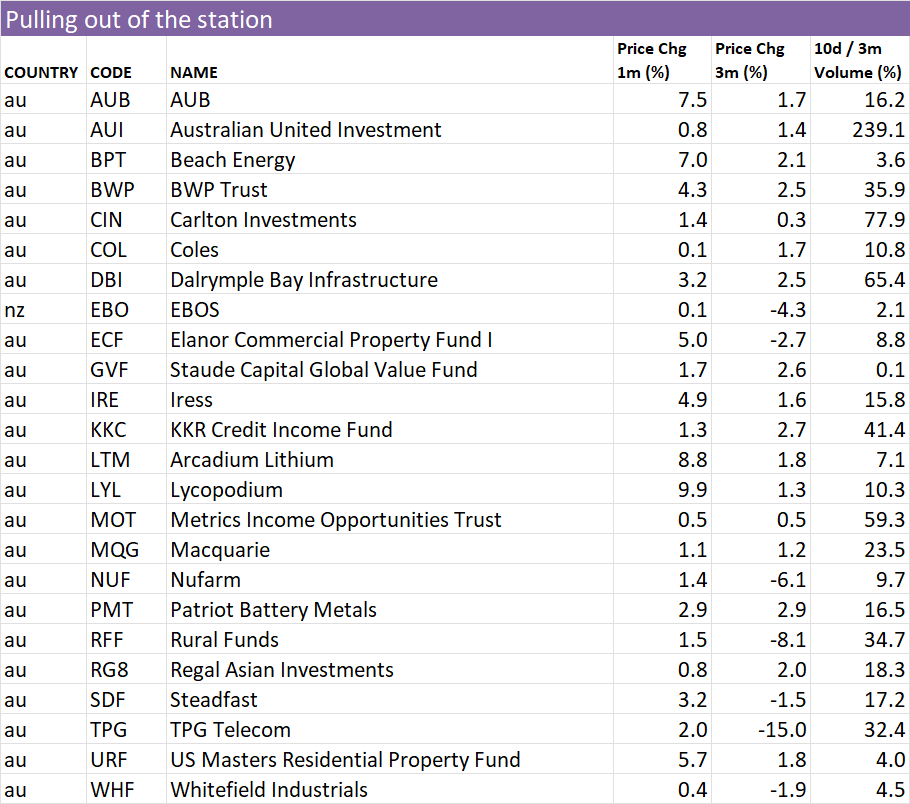
Data is at May 11 and is sorted by the stock code.
Changes from last week
“Pulling out of the station” on 11 May
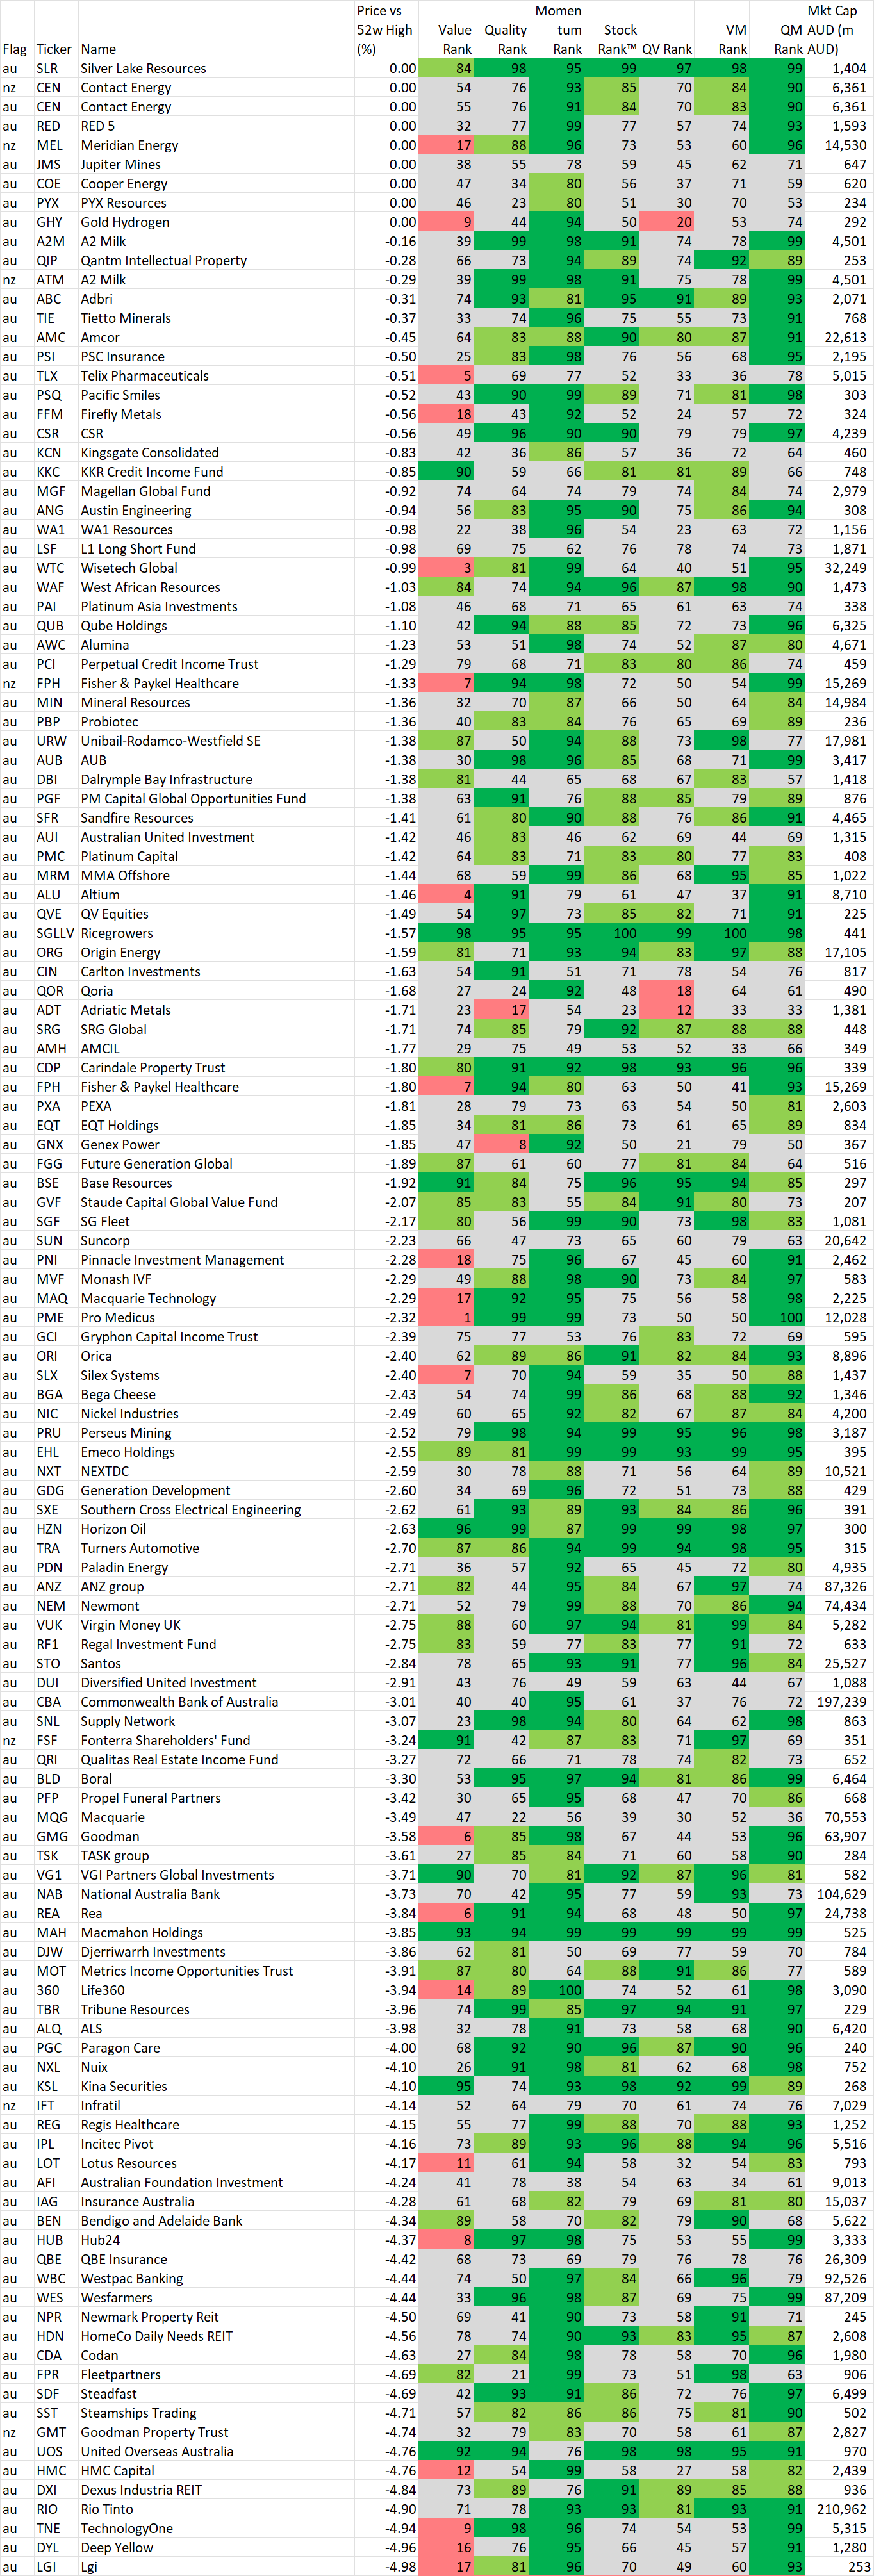
52 week high screen
In this section we identify stocks within 5% of their 52 week intraday high based on the idea, supported by academic studies, that stocks close to their 52 week highs tend to outperform. Weekly changes to the list will also be noted.
If you wish to recreate this screen in the screener select "Price vs 52 high" greater than -5% and Mkt Cap greater than $200M
A stock coming onto the list is NOT an automatic buy, just as a stock that leaves the list is NOT an automatic sell. As with the shine list, assess every chart on its merits. However movements on this list may alert you to interesting charts so be sure to look at Stockopedia and the chart first.
Data is at 11 May and is sorted by the stocks closest to their 52 week intraday high.
Also look at the market capitalisation and liquidity before making any decisions!
And remember, past performance is no guarantee of future performance.
Changes from last week
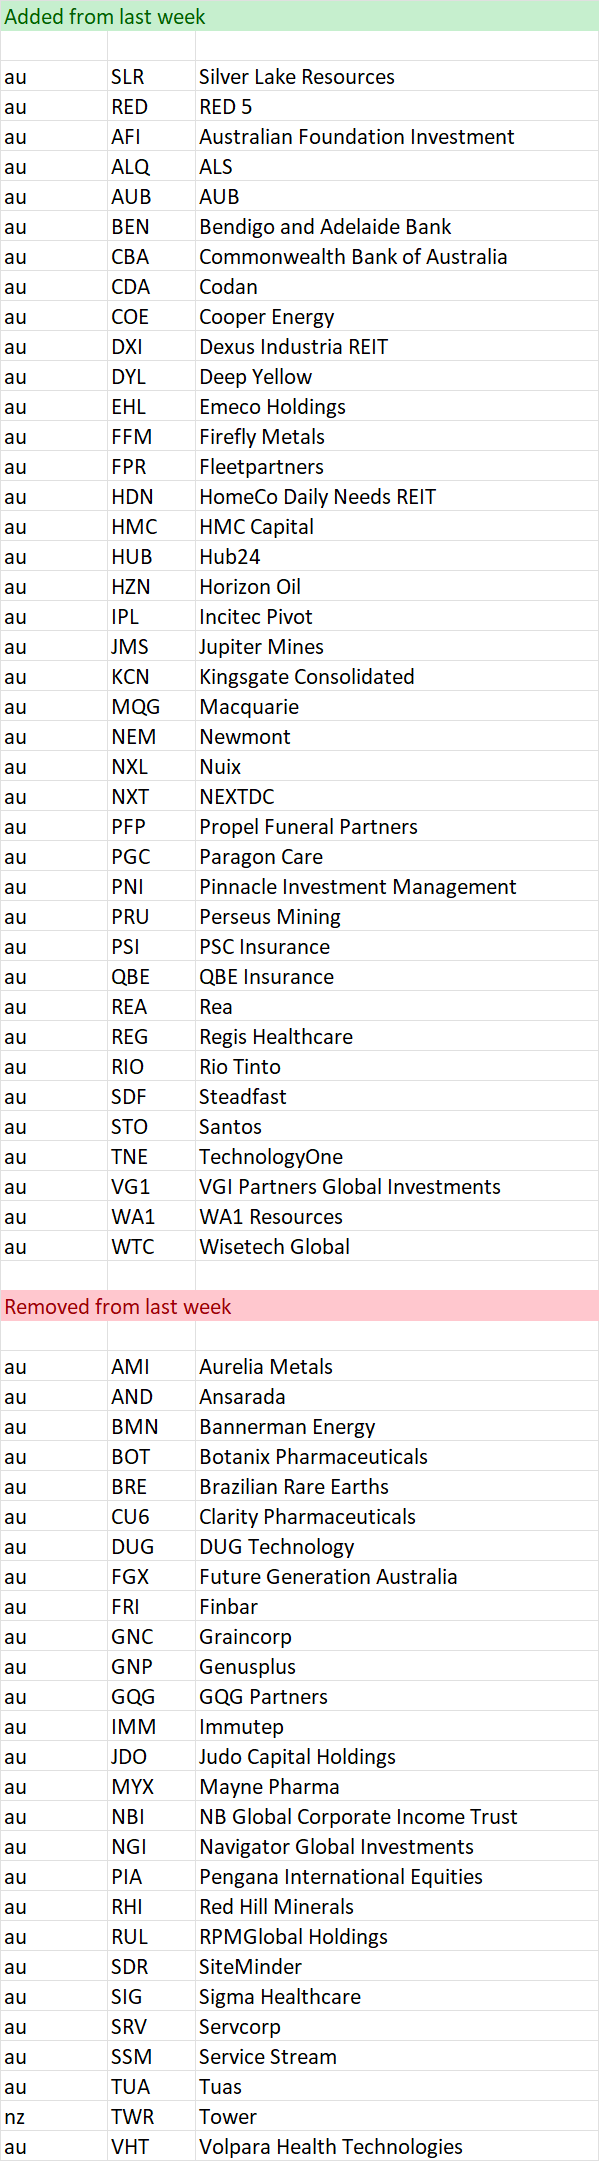
Stocks within 5% of their 52 week high as at 11 May
Important Information: Stockopedia Ltd ABN 39 757 874 670 UK business registration number 0637267 (“Stockopedia”) is an Authorised Representative of Daylight Financial Group Pty Ltd ABN 77 633 984 773 (“DFGPL”) which is the holder of an Australian Financial Services Licence (AFS Licence No. 521404).
Information in this commentary is current as at date prepared unless otherwise stated. However, please bear in mind that investments can go up or down in value, and that past performance is not a reliable indicator of future performance. For more Important Information please refer to the Disclaimer section of this website.
This communication may contain general financial product advice. It has been prepared without taking into account your personal circumstances, and you should therefore consider its appropriateness in light of your objectives, financial circumstances and needs before acting on it.
If our advice relates to the acquisition or possible acquisition of a particular financial product, you should obtain a copy of and consider the Product Disclosure Statement (PDS) before making any decision.
The author holds interests in PME and in companies listed in the data tables . This position can and will change at any time without notice.
Disclaimer
This is not financial advice. Our content is intended to be used and must be used for information and education purposes only. Please read our disclaimer and terms and conditions to understand our obligations.
1 comment
I like the commentary on Broader Market as well as analysis in Member Corner. I normally come back during the week to go through the Member Corner.