Momentum Monday 15 July 2024

Welcome to Momentum Monday.
And so it begins again.
Interesting links
This week on Weekend Watchlist run in conjunction with Shares for Beginners, we cover a great Australian story dominating on the world stage even though many don’t know about it. Its PWH - PWR Holdings. Listen here to the replay
We ran the client only Friday ‘Lunch ‘n Learn’ session. View a recording here
The next edition in the Mastermind series will be Alan Hull of Actvest is on. Book your place here
Our “Empower Others” referral program has been updated and it offers the biggest discount we have available anywhere (Even better than the EOFY offer). To Learn read more here if you are interested in sharing this tool with other like minded investors. There is even a basics of investing email education series that either your friend, or yourself can sign up
For any external commentary we make to the broader market, follow us on Social Media Facebook Linkedin Instagram or X (formerly Twitter)
This week’s content is as follows:
Broader market sentiment
Member corner
Stocks in the “Shine Zone” (including changes)
Momentum Movers *New Section*
52 week high screen (including changes)
A reminder that you don’t have to read all this contribution. Simply scroll to the area of interest. Also the Bus Pulling out of the Station section has been removed. Refer to last week’s edition to understand why.
Broader Market Sentiment
We look at the direction of both the US and ASX markets to gain an understanding of the broader sentiment at the minute. It is important to stress here that I DO NOT use this to time my entry or exit out of stocks. I prefer to use the individual charts of stocks to do that. However I find it useful in helping us determine how aggressive/cautious traders should be in their trading. In short the more positive the broader market is the more risks you can take and vice versa.
US / S&P500
Another positive week for the broad S&P500, another record all time high and another reason to remain in equities globally.

S&P500 Weekly chart
It’s the sixth consecutive positive week with no immediate end in the veracity of this run seen. To date much of the index’s rally has come from tech stocks. In fact the tech sector over there has risen 33% in 2024 with much of that driven by the “Magnificent Seven”. Actually the only other sector that has been up this year this far is Consumer Communications. The rest of the sectors have actually been down. That is why it was pleasingly this week to week that much of the gains experienced were from industrials outside of these groups as traders went deeper to identify value.
The real firecracker reported this week was the inflation rate for the month of June coming in lower than expected. While it remains sticky on our shores, there is real evidence that the pace of inflation is slowing in the US and therefore most market watches have locked in a rate cut come September. While it is a positive this will likely occur I will hasten to remind you of two things…. 1. markets are at all time highs and rates have been going up! 2. Rates will likely not return to emergency levels seen during the peaks of COVID. In short, Sentiment is a powerful beast.
The assassination attempt over the weekend will have more impact politically than on markets. The US are not strangers to such activity, I doubt they will be shocked now.
I point once again to the weekly RSI figure which is just below the overbought 80 level. The MACD, whilst looking unusual, is still a positive, so there is nothing in broad indicators that suggest things are bad.
Last week I mentioned that I would change my watch and act level to 4967 if we experienced another up week and I will do that now.
Less is more when it comes to commenting on this Bull rally. Charts like this are the stuff dreams are made of. But it will change… it always does…. But for now I am still aggressive.
AUS S&P/ASX200
If I had a bell I would be ringing it wildly. Why? Because we are at all time highs. That is why.

S&P/ASX200 Weekly chart
The S&P/ASX200 finished the week at new levels not seen before, despite the negative close on the US market the day before. It does feel like though that we are more about the US at the moment than domestic factors. Though it ain’t me causing this. Sure I talk about, but when our market seems more excited buly global rate cuts rather than sticky inflation at home. Who am I to say it's wrong? This new order no better evident on Friday when our Real Estate sector was amongst the best performers on the prospect of a potential global rate cut. And IT was our worst because our sector is small and if the magnificent 7 are sold off, so too our big IT names need to be sold down.
But the weekly RSI remains above 50, and what I see as key structural levels hold therefore I see no change to my previously stated sentiment or remaining aggressive for as long as the index stays above 7547 in the short term.
Less is definitely more at the minute (I know I have said that before).... I suppose is f there is anything else to comment on its that I notice over the weekend that John Setka resigned as secretary of the CFMEU. I say, "Good Riddance!"
Member corner
In this section we will provide a detailed chart assessment, on a maximum of ten stocks weekly, on companies from those of you in the Gallery.
We welcome stock requests to be analysed from members. We will also be looking at the charts of some of the more actively researched stocks for the week. We will try to rotate through a selection so as to not make the charts stale, however we will likely not cover a stock within 2 months of when it was last discussed.
If you want to see what has been written about a stock recently, go to the discussion area.

We will not be making up suggestions. If there are no changes to the most viewed list and/or there are no suggestions from members, then no stocks will be covered.
To learn of the methods used to analyse companies in this section, refer to my Momentum Journey series that I articulate here in three parts.
They will help provide context on what I am writing about and the editorial angle of this report.
Also look at the market capitalisation and liquidity before making any decisions!
And again, if you have a stock you would like analysed from a momentum perspective, please write it into the comments section below or email us at support@stockopedia.com.au
IF NO ONE ASKS… HOW AM I SUPPOSED TO KNOW?!?
ASX:NAB Limited
StockRank 78
Momentum Rank 98
QM Rank 76
VM Rank 93
A$36.95
A member has asked about National Australia Bank (ASX:NAB) and it has been a long time since we looked at the company from a Momentum perspective. It was actually in March last year. You can read it here.
I will mention that has a bank it is inherently linked to our our economy and therefore the price will often reflect its strength. Charts are not particularly useful in my view when they are so big as they tend to be more the focus of the index investor.
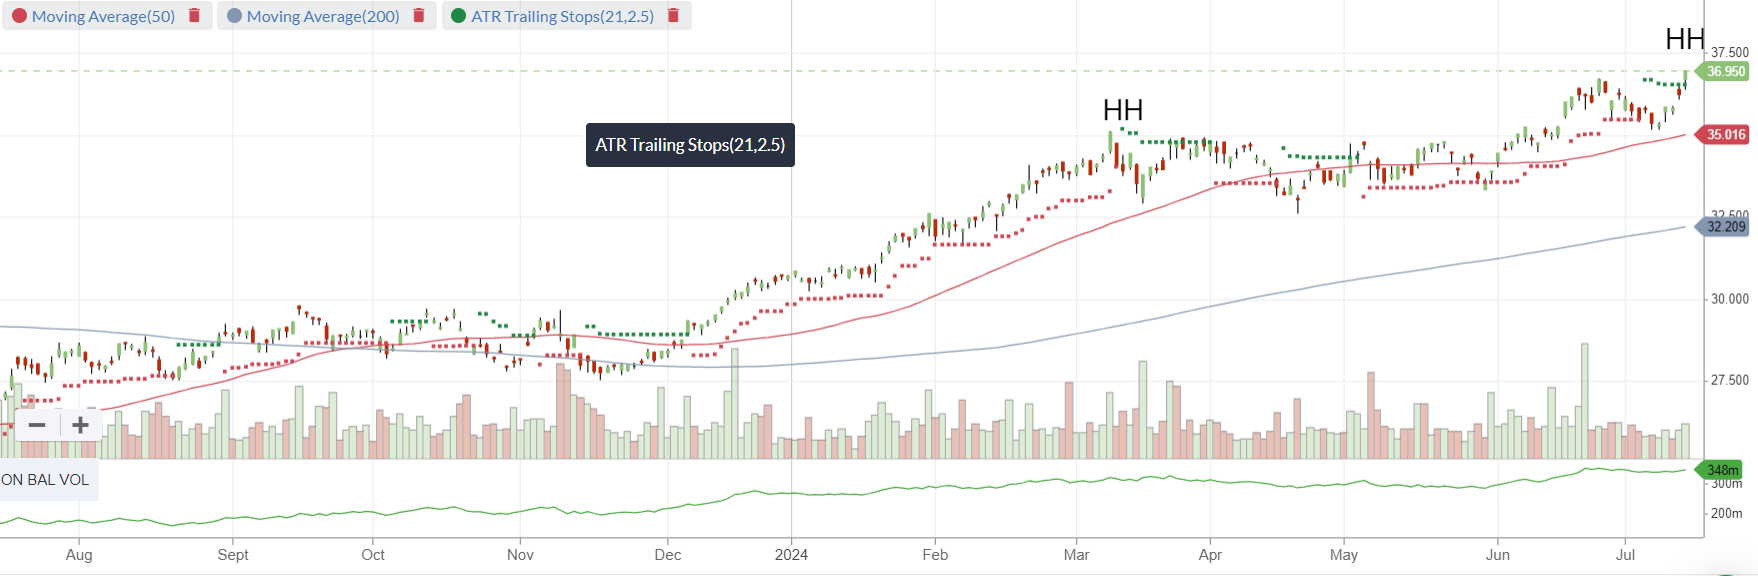
ASX:NAB 1 year Daily chart
I did say at the time "A break below $25,92 could see sub $22 target come into play" and that "I would look for a clean break above $33.14."
OK... the price got to $25.16 creating a new lower low.... but it held. It subsequently started to improve, it even did as I said, crossed above $33.14, then opulled back and that was the entry opportunity. The stock is now at 52 week highs and I am generally a big fan of that. The price is also above the 200 day moving average and has crossed above the 2.5x ATR. It would be in the shine zone list if the QM score were above 80.
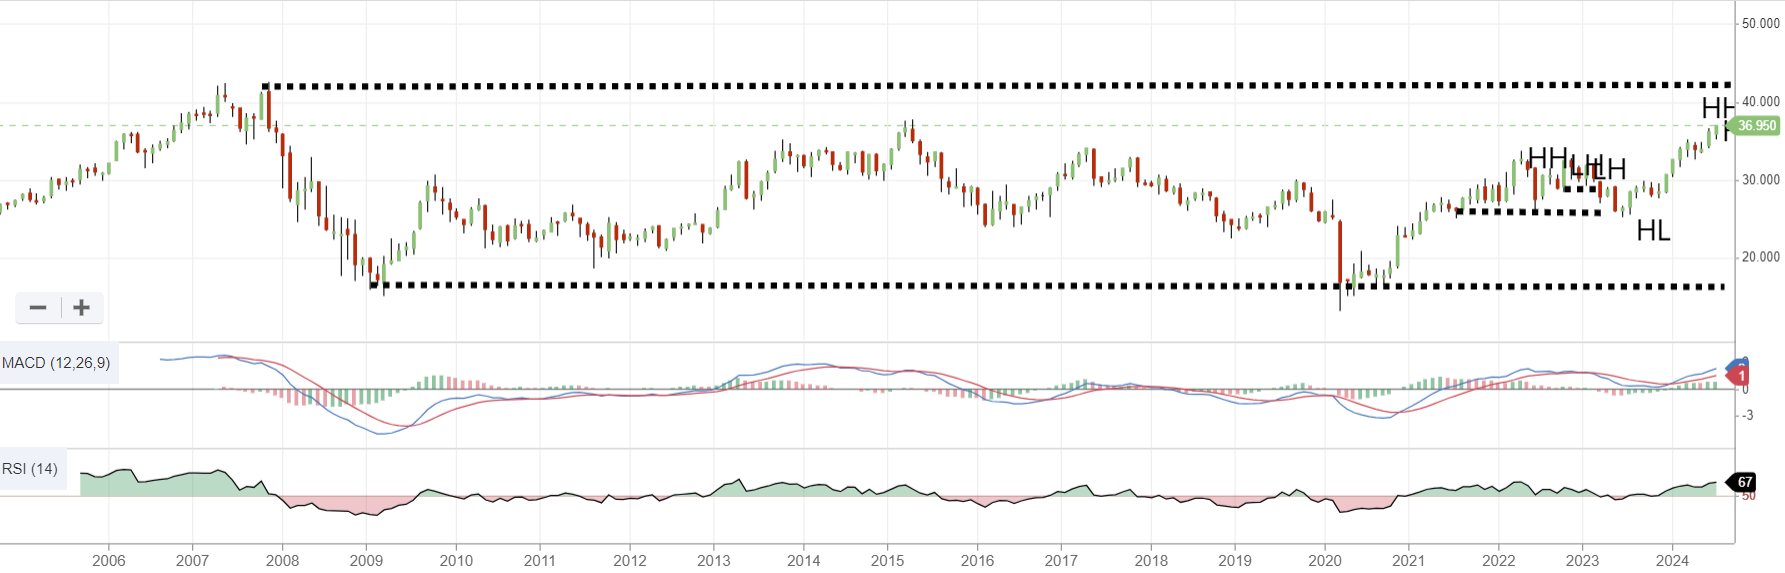
ASX:NAB Since 2005 Monthly chart
No matter. It is trading around the highs of 2015 and then should it conquer that, the all time highs pre GFC, One would argue the economy is much better now than it was back then, but as mentioned a number of times now. The power of sentiment is strong. That said, strong dividends (with the exception of the Covid period would have kept investors happy. So too the CYBG Demerger. But it is clear of the long term channel that is formed and that price is closer to the top at the moment than the bottom. Therefore that all-time high level will be keenly watched, and a possible level for taking some profits... Assuming you haven't held them since day dot... and that was a long time ago. The stock appeared on the ASX in 1962.
ASX:SXE - Southern Cross Electrical Engineering Ltd
StockRank 94
Momentum Rank 94
QM Rank 98
VM Rank 85
A$1.715
It is one of our NAPS stocks. We talked about it on Friday, we have spoken extensively about this business for a Fundamental perspective a number of times. But the last time we discussed Southern Cross Electrical Engineering (ASX:SXE) from a Momentum perspective was two months ago. You can read that commentary here

ASX:SXE 1 year Daily chart
But I will spare you the time. Actually it is surprisingly well covered by us and well viewed by members, not just because of its NAPS inclusion. Rather it is the amazing run in price that it has experienced. There really wasn’t much else to add at that time give the stock was trading at all time highs and they were about to announce the Collie Battery project.
But it was at all time highs and it kept powering along.
So what now?
I feel the recent choppiness is a good thing for the price longer term as it creates a new base to work with. I would have my stop at $1.505 from here as it was a level that has come close to testing in May and June. Hyper sensitive traders may move that price up to $1.68 (I wouldn’t though). If you haven’t held the stock yet, a break above $1.795 is required to create some clean air ahead of.
I only caution investors again that as an engineering business earnings an margins can be fickle. Therefore watch carefully and when it comes to leaving some profit on the table don’t stress about it..
ASX:WBC Westpac Banking Ltd
StockRank 85
Momentum Rank 98
QM Rank 81
VM Rank 96
A$27.90
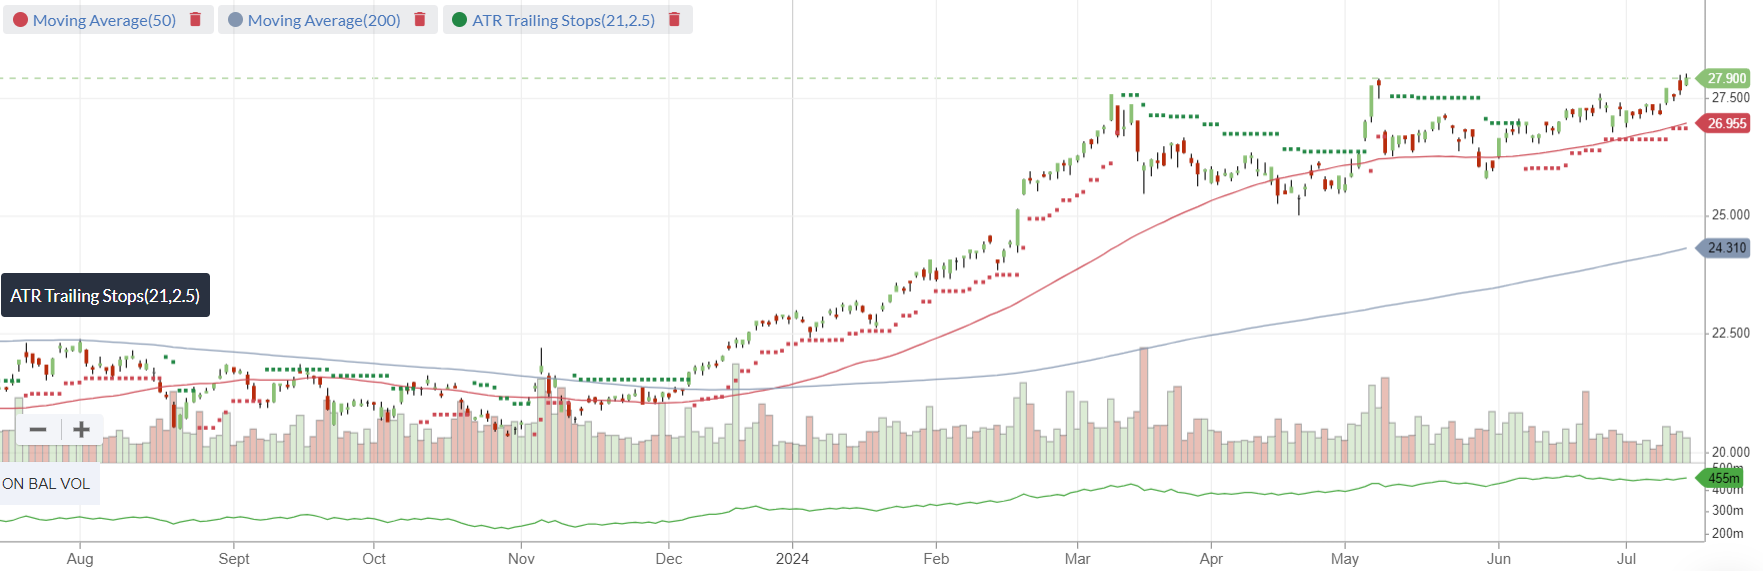
ASX:WBC 1 year Daily chart
The stock is at a 52 week high, and if you look at it from a ranking perspective it is our preferred over it and NAB. A key difference though was that its all time high came in 2015. So my next targets will be the high in 2019 ($29.89) and the high in 2017 ($35.09)
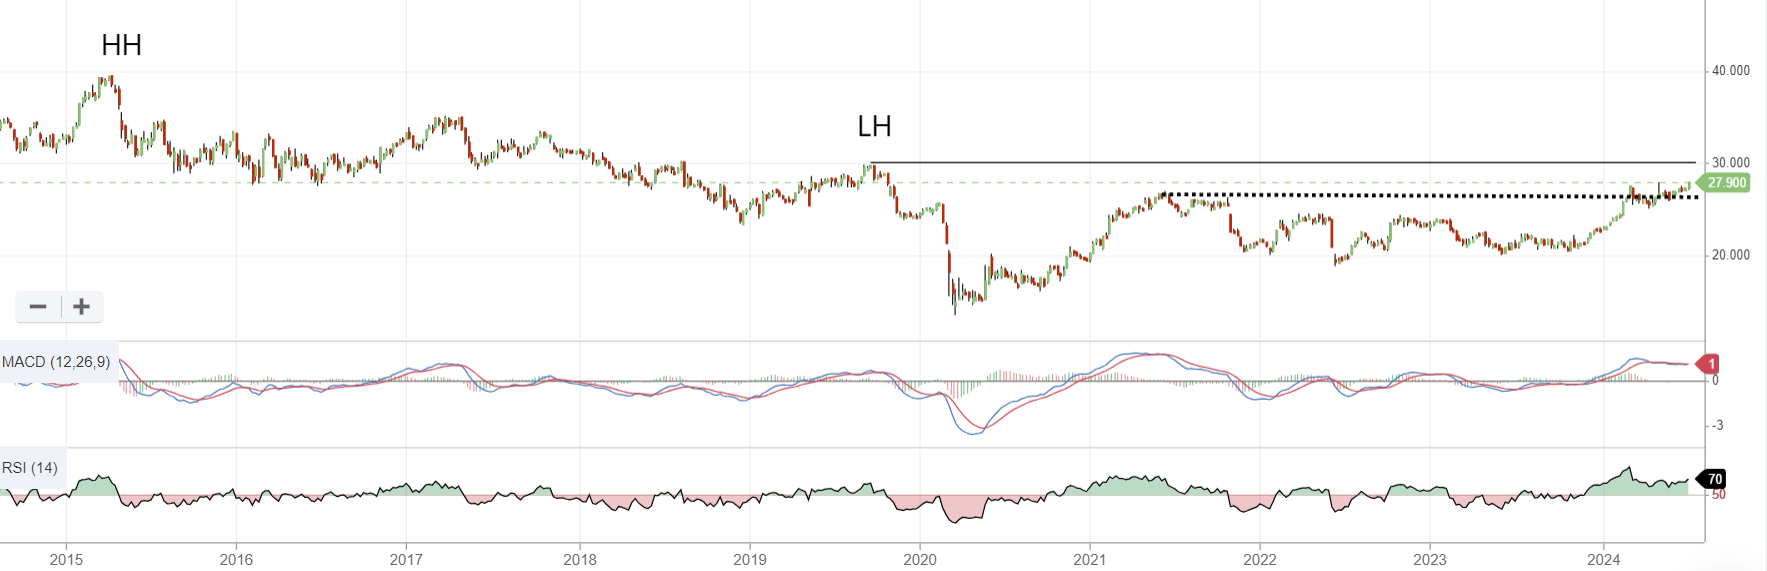
ASX:WBC 10 year Weekly chart
Pleasingly it got above the highs of 2021 so the stock is for now in an uptrend (notwithstanding the obviousness) and it needs to hold $19.40 for that to remain in place (in my view). But all my previous comments on banks and indexes remain. As the economy grows this stock will melt up over time. (This doesn't mean there will be periods of underperformance) On the surface it looks like it has more to gain than the NAB individual issues aside. But I think over the long run they will be somewhat correlated.
Long story short, its in an uptrend for now. Its in the Shine Zone and it is at 52 week highs. Sentiment is positive.
ASX:NHC New Hope Coal Limited
StockRank 99
Momentum Rank 97
QM Rank 98
VM Rank 99
A$4.95
Coal stocks are often sort by many members as they are cheap and they spit out cash. However it seems a perennial battle between bull and bears. Suffice to say, I am happy using the charts on this one. And we last discussed it from a Momentum perspective back in March this year

ASX:NHC 1 year Daily chart
At the time I mentioned some of my basic tenements were not satisfied, the big one being that the price is below the 200 day average. However, I do have a more positive tone on the price now. Members can see that it actually did get above the 200d MA briefly at the start of this financial year, what this created was a new short term higher high.Though the price seems to have some resistance at $5.30 given it was tested in June then in July. In my view the stock needs a clean brake above these levels, and just as importantly hold the long term support level of the $4.50- $4.58 range. This would see the stock confirm the short term uptrend, the price will be above the stocks 2.5x ATR and 200d MA. If you are going to take an aggressive stance from here “you won;t have to wait long to know if you are wrong. But as a reminder the price of the commodity is out of its hands. A recovery in Coal price will see NHC go up.
ASX:CUV Clinuvel Limited
StockRank51
Momentum Rank 31
QM Rank 66
VM Rank 18
A$15.65
During the week I noticed that members were looking at Clinuvel Pharmaceuticals (ASX:CUV) which is unsurprising from a Momentum perspective given the stock rose as much as 16.7% on results of the use of afamelanotide on reducing inflation to UV exposure. Subsequently the price plummeted, but has this changed the state of play for the stock?

ASX:CUV 1 year Daily chart
This is not the first time the stock is discussed within Stockopedia. It has been discussed fundamentally here in November last year,, but it was also discussed a number of times from a Momentum perspective, most recently here (this was published over 12 months ago now.). I actually took a small loss on this trade as the rally wasn’t able to break above $21.40 and lost steam. I didn’t have the patience to hang around.
Since then a few things have happened. Most importantly, We can see a long term, support range between $13.20 and $14.16. I say long range because it was tested in October 2018, March 2020, June 2022 and most recently in March 2024. Such a long term level has to be respected, and I am anchoring my current view to that.

ASX:CUV Since 2018 Weekly chart
The other thing to note is that irrespective of the support area, this stock was in a short term downtrend. That was until the announcement on July 5th when the spike created a new short term, higher high. As is customary for me, I wait for the pullback…. (Though I didn’t know the next two days would be so negative) and being of an aggressive mindset I am back in on Friday as the price crossed above the 200 day MA..
So what levels am I watching for here?. .
Obviously that support range is crucial from here on in, I have a chosen my parachute stop loss to be at the bottom of the channel at $13.20 (about 15% from when I got in - its wider because I am aggressive at the moment.)
When will I take some profit? Probably around that $21.40 level, just in case it proves to be a stubborn resistance level. (I don’t know whether it will or not.). If it does break that level with whatever I have in it, then I am optimistic it could get back to levels from before the Feb 2023 collapse. But we’ll see how this plays out.
ASX:GNP Genusplus Limited
StockRank 94
Momentum Rank 94
QM Rank 99
VM Rank 83
A$2.14
I noticed a stock that members have been looking at that I have never invested in, but it has been included in the Shine Zone and 5% from the 52 week high list on and off for a while. It is Genusplus (ASX:GNP). It has never been discussed from a Momentum perspective either until today but there is really not much more one can add to a chart that looks like this.

ASX:GNP 1 year Daily chart
What can I say? It is at all time highs (not just 52 weeks). But I will add it is an engineering business (Perennially cheap but volatile) and liquidity (though it has picked up) can be a little shallow at times.
What levels would one look for here? As members should be aware….I don’t chase, therefore if you haven’t enjoyed the run that the company has experienced, I would wait for the stock to pull back a few cents. A stop loss at that support level of $1.79 makes sense to me. I also like that the recent run up has been supported by the OBV (On balance volume) which has been tracking the price as well. If it continues to win contracts it will hold its own. But I have a natural aversion to them from a long term perspective, therefore I will use the charts with this one.
Stocks in the Shine Zone
To learn about the Shine Zone and how to use it, you can read it here.
The rules for inclusion in this list are based on those I like to see in a stock before considering a trade in it:
QM Rank above 80
Price is above the 2.5x ATR
50d MA is above the 200d MA
Price is greater than the 200d MA
Market cap greater than $200M
This is a very important point: the “Shine Zone” are rules for possible buying. They are not for holding and/or selling. If a stock falls out of the shine zone, use support levels to set your stops, or instigate a parachute stop if necessary. With markets moving sideways, one expects frequent changes in these lists.
If you feel there is a stock that should be included but is missing please let us know. This is a manual process and occasionally one gets through the cracks
Also look at the market capitalisation and liquidity before making any decisions!
Data is at 13 July and is sorted by the stock code.
Changes from last week
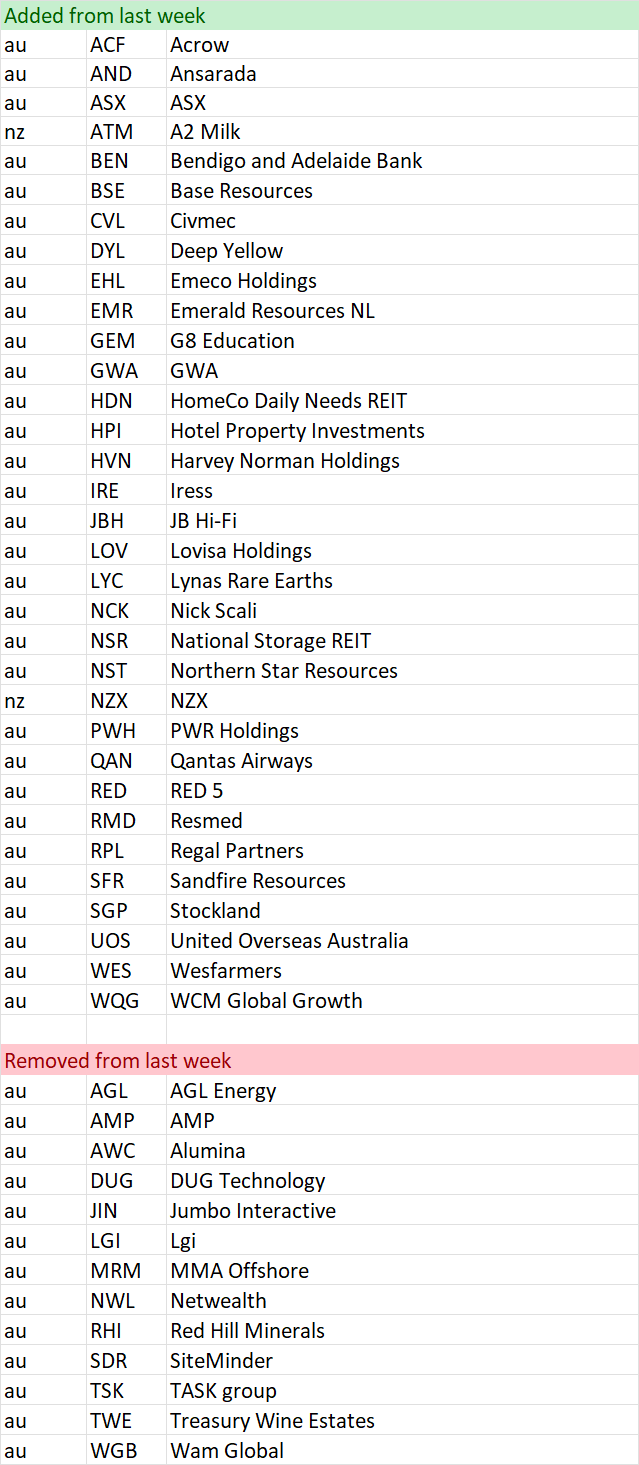
Shine Zone list as at 13 July

Momentum Movers *New Section*
There is a school of thought that the change in something is just as important as the absolute number itself. Momentum is our most volatile ranking. This section is intended to bring to readers attention the big moves from a Momentum Perspective. As with other lists this is not designed to be a list of stocks that are replicated. Rather it can be a starting point of investigation for further consideration. Initially it will record weekly changes. This will include a monthly change when enough time has elapsed. This section is divided into two lists.
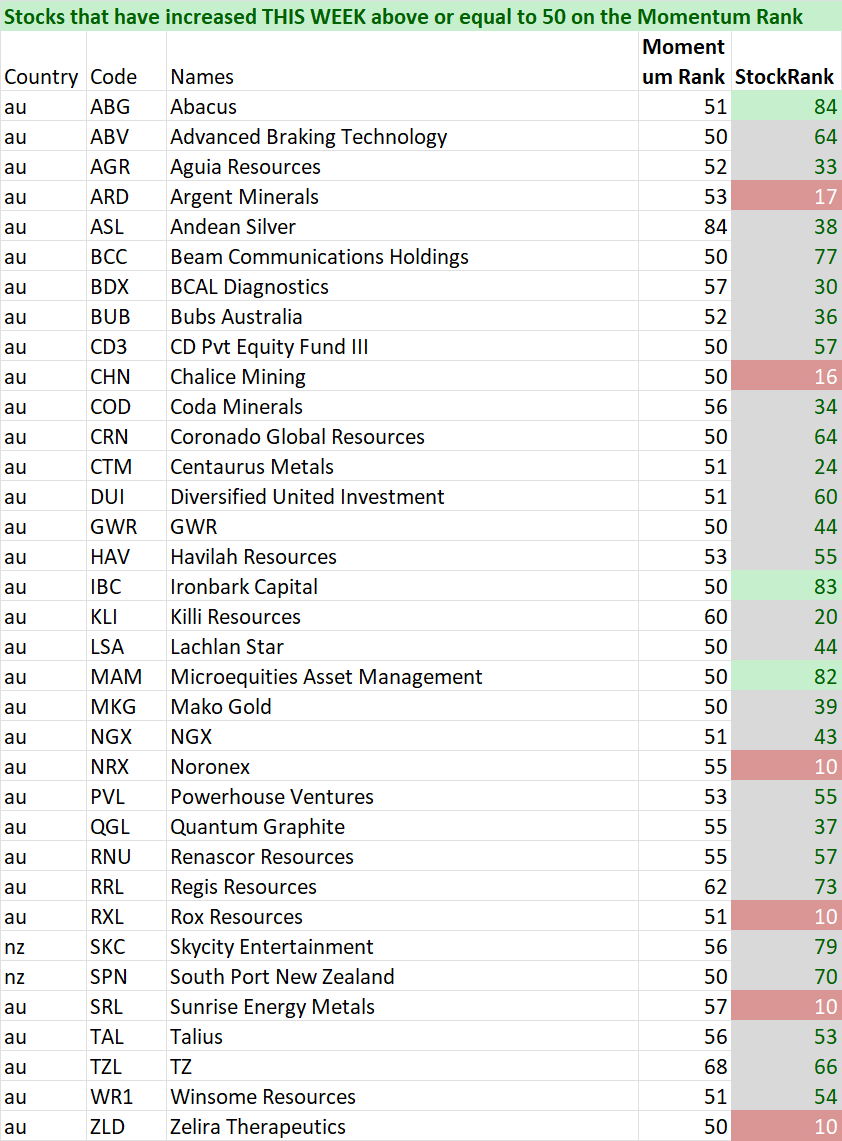
First is a list of stocks that have just crossed above 50 from a Momentum perspective. By definition, these will be stocks that have improved over the past week and month and may warrant further investigation. As a bare minimum a look at liquidity and market cap.
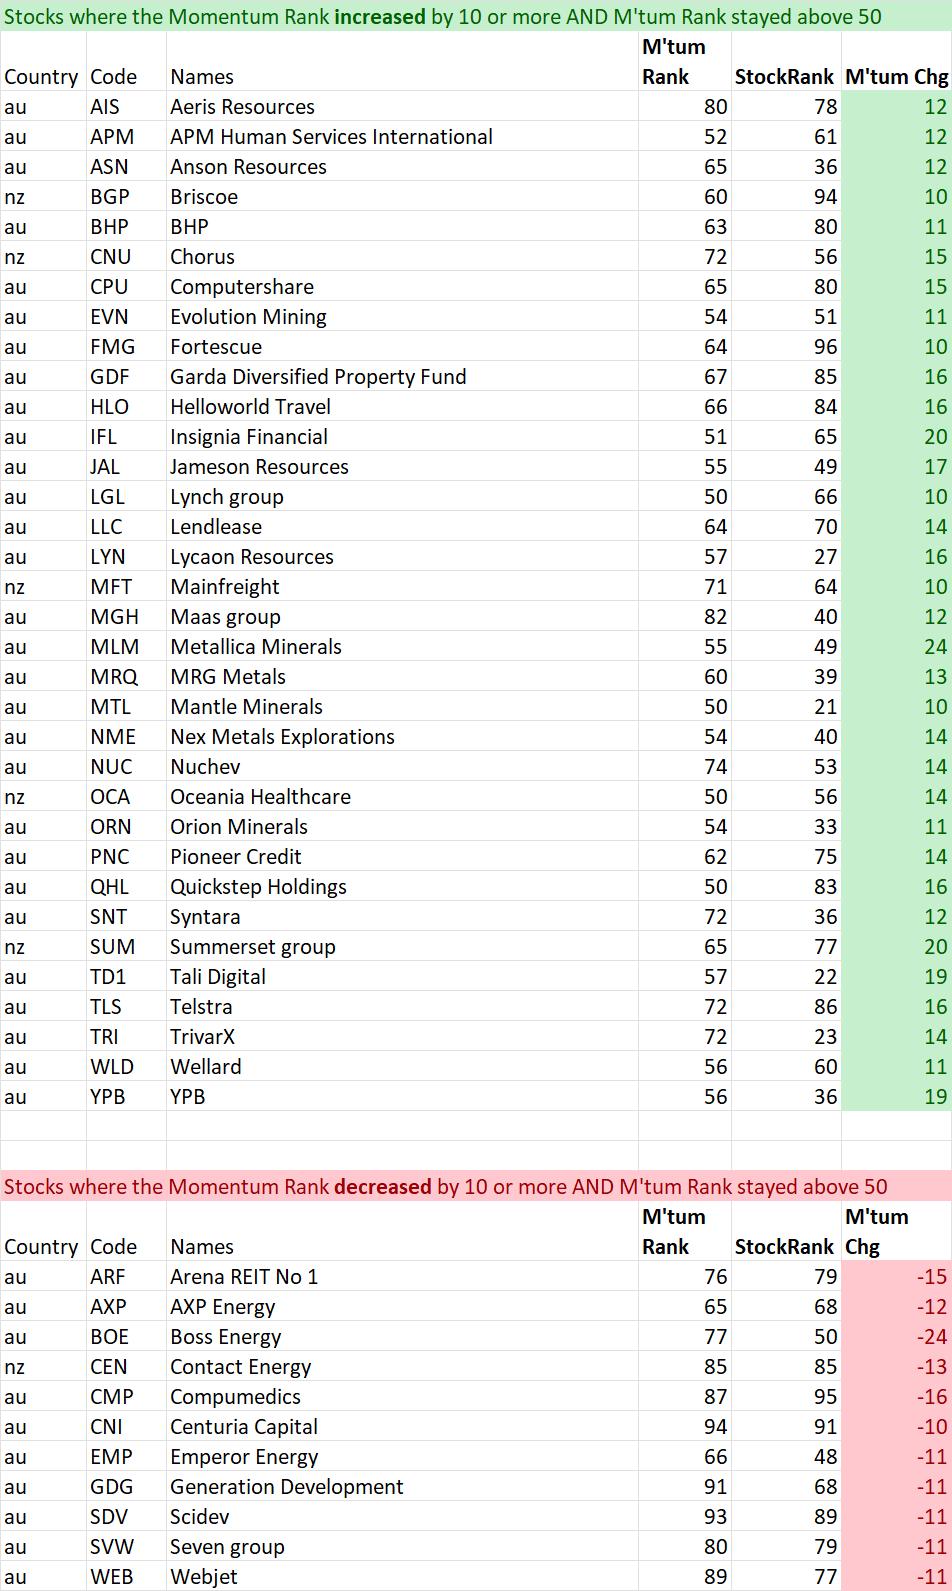
The second list measures all stocks that are currently ranked above 50, have remained above 50 during the time periods analysed (ie not just added or removed) AND whether they have improved or worsened by more than 10 points on the Momentum Rank.
As this is a new list we welcome any feedback you may have. If we have missed anything, do let us know.
Data is at 13 Jul and is sorted by their code.
And remember, past performance is no guarantee of future performance.
Stocks that have crossed above 50 over the week
Stocks that have change Momentum significantly in the past week
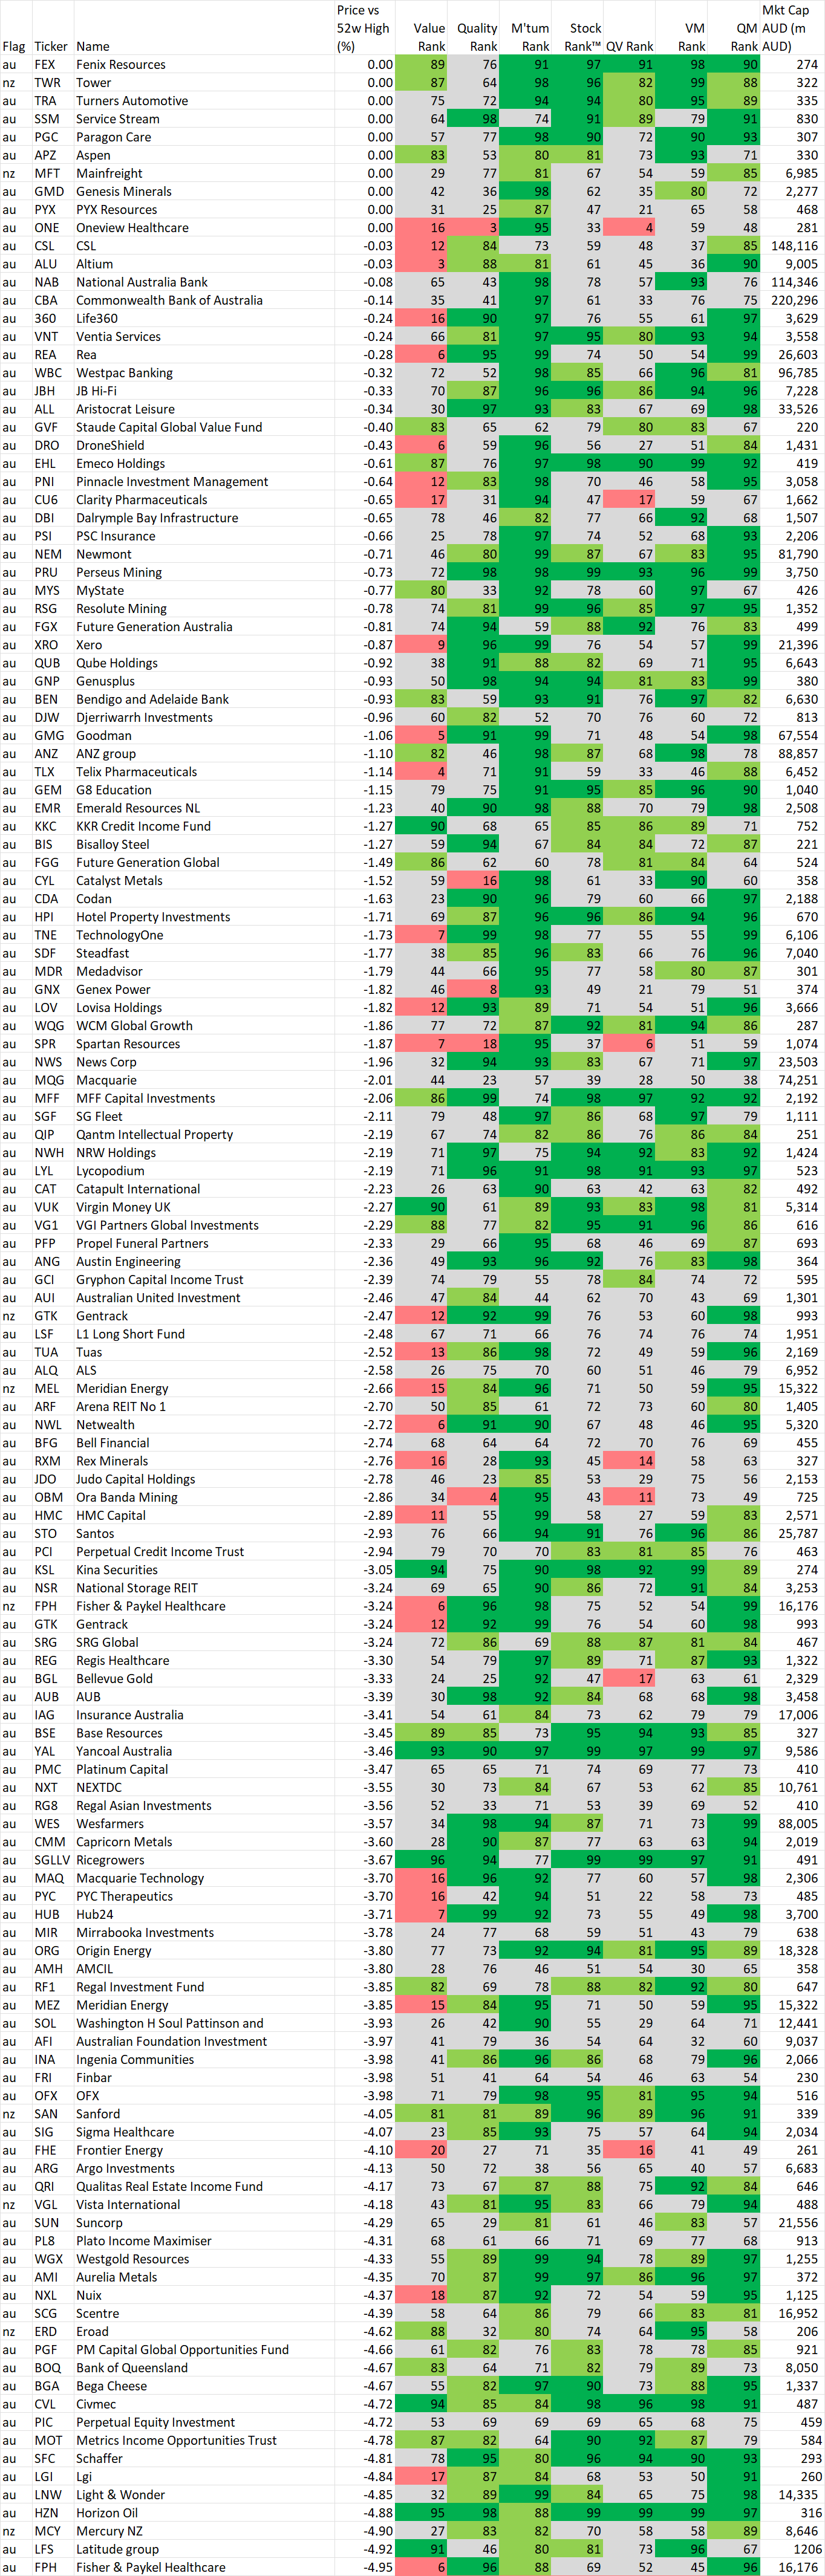
52 week high screen
In this section we identify stocks within 5% of their 52 week intraday high based on the idea, supported by academic studies, that stocks close to their 52 week highs tend to outperform. Weekly changes to the list will also be noted.
If you wish to recreate this screen in the screener select "Price vs 52 high" greater than -5% and Mkt Cap greater than $200M
A stock coming onto the list is NOT an automatic buy, just as a stock that leaves the list is NOT an automatic sell. As with the shine list, assess every chart on its merits. However movements on this list may alert you to interesting charts so be sure to look at Stockopedia and the chart first.
Data is at 13 Jul and is sorted by the stocks closest to their 52 week intraday high.
Also look at the market capitalisation and liquidity before making any decisions!
And remember, past performance is no guarantee of future performance.
Changes from last week
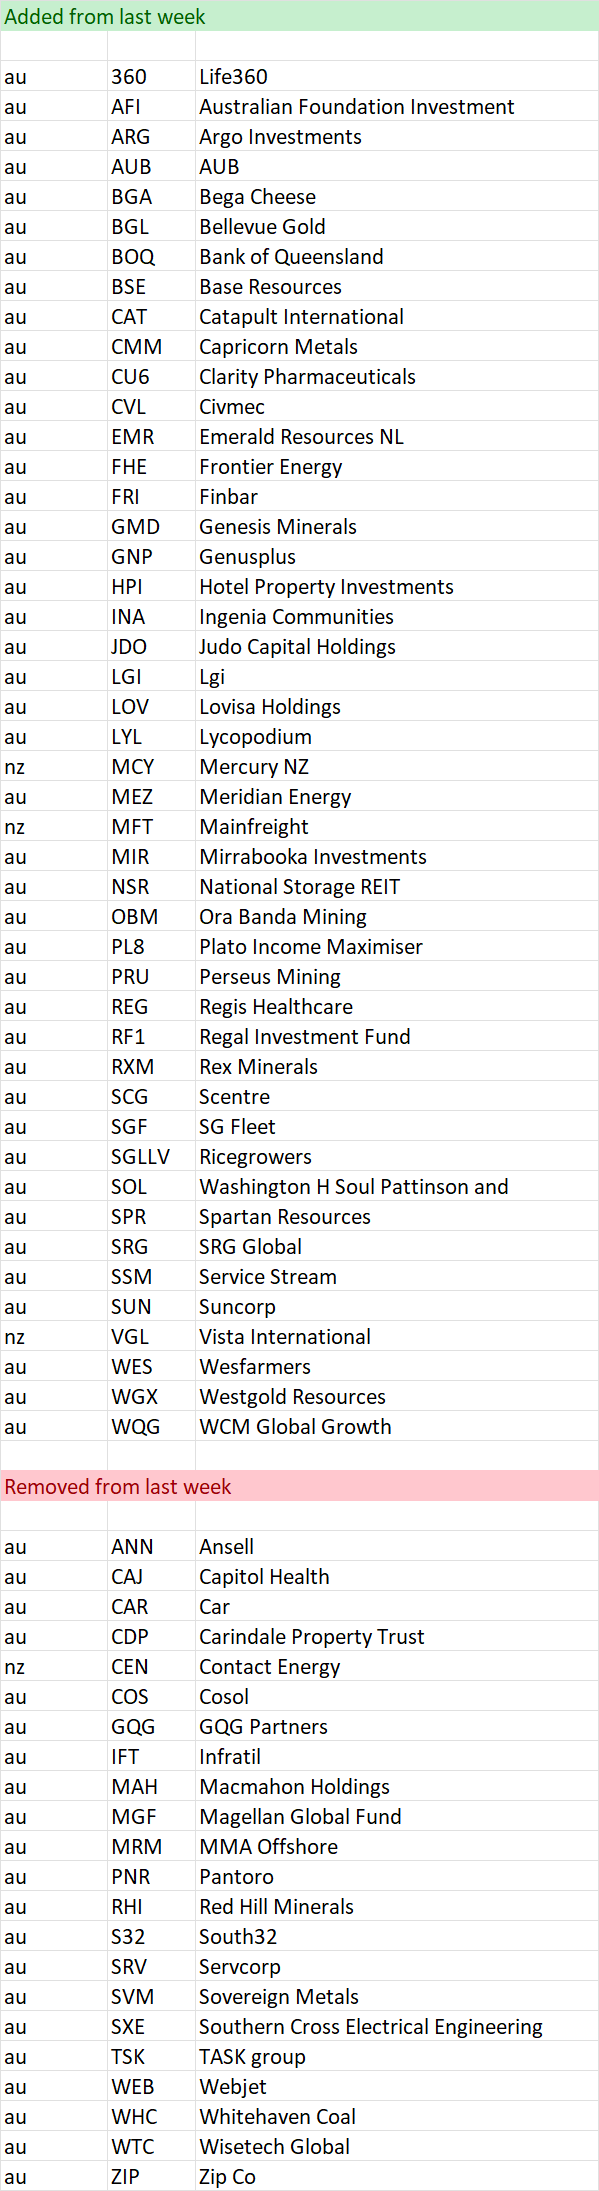
Stocks within 5% of their 52 week high as at 13 Jul
Important Information: Stockopedia Ltd ABN 39 757 874 670 UK business registration number 0637267 (“Stockopedia”) is an Authorised Representative of Daylight Financial Group Pty Ltd ABN 77 633 984 773 (“DFGPL”) which is the holder of an Australian Financial Services Licence (AFS Licence No. 521404).
Information in this commentary is current as at date prepared unless otherwise stated. However, please bear in mind that investments can go up or down in value, and that past performance is not a reliable indicator of future performance. For more Important Information please refer to the Disclaimer section of this website.
This communication may contain general financial product advice. It has been prepared without taking into account your personal circumstances, and you should therefore consider its appropriateness in light of your objectives, financial circumstances and needs before acting on it.
If our advice relates to the acquisition or possible acquisition of a particular financial product, you should obtain a copy of and consider the Product Disclosure Statement (PDS) before making any decision.
The author holds direct interests in SXE, CUV and companies listed in the data tables . This position can and will change at any time without notice.
Disclaimer
This is not financial advice. Our content is intended to be used and must be used for information and education purposes only. Please read our disclaimer and terms and conditions to understand our obligations.
No comments yet
No one has commented here yet! Why not be the first one?