Momentum Monday 15th April 2024

Welcome to Momentum Monday.
The events of the weekend stand as a reminder of why we do this thing in the first place, and it is to help all those we value most. Therefore, be sure to take some time today to remind those closest to you how special they are and why you do what you do. It may not solve all your problems - but I definitely know the genuine sentiment will be appreciated.
It was great again to talk to our members on Friday’s ‘Lunch and Learn’ Our members' enthusiasm is what keeps us going. And it was great to talk to many members last week who may be discovering this contribution for the first time. While I don’t profess to be an expert at this stuff, just like you I have tinkered and found a system that works for me. Hopefully you find it as informative to read it, as I do writing it.
We also have great news coming over the coming weeks and we will be share it with you all shortly. So stay tuned as there is quite a bit happening in the Stockopedia world.
Interesting links
Weekend Watchlist with Shares for Beginners this week is a Stock with lots of lessons. It is DUG Technology. Listen here to the replay
If you want to watch a replay of the Friday Lunch 'n Learn webinar click here
Our “Empower Others” referral program will e undertaking a change. For now we maintain the current system, be sure to Learn more here if you are interested in current plan
For any external commentary we make to the broader market, follow us on Social Media Facebook Linkedin Instagram or X (formerly Twitter)
This week’s content is as follows:
Broader market sentiment
Member corner
Stocks in the “Shine Zone” (including changes)
Buses pulling out of the station (volume + price movers)
52 week high screen (including changes)
A reminder that you don’t have to read all this contribution. Simply scroll to the area of interest.
Broader Market Sentiment
We look at the direction of both the US and ASX markets to gain an understanding of the broader sentiment at the minute. It is important to stress here that I DO NOT use this to time my entry or exit out of stocks. I prefer to use the individual charts of stocks to do that. However I find it useful in helping us determine how aggressive/cautious traders should be in their trading. In short the more positive the broader market is the more risks you can take and vice versa.
US / S&P500
Ok. So this is the first consecutive down week for the S&P500 since the lows of October.

S&P500 Weekly chart
Many are now saying, "surely it has arrived" following the 1.6% decline in the broad market last week, that the pause in Momentum that we all have been asking for. It's coming.
Look it's true, sentiment has started to shift. Not only because of stubborn inflation in the US that saw bond yields rise strongly, but also because of the tensions in the Middle East and how they have even escalated further as Iran retaliates to an attack on its soil and the US sends troops to the region in response.
This uncertainty has acted as a key reason why for example why oil has done well recently, and gold prices trade around record highs (plus the US dollar is strong). But I can't help but feel that adding such narratives to price moves is futile. As previously alluded to, I would have eaten my hat if energy prices after the October attack didn't rise, but in fact they fell which reminded me why I should never pay much heed to the headlines. Hence why I am a happy Stockopedia member.
Rather than focus too much on the minutia I know prices zig and zag, and they have been zigging for 6 months, so a zag is due. Is it now? Who knows? Though I will let the chart tell me. Though for as long as the index stays above 4766 in the short-term, my sentiment is unchanged.
Other things however that could have contributed to the volatility in the near term recently is the US quarterly earnings season which has just commenced in the US, kicked off by the big financial institutions as is usually the case. This time around however optimism abounds, therefore any negative views will be pounced on.
This will be heaped on the uncertainty of stubborn inflation, a looming Presidential election and of course a cryptic Fed whose previously expressed view of three rate cuts likely to occur before the end of the year is dismissed by many as a bridge too far (notwithstanding the Baltimore Bridge issues.) I hasten to remind everyone that while the events may have minimal actual impact on our businesses, the impact on sentiment may be more significant (hence why I started this piece)
Back to the charts and not only has the RSI started to roll over, but the two moving average lines on the MACD have converged and are about to crossover showing the pace of the run experienced in recent months has started to ease.

Weekly MACD and RSI since the start of 2024
For those that like their moving averages, the index has touched fallen the 50d moving average for the first time since November last year, adding further weight to the point expressed above.

S&P500 Daily Chart since start of November 2023
Either way, in my view the negative move is yet to be of a significant size to warrant attention, therefore I remain in global equities and maintain my aggressive stance until I don't need to anymore. I am not beholden to the idea, it's just how the cards are distributed at the moment.
AUS S&P/ASX200
It was a bit of a nothing week this week for the XJO. Though without the sell down on Friday it would have been better. And notwithstanding the tragic events of the weekend, our market eked out a small gain for the week with the S&P/ASX200 rising 0.3%, though given the weaker close in the US on Friday , we are likely to follow suit this on Monday.

S&P/ASX200 Weekly chart
But looking at the commentary you can be excused for thinking our Pensions have been drained and Centrelink has been inundated, but the reality is, things are still good.
Fears that the Middle East conflict is about to break into region-wide war is what is dominating the financial press at the minute. It has pushed up oil prices, which presents a threat to local (as well as global) inflation and appears to be dashing local investors’ hopes of interest rate relief this year. Especially as inflation levels remain where they are.
There was some reprieve for the iron ore price recently as traders bet that ‘surely’ the Chinese government would do something? Unfortunately this didn’t translate to out big miners, particularly on Friday.
Also want to reiterate that talk of rising bond rates internationally are not good news for our large corporations who tend to tap global markets for debt funding. Therefore when we hear talk of it, we must be cognisant of the potential impacts here.
Likewise the MACD moving averages are on the verge of tipping over. Plus a look at the lists below and they show a significant drain in recent times. While they are still well populated, it adds wood to the ‘bear case’ fire.
But putting my bull hats back on, I would be floored if equity markets hadn’t already ‘priced in’ Iran’s involvement. Sure the narrative may change, but the operational performance of our businesses haven’t to date. Talk surrounding China, interest rates and Inflation will likely be more relevant. The RBA could also do with a favour from the currency, however it continues to weaken against most majors which is not good for consumers or business (note: a weak AUD is not good for importers)
An announcement that may have been missed by many, though is important to support a fledgling sector has been Treasurer Jim Chalmers announcing a type of business investment allowance to drive capital towards green energy and advanced manufacturing. While the details are scarce at best, the acknowledgement is something we have hopefully learnt post-COVID that we need to rely on ourselves more, and there should be increased government investment into things we can be best in the world at.
While more details will be released at budget time, the acknowledgement is appreciated and would bring us inline with many of our major trading partners given they already have such similar policies in place themselves.
I am not changing my view on the markets at the minute, but I am expecting a bumpy ride.
Member corner
In this section we will provide a detailed chart assessment, on a maximum of ten stocks weekly, on companies from those of you in the Gallery.
We welcome stock requests to be analysed from members. We will also be looking at the charts of some of the more actively researched stocks for the week. We will try to rotate through a selection so as to not make the charts stale, however we will likely not cover a stock within 2 months of when it was last discussed.
If you want to see what has been written about a stock recently, go to the discussion area.

We will not be making up suggestions. If there are no changes to the most viewed list and/or there are no suggestions from members, then no stocks will be covered.
To learn of the methods used to analyse companies in this section, refer to my Momentum Journey series that I articulate here in three parts.
They will help provide context on what I am writing about and the editorial angle of this report.
Also look at the market capitalisation and liquidity before making any decisions!
And again, if you have a stock you would like analysed from a momentum perspective, please write it into the comments section below or email us at @stockopedia.com.au">support@stockopedia.com.au
IF NO ONE ASKS… HOW AM I SUPPOSED TO KNOW?!?
ASX: BHP - BHP Limited
StockRank 80
Momentum Rank 71
QM Rank 79
VM Rank 77
A$45.52
It's been two months since we last looked at this business.... It's a little different than your usual, given it is the biggest company on the ASX. It is BHP (ASX:BHP)

ASX:BHP 1 year Daily chart
At the time we mentioned the stock was trying to get out of the quagmire it was and needed to $42.70. Unfortunately it couldn't. Therefore the general disposition remains “messy.”
The reality is for as long as it remains a price taker, a large part of its future will be determined by the price of the underlying commodities they deal with.
So tracking the iron ore and copper price will explain much of the price movement. And let's face it, the demand for steel has fallen on the back of the Chinese local construction sector collapsing. No one believes the Chinese Government and its growth target ahead, so it stands to reason that the price of the commodities dealing with the Chinese economic growth engine have struggled. Though it was different last week.
For now, following the breach, the price keeps moving sideways at best. Negative at worst. This is something we must consider in light of its substantial size and influence on the index,
ASX:S32 - South32
StockRank 53
Momentum Rank 38
QM Rank 51
VM Rank 45
A$3.29
Speaking of price takers, this is the first time we talk of South32 (ASX:S32) within this forum, which is probably a good thing given the terrible two years it has had. Perhaps investors are looking at it now thinking the worst may possibly be over

And perhaps it may be, though the chart is yet to suggest that. I alluded to the all time high back in 2022. Since then the price has been on a steady decline following a series of lower highs and lower lows.
However when I look at the longer term chart I see a clear level of resistance/support at $3.55. Support when the price tested that level in October 2022, then July and August 2023. This turned into structural resistance on the strong breakdown with a test in October and January.

ASX:S32 5 year Weekly chart
So to put it simply, in my view this stock is in a downtrend and there is no point waking me up until it crosses back above $3.55. Even then, any subsequent pullback needs to hold the LL of $2.82. If it fails to hold that level there is a real risk of it falling to $1.70 which in my mind is the next level of structural support..
But as was the case with BHP, the trajectory of its key commodities will have strong say in earnings. Therefore as S32 is a conglomerate of sorts, look to the price of the underlying commodities it deals in as this a very different beast than after the original demerger with BHP. For example Aluminum makes up more of their business as does Zinc Nickel and Silver. They have even re-introduced Copper whereas that have sold off the South African energy business. Long story short - remove any preconceptions and have a look at their website to understand what is now driving the business.
ASX:WHC - Whitehaven Coal
StockRank 98
Momentum Rank 83
QM Rank 92
VM Rank 96
A$7.68
Speaking of price takers, a stock I like, but most recently I lost money on a trade is Whitehaven Coal (ASX:WHC)

ASX:WHC 1 year Daily chart
Back then I said I would set a stop at $7.81 and therefore hope that it stops falling around $7.20. In fact it got to as low as $6,43, Either way, the price is still yet to get back to that level. Notwithstanding the short term loss, I remain undeterred given the dynamics of the business, in particular after their recent purchase of the coking coal assets. The fact it is cheap and spits cash is also a benefit. But I will waiting until the price gets above the short term higher high of $8.43 until I start looking at this again. Because in my view it is in a short-term downtrend. Much like BHP and other big price takers - the chart looks messy.
ASX:DUG - DUG Technology
StockRank 59
Momentum Rank 81
QM Rank 82
VM Rank 48
A$2.80
In that same edition we also discussed DUG Technology (ASX:DUG) and a member has requested that we look at it again, and I can only wish that all my stocks looked like this at 52 week and all time highs..

ASX:DUG 1 year Daily chart
I spoke about it recently on the Shares for Beginners podcast (see the link above) and Chris has also written about it. (You can find that in the Discussion section.)
In the past revision within Momentum Monday I said I had a stop at $2.10. It has not been hit. Though there was a scare in late Feb, though it looks like the sell down was a ‘fat finger’ error as the stock bounced quite aggressively and it actually closed higher than what it opened at. In case you are interested there is a short term stop at $2.40, but I have now been on this for a while and I will keep riding it for as long as it goes North East.
Please refer to the article, podcast and its recent announcements for our fundamental view.
ASX:WTC - Wisetech Global
StockRank 64
Momentum Rank 97
QM Rank 94
VM Rank 50
A$90.34
Sticking with the beneficiaries of AI and a growing market share, another question was received on Wisetech Global (ASX:WTC), a stock we haven’t looked at from a Momentum perspective since this time last year.

ASX:WTC 1 year Daily chart
At the time the bulls were running and I mentioned a stop at $61.53. Well actually the price kept running (as did the stop) all the way to $88.44. What happened subsequent to that was a large sell off that saw the stock gap down and breach my lifting stop loss. While it tried a mini recovery the next day, it failed so ultimately I was out.
I was feeling cock-a-hoot then as I saw the price retrace all the way down to $58.16. It even breached that old level mentioned. But obviously since then the market rally and appreciation in all thing remotely AI saw its price recover. So much so it had a gap up, and then created a new short-term and all time high.
So I am now waiting for the right time to re-enter. The gap created in Feb 24 is calling to me like a beacon. I am tempted to remain patient until that is filled, or at least close to. That price range is $79.85 - $84.00. I would set a parachute stop below my entry price. I feel this will be more useful than the structural level of support of $70.30 - $71 though not to far off. Because no matter how you cut it, WTC remains one of the more expensive stocks on our exchange. Even with a pullback to my zone, they won’t be cheap… So ‘buyer beware’ - this is something I have said since $5.00, so I will let you decipher how useful that has been.
Stocks in the Shine Zone
To learn about the Shine Zone and how to use it, you can read it here.
The rules for inclusion in this list are based on those I like to see in a stock before considering a trade in it:
QM Rank above 80
Price is above the 2.5x ATR
50d MA is above the 200d MA
Price is greater than the 200d MA
Market cap greater than $200M
This is a very important point: the “Shine Zone” are rules for possible buying. They are not for holding and/or selling. If a stock falls out of the shine zone, use support levels to set your stops, or instigate a parachute stop if necessary. With markets moving sideways, one expects frequent changes in these lists.
If you feel there is a stock that should be included but is missing please let us know. This is a manual process and occasionally one gets through the cracks
Also look at the market capitalisation and liquidity before making any decisions!
Data is at 13 April and is sorted by the stock code.
Changes from last week
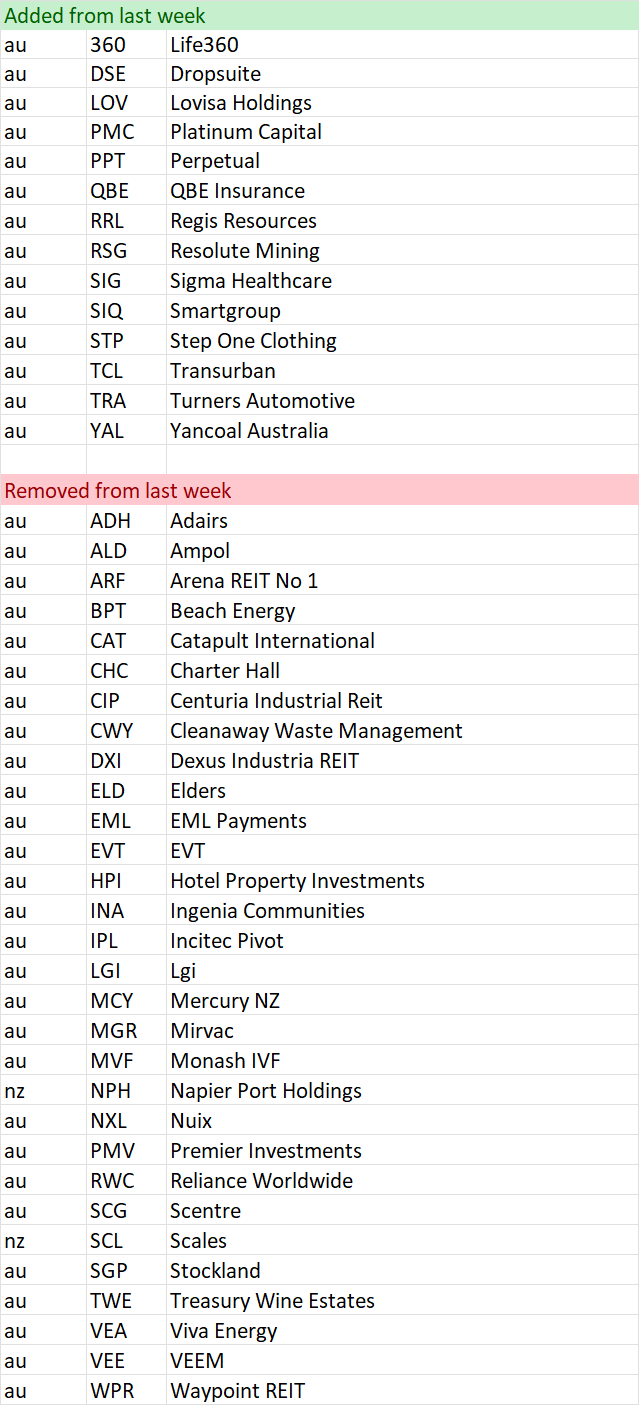
Shine Zone list as at 13 April

“Bus pulling out of the station”
To learn more about this screen read the following article on the objective of the screen
Here is a shortcut in understanding the reasons why a stock is removed:
Volume drop = Bus might be moving, but no one is on it
Price 1 mth < 0% = Bus has been cancelled
Price 3mths >= 3% = Bus has pulled out of the station
Also look at the market capitalisation and liquidity before making any decisions!
Data is at 13 April and is sorted by the stock code.
Changes from last week
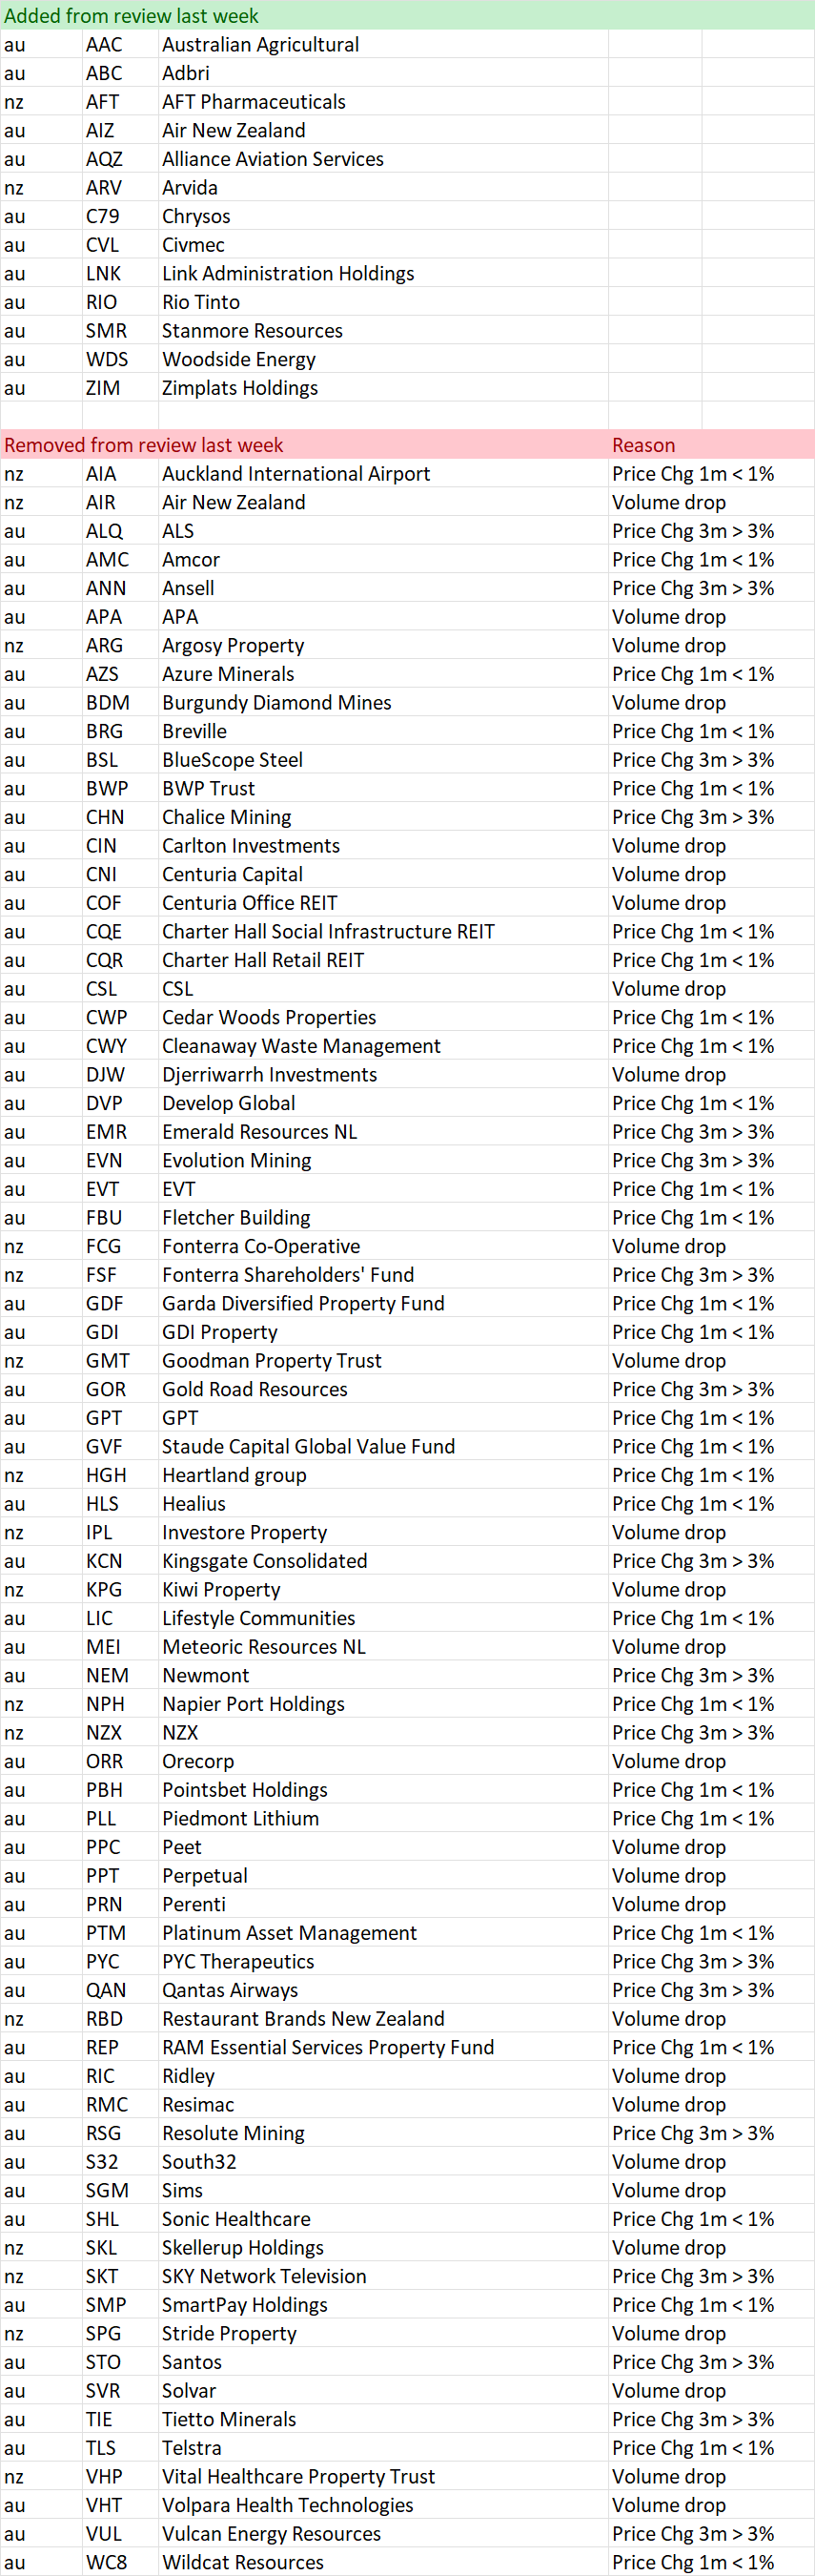
“Pulling out of the station” on 13 April
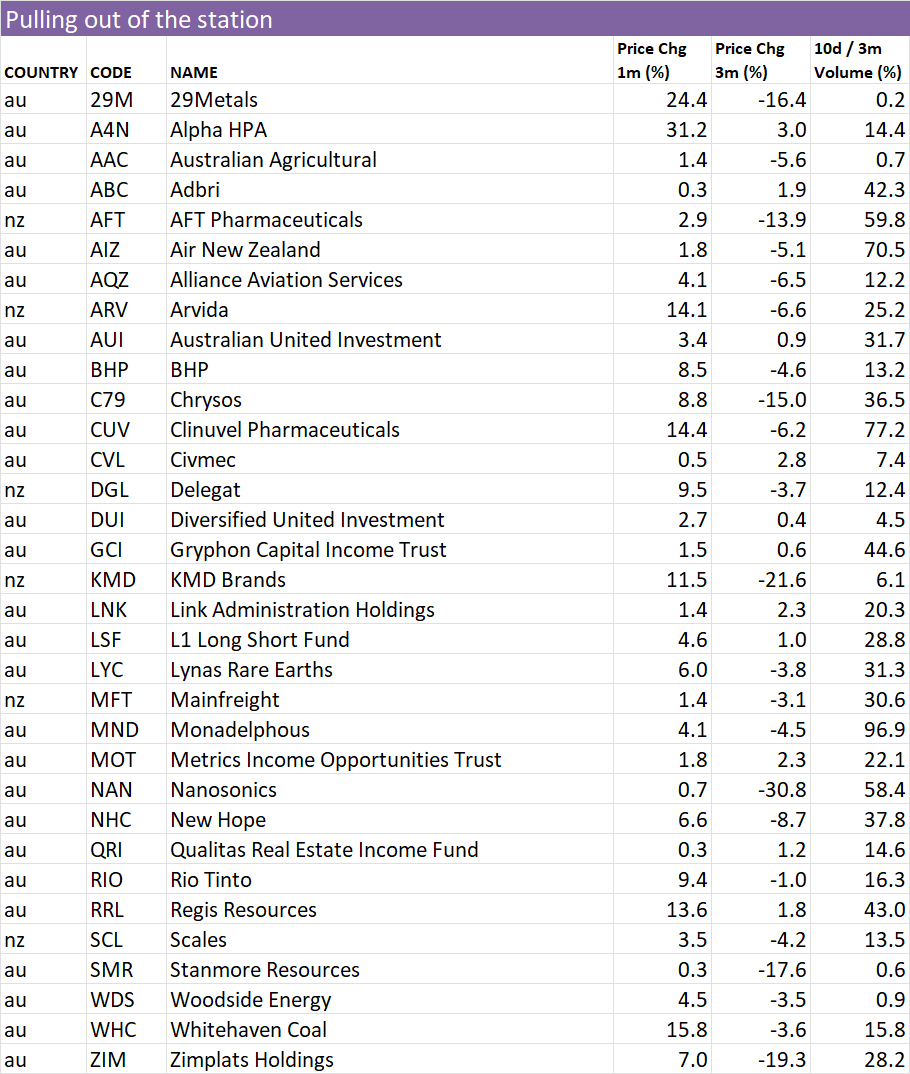
52 week high screen
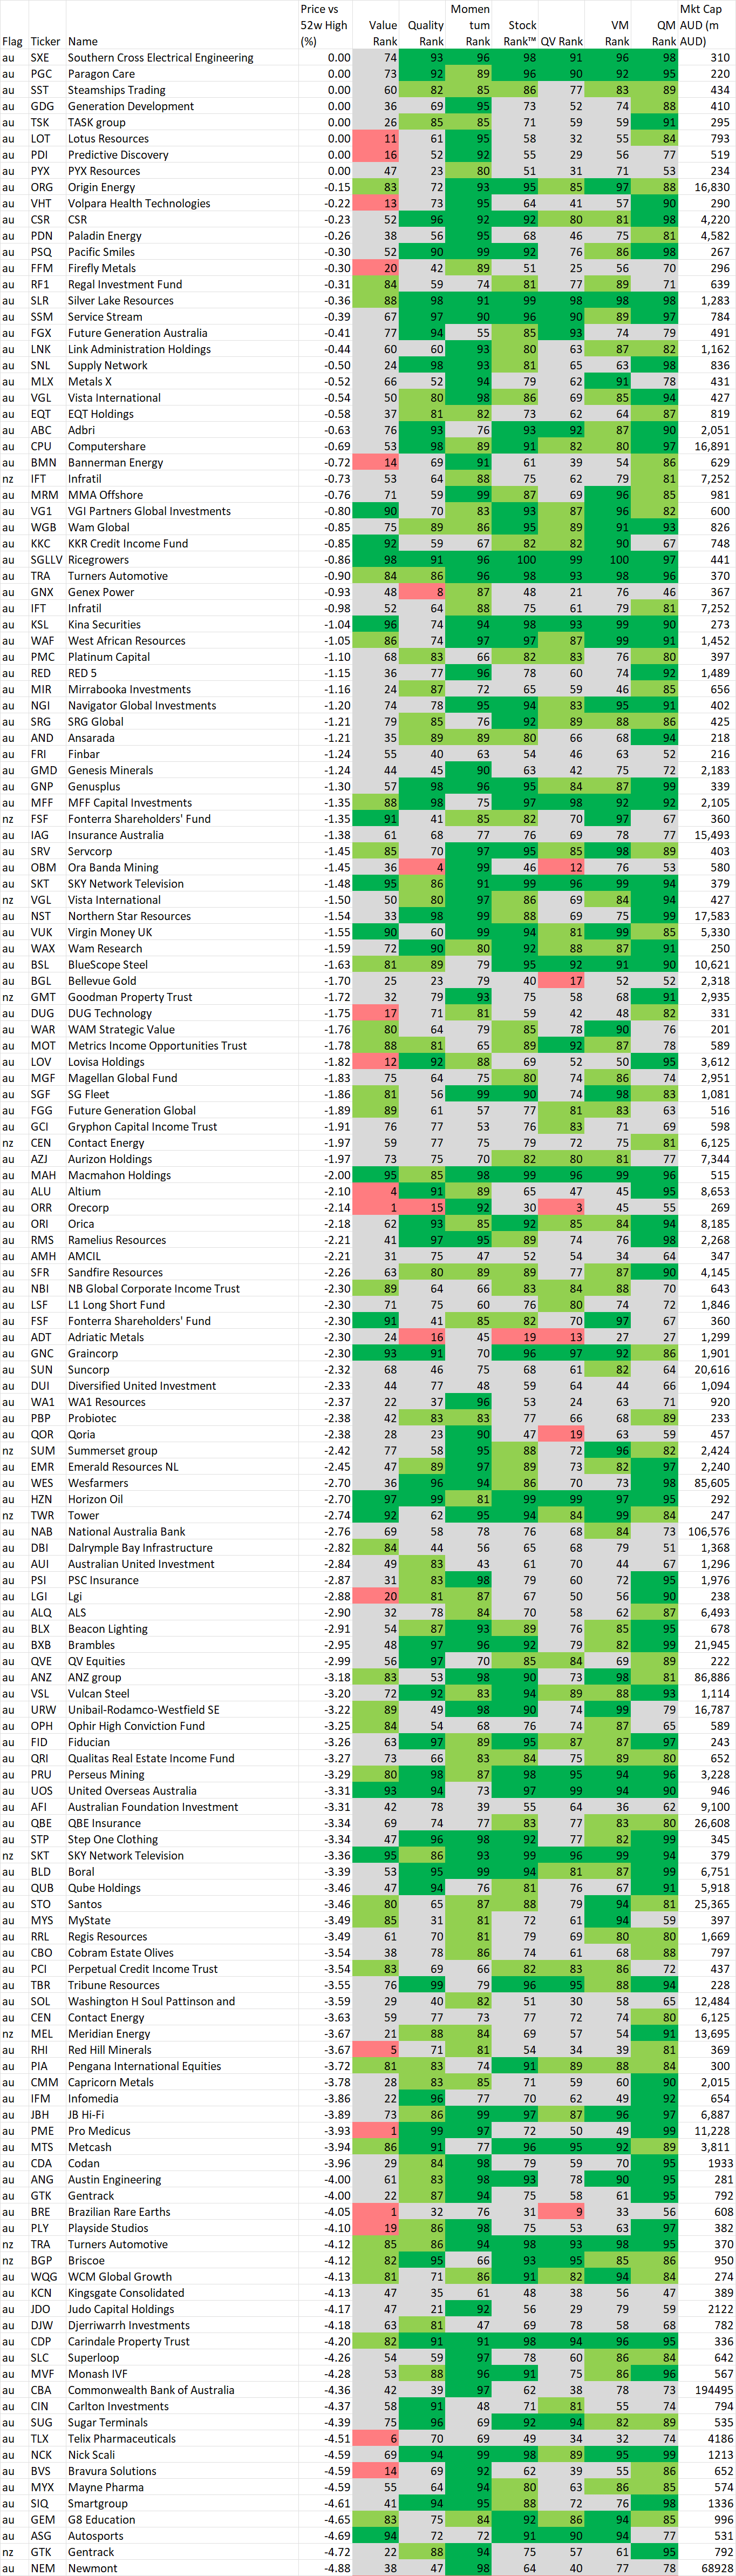
In this section we identify stocks within 5% of their 52 week intraday high based on the idea, supported by academic studies, that stocks close to their 52 week highs tend to outperform. Weekly changes to the list will also be noted.
If you wish to recreate this screen in the screener select "Price vs 52 high" greater than -5% and Mkt Cap greater than $200M
A stock coming onto the list is NOT an automatic buy, just as a stock that leaves the list is NOT an automatic sell. As with the shine list, assess every chart on its merits. However movements on this list may alert you to interesting charts so be sure to look at Stockopedia and the chart first.
Data is at 13 April and is sorted by the stocks closest to their 52 week intraday high.
Also look at the market capitalisation and liquidity before making any decisions!
And remember, past performance is no guarantee of future performance.
Changes from last week

Stocks within 5% of their 52 week high as at 13 April
Important Information: Stockopedia Ltd ABN 39 757 874 670 UK business registration number 0637267 (“Stockopedia”) is an Authorised Representative of Daylight Financial Group Pty Ltd ABN 77 633 984 773 (“DFGPL”) which is the holder of an Australian Financial Services Licence (AFS Licence No. 521404).
Information in this commentary is current as at date prepared unless otherwise stated. However, please bear in mind that investments can go up or down in value, and that past performance is not a reliable indicator of future performance. For more Important Information please refer to the Disclaimer section of this website.
This communication may contain general financial product advice. It has been prepared without taking into account your personal circumstances, and you should therefore consider its appropriateness in light of your objectives, financial circumstances and needs before acting on it.
If our advice relates to the acquisition or possible acquisition of a particular financial product, you should obtain a copy of and consider the Product Disclosure Statement (PDS) before making any decision.
The author holds interests in DUG and companies listed in the data tables . This position can and will change at any time without notice.
Disclaimer
This is not financial advice. Our content is intended to be used and must be used for information and education purposes only. Please read our disclaimer and terms and conditions to understand our obligations.
1 comment
I pitched South32 (ASX:S32) over the side in early February thus establishing (as usual) a solid buy signal for the market! As you note there is such a smorgasbord of commodity drivers that it is difficult to judge which (if any) will carry them up or drag them down. despite missing out on recent recovery I am. like you, fairly sure that I can afford to wait.
I intended to move the funds into Supply Network (ASX:SNL) and the mistake was that I did not do it immediately. SNL seems to continue to defy any concerns on the economy, China, supply chain interruptions or anything else. How far can this go? In similar markets Mader (ASX:MAD) has made this look a lot more difficult over the past six months.