Momentum Monday 15th May

Welcome to Momentum Monday. I want to start by saying thank you thus far for the feedback and stock suggestions. It has become increasingly clear that users like to see some of the chart analysis for individual stocks so we have made some slight tweaks to the revamped version.
Our intention was to always make the report shorter and to increase engagement. Therefore to that end:
We will remove the “Macro sentiment” component. I will still analyse the indices, however without the general commentary. There are plenty of other sources to obtain your macro fix and/or my attempts at poor humour.
- We will accept up to 10 stocks from members to analyse from a Momentum perspective per week (previously 2). If we receive more than 10 stock requests in a week, we will carry them over into future weeks.
However as previously highlighted this will be in direct response to member questions, we will not be making up codes to include. If we receive no requests then this section is omitted for the week.
Analysis will be conducted from a Momentum perspective primarily.
The Shine Zone will remain, as will the 5% from 52 week high lists.
Enjoy this week’s report. Here is the index:
Broader market sentiment
Member requests
Stocks in the “Shine Zone”
52 week high screen (including changes)
Broader Market Sentiment
We look at the direction of both the US and ASX markets to gain an understanding of the broader sentiment at the minute. While this analysis is not to time specific entry into or exit out of stocks, they are useful in helping us determine how aggressive/cautious traders should be in their trading.
US S&P500
It was the second down week in a row, however really, the index hasn't moved for the past 6 weeks. Like a coil spring, the longer we tighten, the more explosive the potential next move will be.

S&P500 Weekly Chart
For those interested at analysing bar charts, unlike the prior two weeks where the market fell at the start of the week but finished stronger, last week was a tight range further highlighting the indecision between bull and bears at the minute.

S&P500 Year to date. Weekly chart
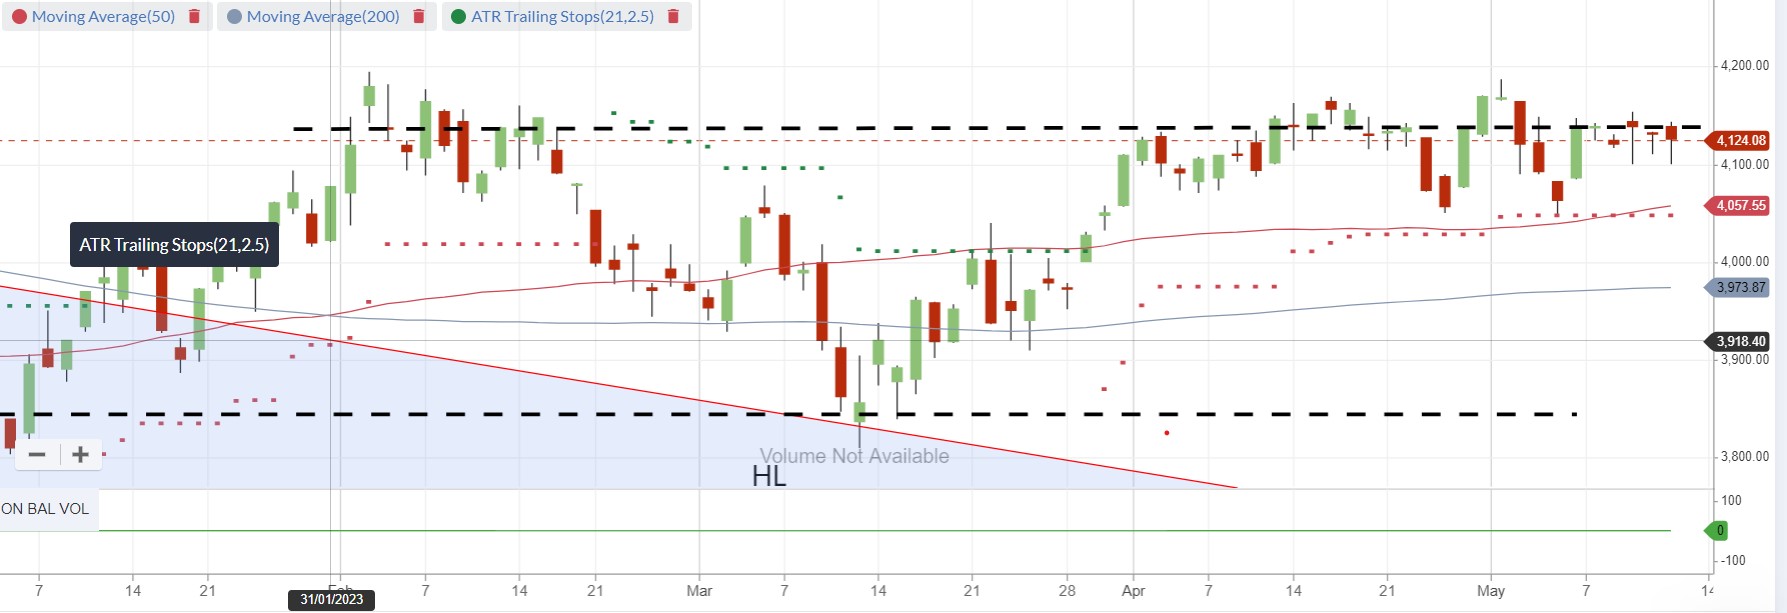
While we often steer clear of predictions as they are a false hope and we have not insight into why Billions of Dollars is specifically traded on a daily basis, looking at the Daily chart of the S&P500 offers some hope.
S&P500 Year to date. Daily chart
We notice
the 50 day moving (MA) average is above the 200 day MA ,
and for the minute they are moving in the right direction.
The index is above both MA’s and the 2.5x ATR
The index has taken a peek above the top end of weekly short-term resistance line a number of times. It appears it wants to go for a run given it has spent more time near the top-range than the bottom range. But again this could see an aggressive move down if the index breaks this tight range it is in on the downside.
Both the RSI and MACD have remained in a slightly bullish stance since the market commenced its sideways move 6 weeks ago, though the MACD has started to taper off a little as the two moving averages converge following the prolonged move sideways .
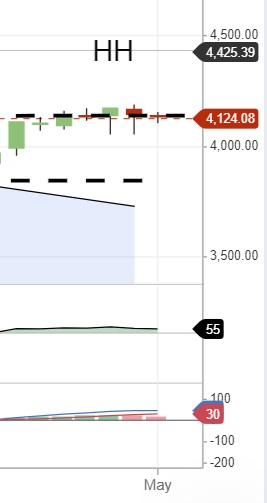
Overall we are still investing in global equities, but we are aware of the potential for an aggressive move (either positive or negative) soon.
AUS S&P/ASX200
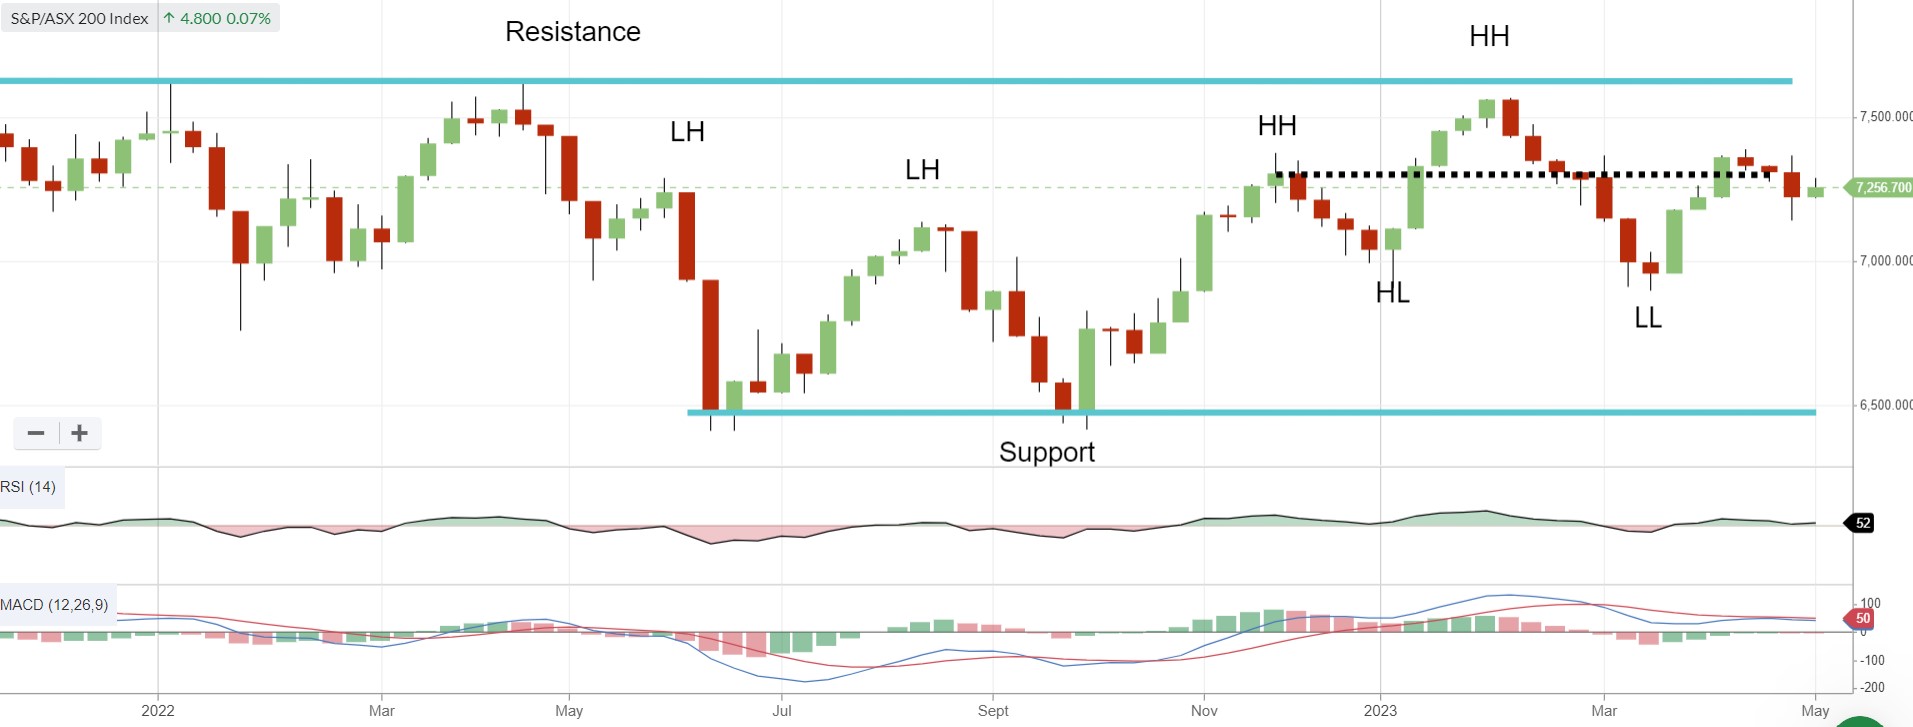
Perhaps it won’t come as a surprise for an index which has tracked sideways for the last two years, that last week’s 0.5% rise didn’t change the dial too much with regard to direction.
S&P/ASX200 Weekly chart 2 years
There are a few things of interest. Besides the previously discussed potential for a head and shoulders reversal pattern forming, the index action of last week was very interesting.
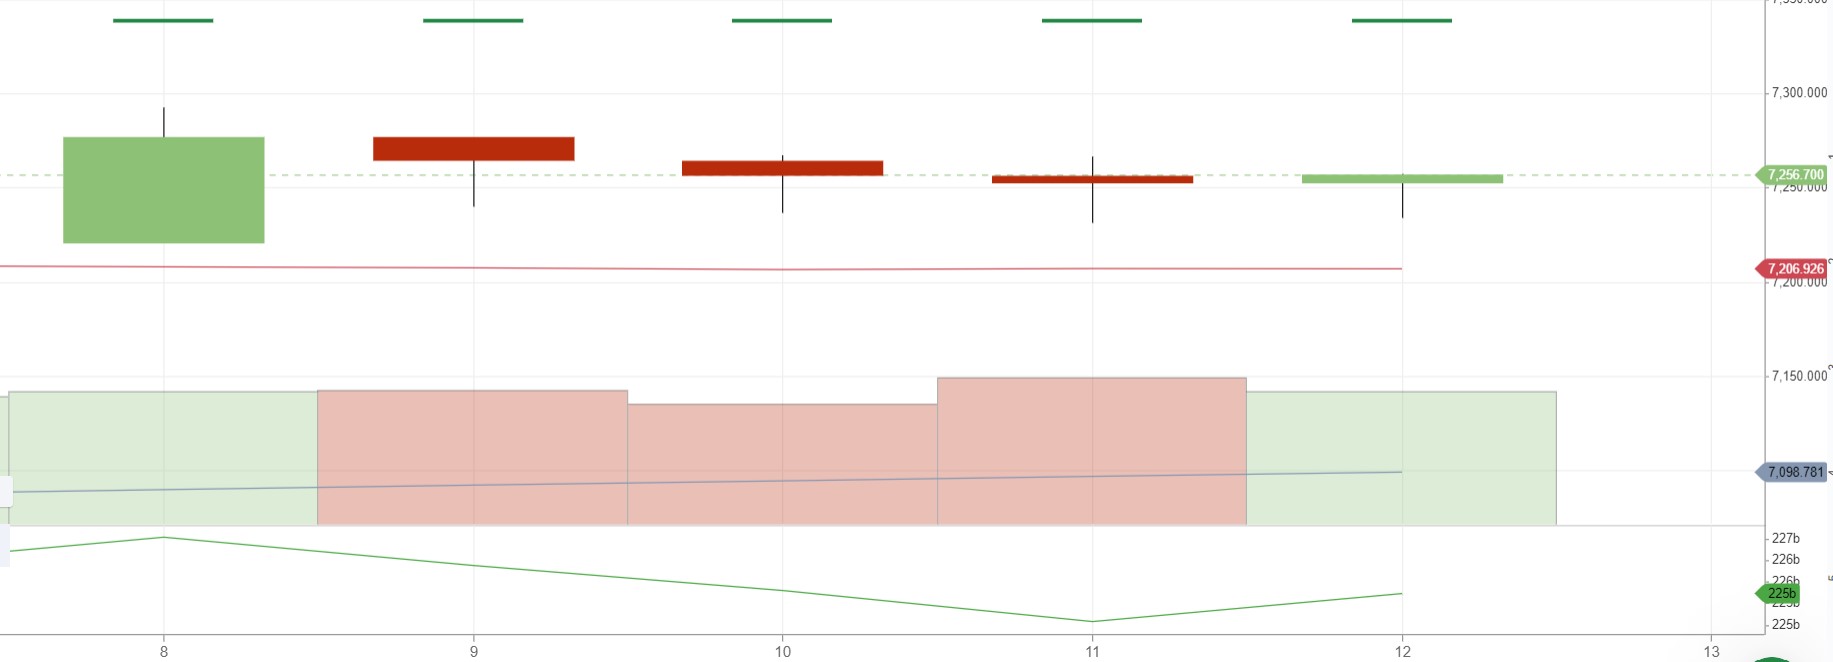
The week’s entire gains were captured on Monday, with the remainder of the week remaining flat.
The half glass empty argument is the market lacks the conviction to follow through with any move as it grinds its way to positive territory. Such slow moves don’t take long to unwind when the rug is pulled.
The other thing is that the index fell below the 2.5x ATR last week further adding to the argument of lack of conviction.
The half glass full argument is that with a budget, and bank stocks going ex-div, the index held up well this week.
Also adding to the positive case is that each of the last four days of the week saw selling at the start of the day with support coming back in the later part as evidenced by the long bottom wick of each of the bars
Much like the US, and as evidenced by the tight MACD and RSI, our market remains on a knife's edge waiting for some macro sentiment driven news to push the index one way or the other.
Member corner
In this new section we will provide a detailed chart assessment, on a maximum of two stocks weekly, on companies from those of you in the Gallery. If no one asks for a stock to be analysed, this section will remain blank. Also please note, that while we may receive a number more queries than ten per week, we retain the right to save a stock for another week, or ignore it all together.
The analysis will be akin to what was covered under the “Stocks of Interest” within the previous Momentum Monday reports and is highlighted in the Shine Zone area below.
If you have a stock you would like analysed from a momentum perspective, please write it into the comments section below or email us at @stockopedia.com.au">support@stockopedia.com.au.
ASX:BSL BlueScope Steel.
- StockRank 99
- Momentum Rank 98
- QM Rank 99
- VM Rank 99
- A$18.96
We last discussed BlueScope Steel (ASX:BSL) in the April 24 edition of Momentum Monday. Since then the price has fallen circa 10% since the time of writing.
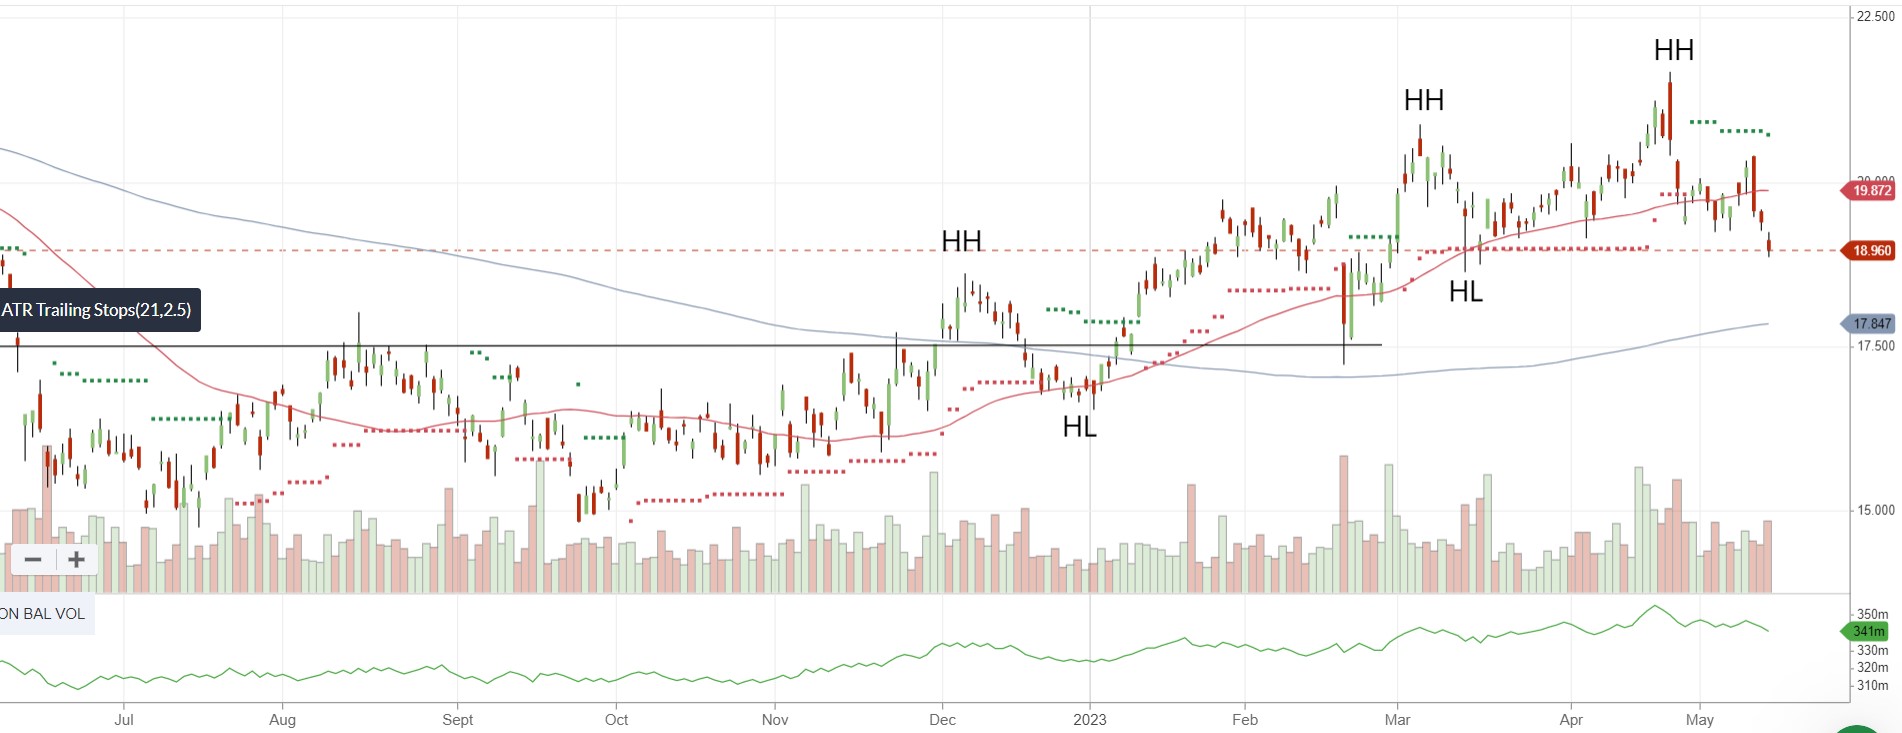
ASX:BSL 1 year Daily chart
Concerns arising from comments from the banks on the slowdown in the pace of housing builds contributed to the negative sentiment last week.
At the time of last coverage we said, “Stop-loss would be at $19.20 for traders, $16.75 for true believers” and that still remains the case.
From a traders perspective you would want to see the price consolidate and stop falling before considering a re-entry. Especially since the close on Friday created a new short-term lower low (relative to the previous higher low created on 16 March 2023). The only way we see some relief is if price bounces (they zig and zag remember) and it breaks above $20.22. Otherwise the stock has created a new short term downtrend and should be avoided.
For more of the true believer / swing trader the stock is still above $16.75 which is the area of support formed by the higher low at the end of December 2022. It is also particularly powerful as a support level / stop loss because it would mean that everyone who has purchased the stock in 2023 would be in the red, and given broader macaron uncertainty may see many cash in their chips.
ASX:TLC Lottery Corporation
- StockRank 72
- Momentum Rank 98
- QM Rank 90
- VM Rank 70
- A$4.92
We last discussed Lottery (ASX:TLC) in the 11 April edition of Momentum Monday. At the time we said that there appeared to be a solid entry open to the stock given the stepped up higher highs and higher lows that it had been achieving.
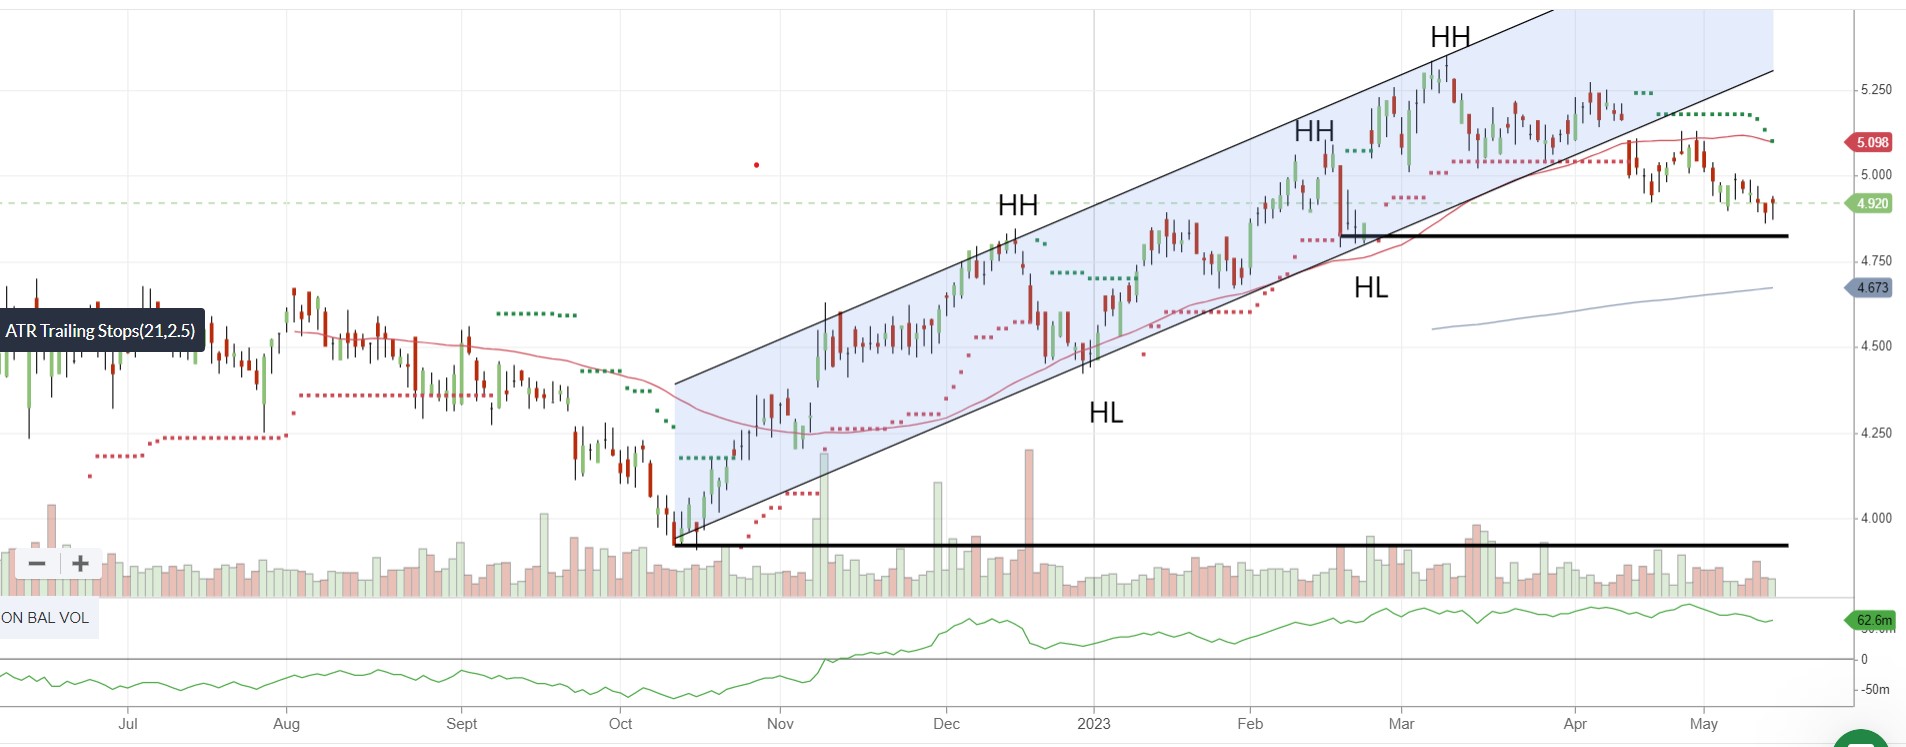
ASX:TLC 1 year Daily chart
As Murphy’s law would have it, the price has since retraced, fell below the ATR2.5x and has even fallen below the 50 day average line. Either way as Momentum investors who use charts to time their entry and exit, we should always have our parachute stop in place to protect our capital. This was a concept I discussed in the final installment of my momentum journey which you can read here
So where might that level apply? Of course, it depends on when you bought the stock. However if I was looking for a structural level where a new lower low would be created it would be a breach of $4,82. It is clear from the chart that price has faded out of the strong upward channel formed from October 22 to April 23 and is languishing at the minute. A break below $4.82 sees $4.46 come into play with an ultimate target of $3.92 should that level not hold.
The positive note for those that don’t yet hold is that if $4.82 can hold, the prolonged six week pullback may be enough to shake the weak hands out and provide a springboard for a future move up. So if you like the business, and you think the old adage that “booze and gambling” do well in tough economic times, then buying near $4.82 might be an option as, “you won’t have to wait long to know if you are wrong.”
ASX:AX1 Accent Group
- StockRank 98
- Momentum Rank 98
- QM Rank 99
- VM Rank 97
- A$2.51
I like stocks at 52 week highs (after all it’s why I dedicated an entire report to them) and AX1 has been hanging around that level for some time. We last discussed Accent (ASX:AX1) in March. At the time we said, “For those considering a position in the stock now a pullback to around the $2.20 level would be appropriate. That is right on the ATR level and the old adage, “we won’t have to wait long to know if we are wrong” rings true as a stop loss of around $2.03 - $2.04 would be advised (for new and existing investors) as that level coincides with the previous structural higher low.”
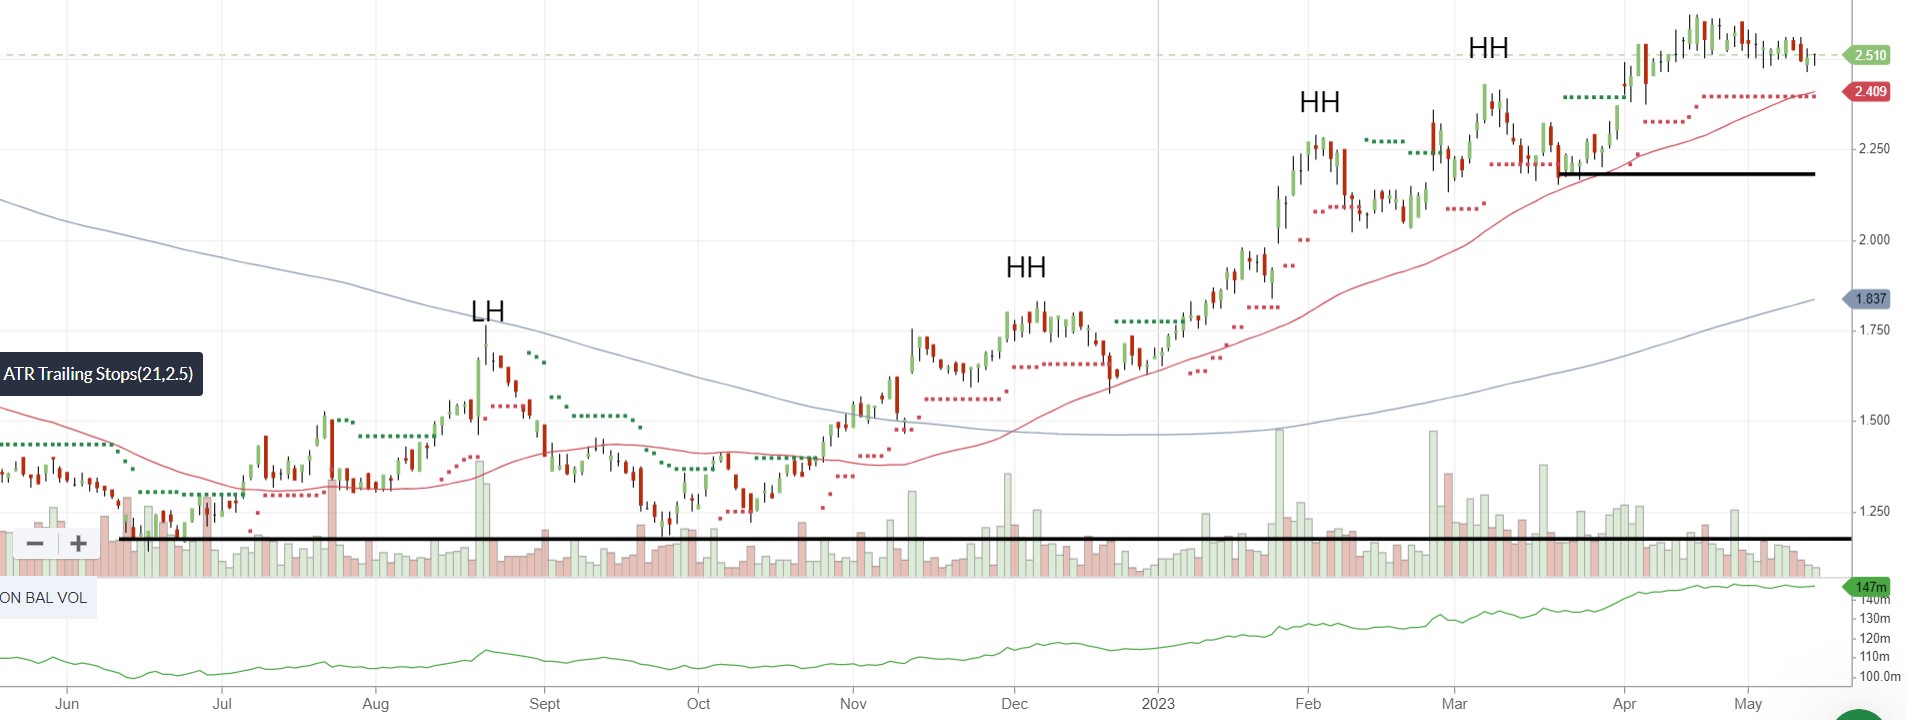
ASX:AX1 1 year Daily chart
The price actually hit $2.17 on 21 March and then bounced.
Not much more to add other than to say it is in the “Shine Zone”, has the on-balance volume (OBV) rising, and re-affirms another long held belief, “think less, make more money.” And if you can’t enter the housing market because you can’t get a home loan anyway, might as well spend it on another pair of Adidas Gazelles. Because for the life of me, someone who sells shoes and overpriced t-shits you would think is going to suffer in an environment where there are cost of living pressures right? - Think less….
It may very well happen so those considering the stock now, have in place a parachute stop loss level. For those looking for a structural point that March test of $2.17 would be it. Given the current environment, it will be mine.
But for those not yet in the business, a pullback to around $2.30 may be the chance to set up as, “you won’t have to wait long to know if you are wrong.”
The next upside target is $2.94 as that coincides with the peak COVID spending point in April 2021.
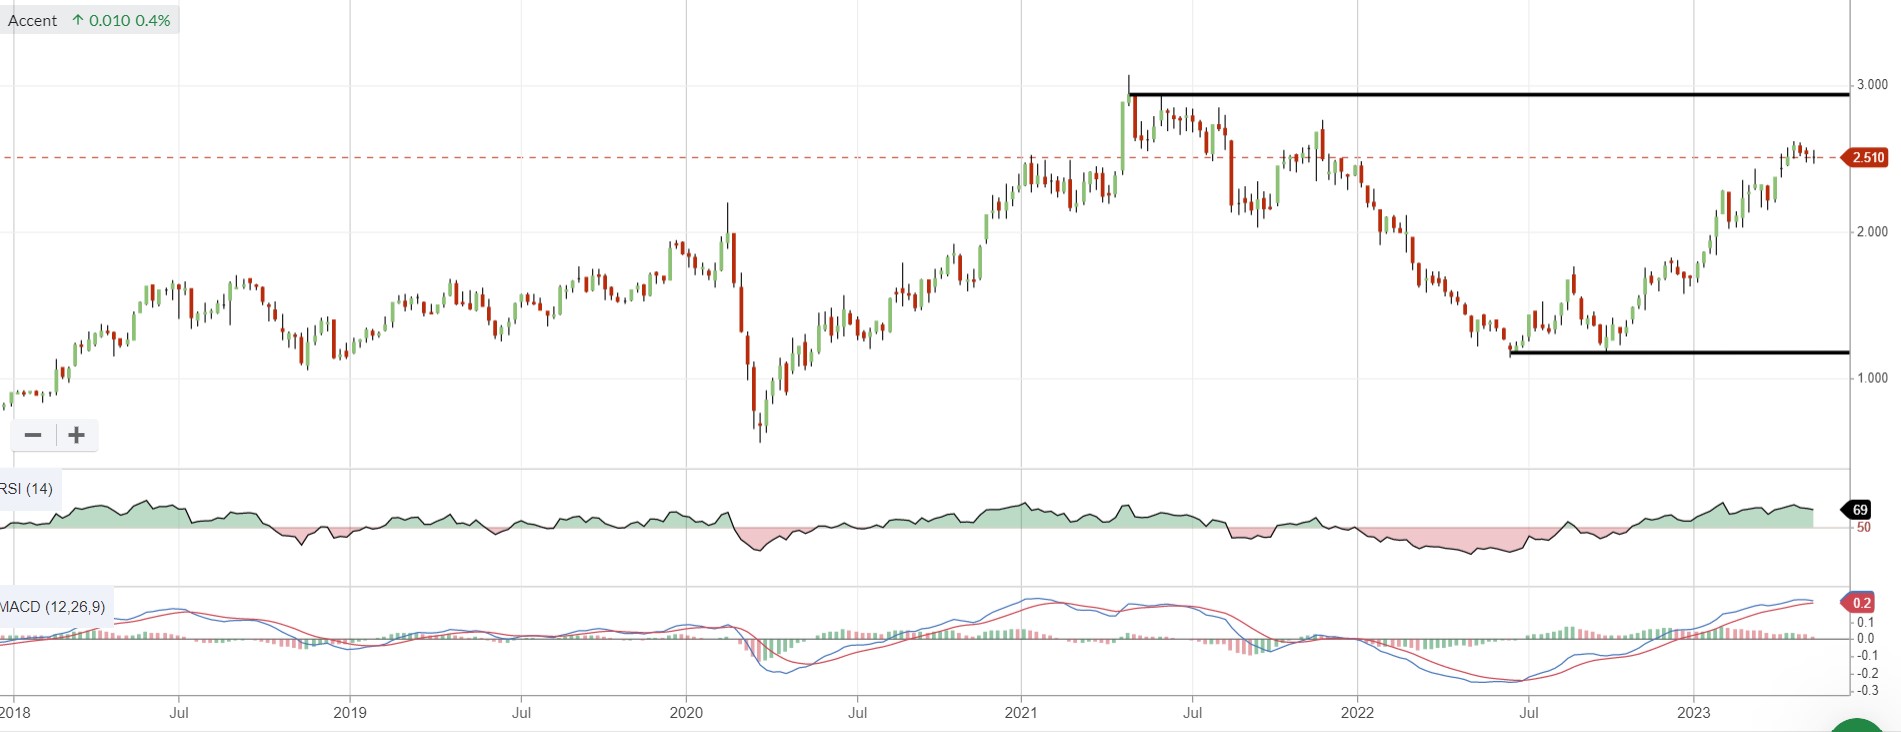
ASX:AX1 5 year Weekly chart
Should the price get there, that will be an opportune to take some profits and to see what happens next with the price.
ASX:NCK Nick Scali
- StockRank 97
- Momentum Rank 91
- QM Rank 94
- VM Rank 97
- A$9.77
I discussed how cost of living pressures impacts have been ignored to date for AX1, this is not the case for Nick Scali (ASX:NCK), especially when you add to the fact that new housing starts are slowing. Further compounding this issue being that now one is pre-buying homes because they are worried builders will go broke, it is a tough situation for the sector.
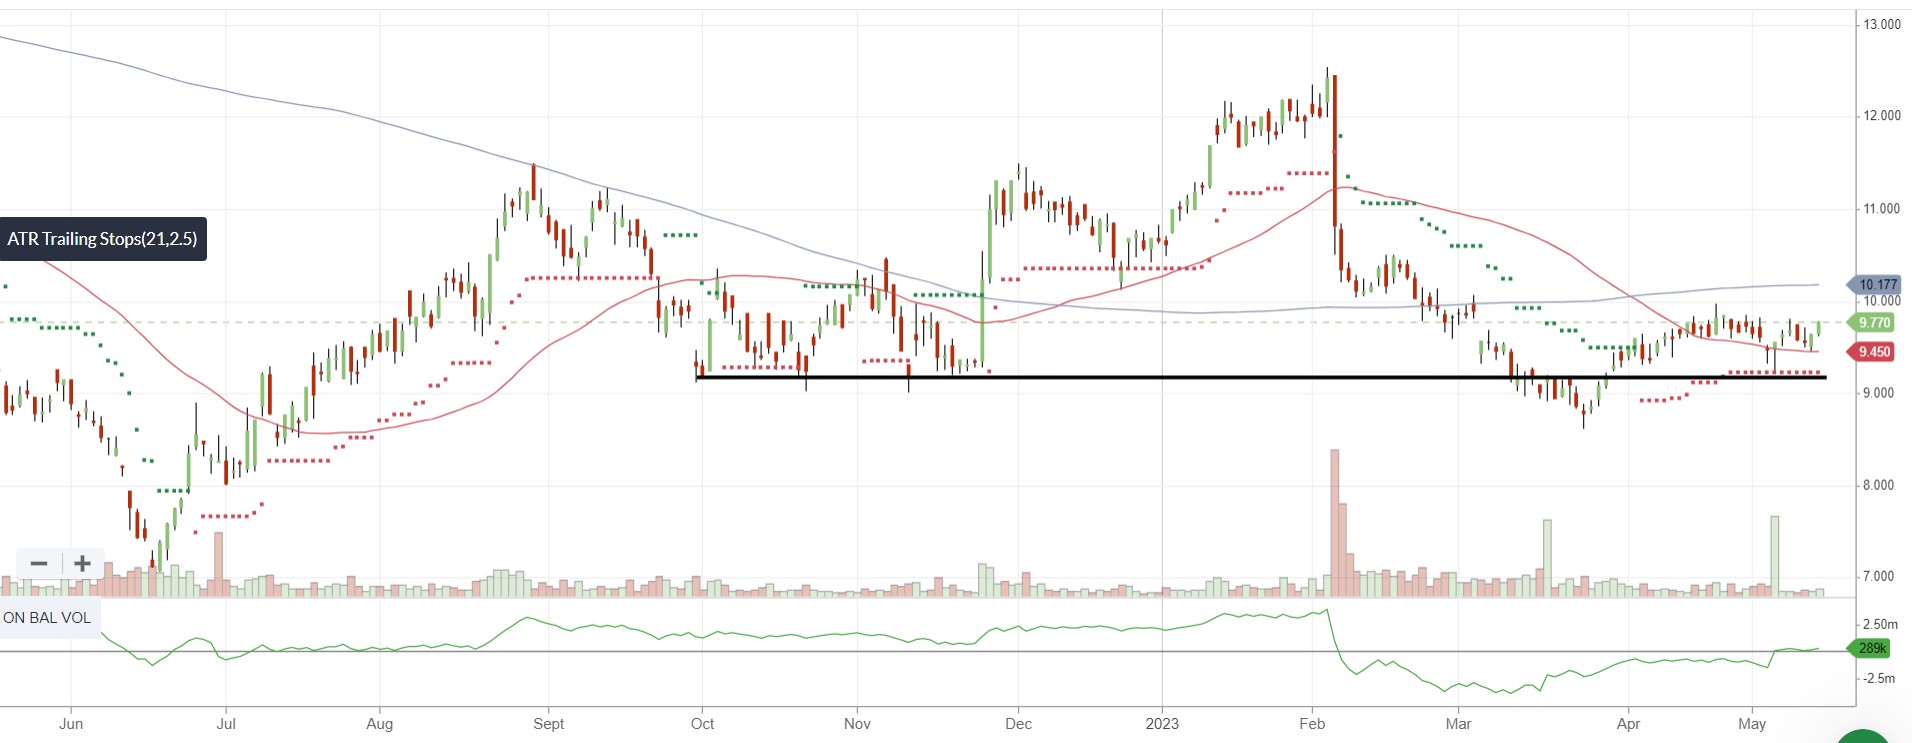
ASX:NCK 1 year daily chart
I last discussed NCK of February 13th which was after the big fall. I discussed a number of different possible scenarios for considering the stock and what to do if one held it.
The buy situation didn’t happen, the short-term sell scenario did happen, as did the scenario for longer term holders.
The chart looks a little sick, and without much catalyst for a reversal investors should remain on alert. If holders didn’t enact their stops, the bounce through April provided a reprieve but the bounce is losing momentum and $9.20 would be last chance saloon.
Is there hope? There is always hope. The price is now above the 2.5x ATR and it is close to the very short term peak from the bounce on 21st April which would signal there are signs of life. But there is a lot of work to do for NCK
ASX:CHC Charter Hall
- StockRank 96
- Momentum Rank 93
- QM Rank 96
- VM Rank 91
- A$11..28
There is little doubt that Charter Hall (ASX:CHC) is a quality business. As one of the premier REITs on our exchange it commanded a nice premium. But in light of a number of consecutive interest rate rises, it is unsurprising to see that premium diminish as it has with many other REITs that carried such premiums.
I last covered CHC on 27th March and highlighted that trades were on alert following the break below $11.86. I also mentioned the $10.61 level that the company has been hanging onto for dear life having tested that level 3 times now.
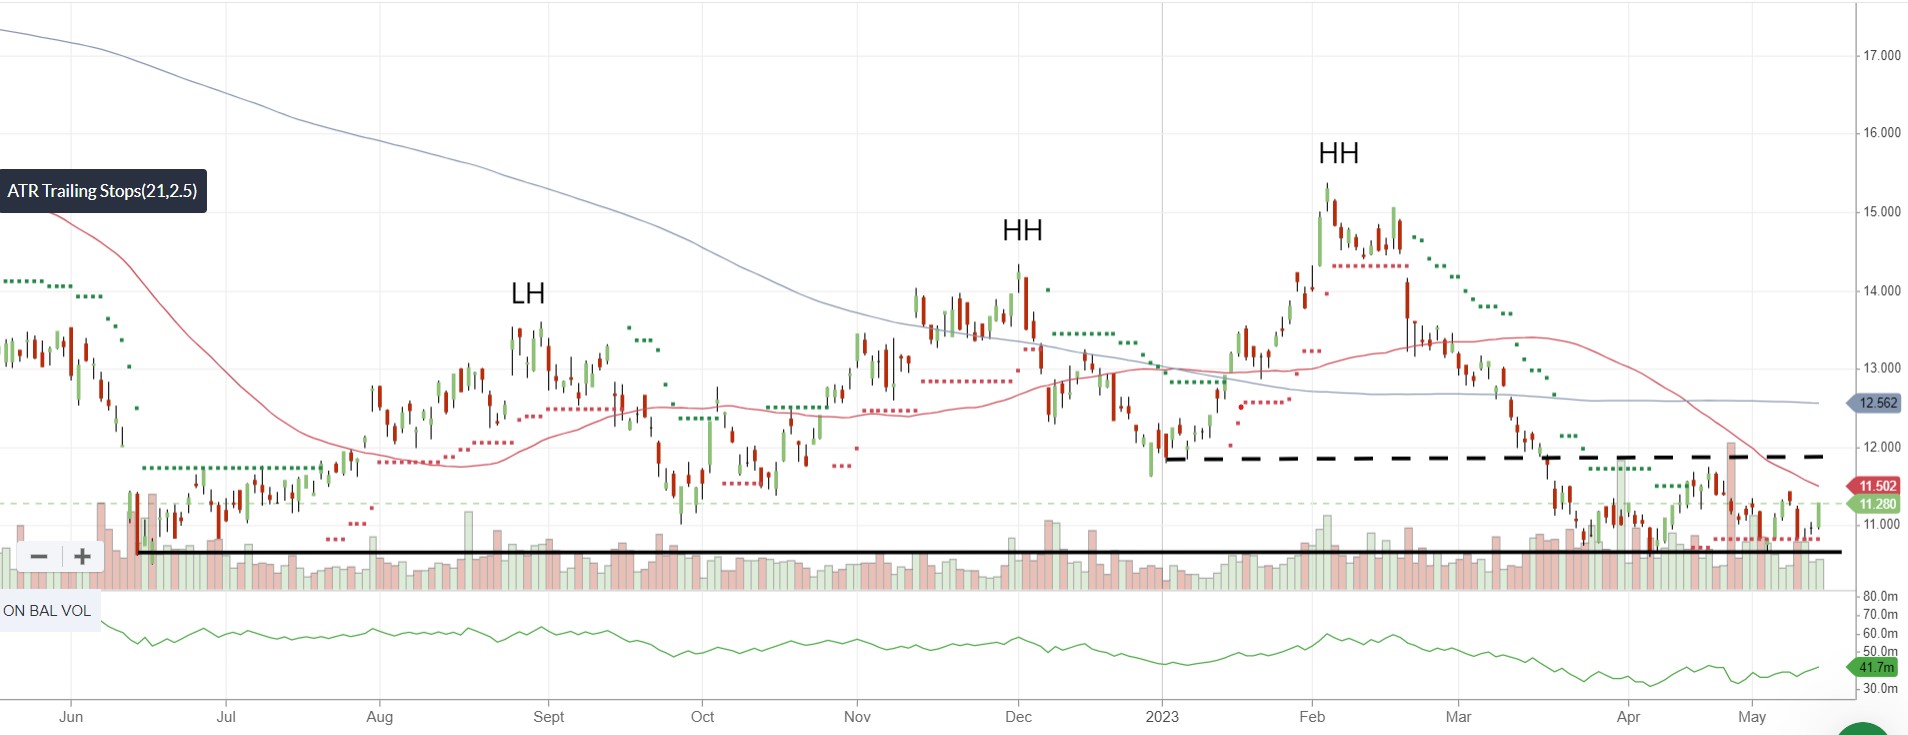
ASX:CHC 1 year Daily chart
It needs to hold this level as there are some much bigger downside targets ahead if breached. Therefore it is difficult to suggest a buy case for CHC at the minute, other than if you can look through the cycle, the quality of the assets they hold is good, they are shrewd operators and eventually wheels turn.
Concerns over what happens to office properties in this new post COVID world may concern some, but the team are no doubt aware of this and are preparing for all eventualities. (PS In case you are interested…. I think they could turn them into residential towers and help solve our housing problem - no one asks so I will move on.)
Taking a position would mean you are willing to back that management can solve this conundrum, because the reality is the price has a lot of work to do to get back to $22 highs it last saw in late 2021 before the series of rate rises began.
If there is a silver lining for investors (who don’t use Momentum) considering such a stock after such a big fall, is that the forecast yield is now 4% which it hasn’t been this high for quite some time. Further as a fundamental investor, if I saw stocks 50% from their high it was often a trigger to do more digging to the business as the correction may create an opportunity.
________
Stocks in the Shine Zone
Last week we introduced the Shine Zone. I followed up with an article of how you can use it. You can read it here.
The rules for inclusion in this list are based on those I like to see in a stock before considering a trade in it:
QM Rank above 80
Price is above the 2.5x ATR
50d MA is above the 200d MA
Price is greater than the 200d MA
I covered off in a bit more detail how the list is compiled in the May 1 edition of Momentum Monday so be sure to read it.
Note: The list now separates AU and NZ listings.
But I will reiterate that the “Shine Zone” are rules for possible buying. They are not for holding and/or selling. Read the “how to” article above to learn more
Data is at 12 May and is sorted by the stock code.
Changes from last week
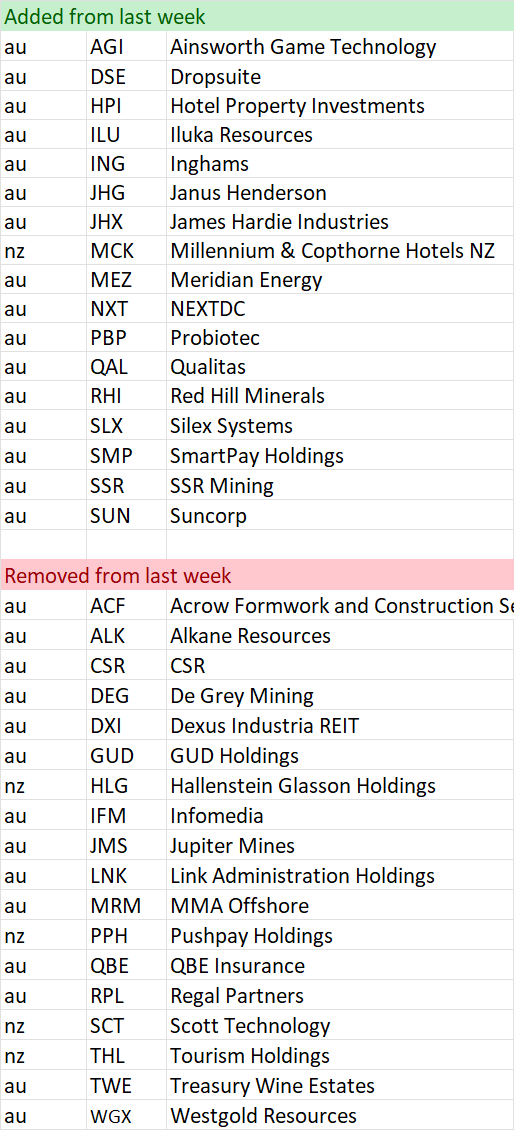
Shine Zone List as at 12 May

52 week high screen
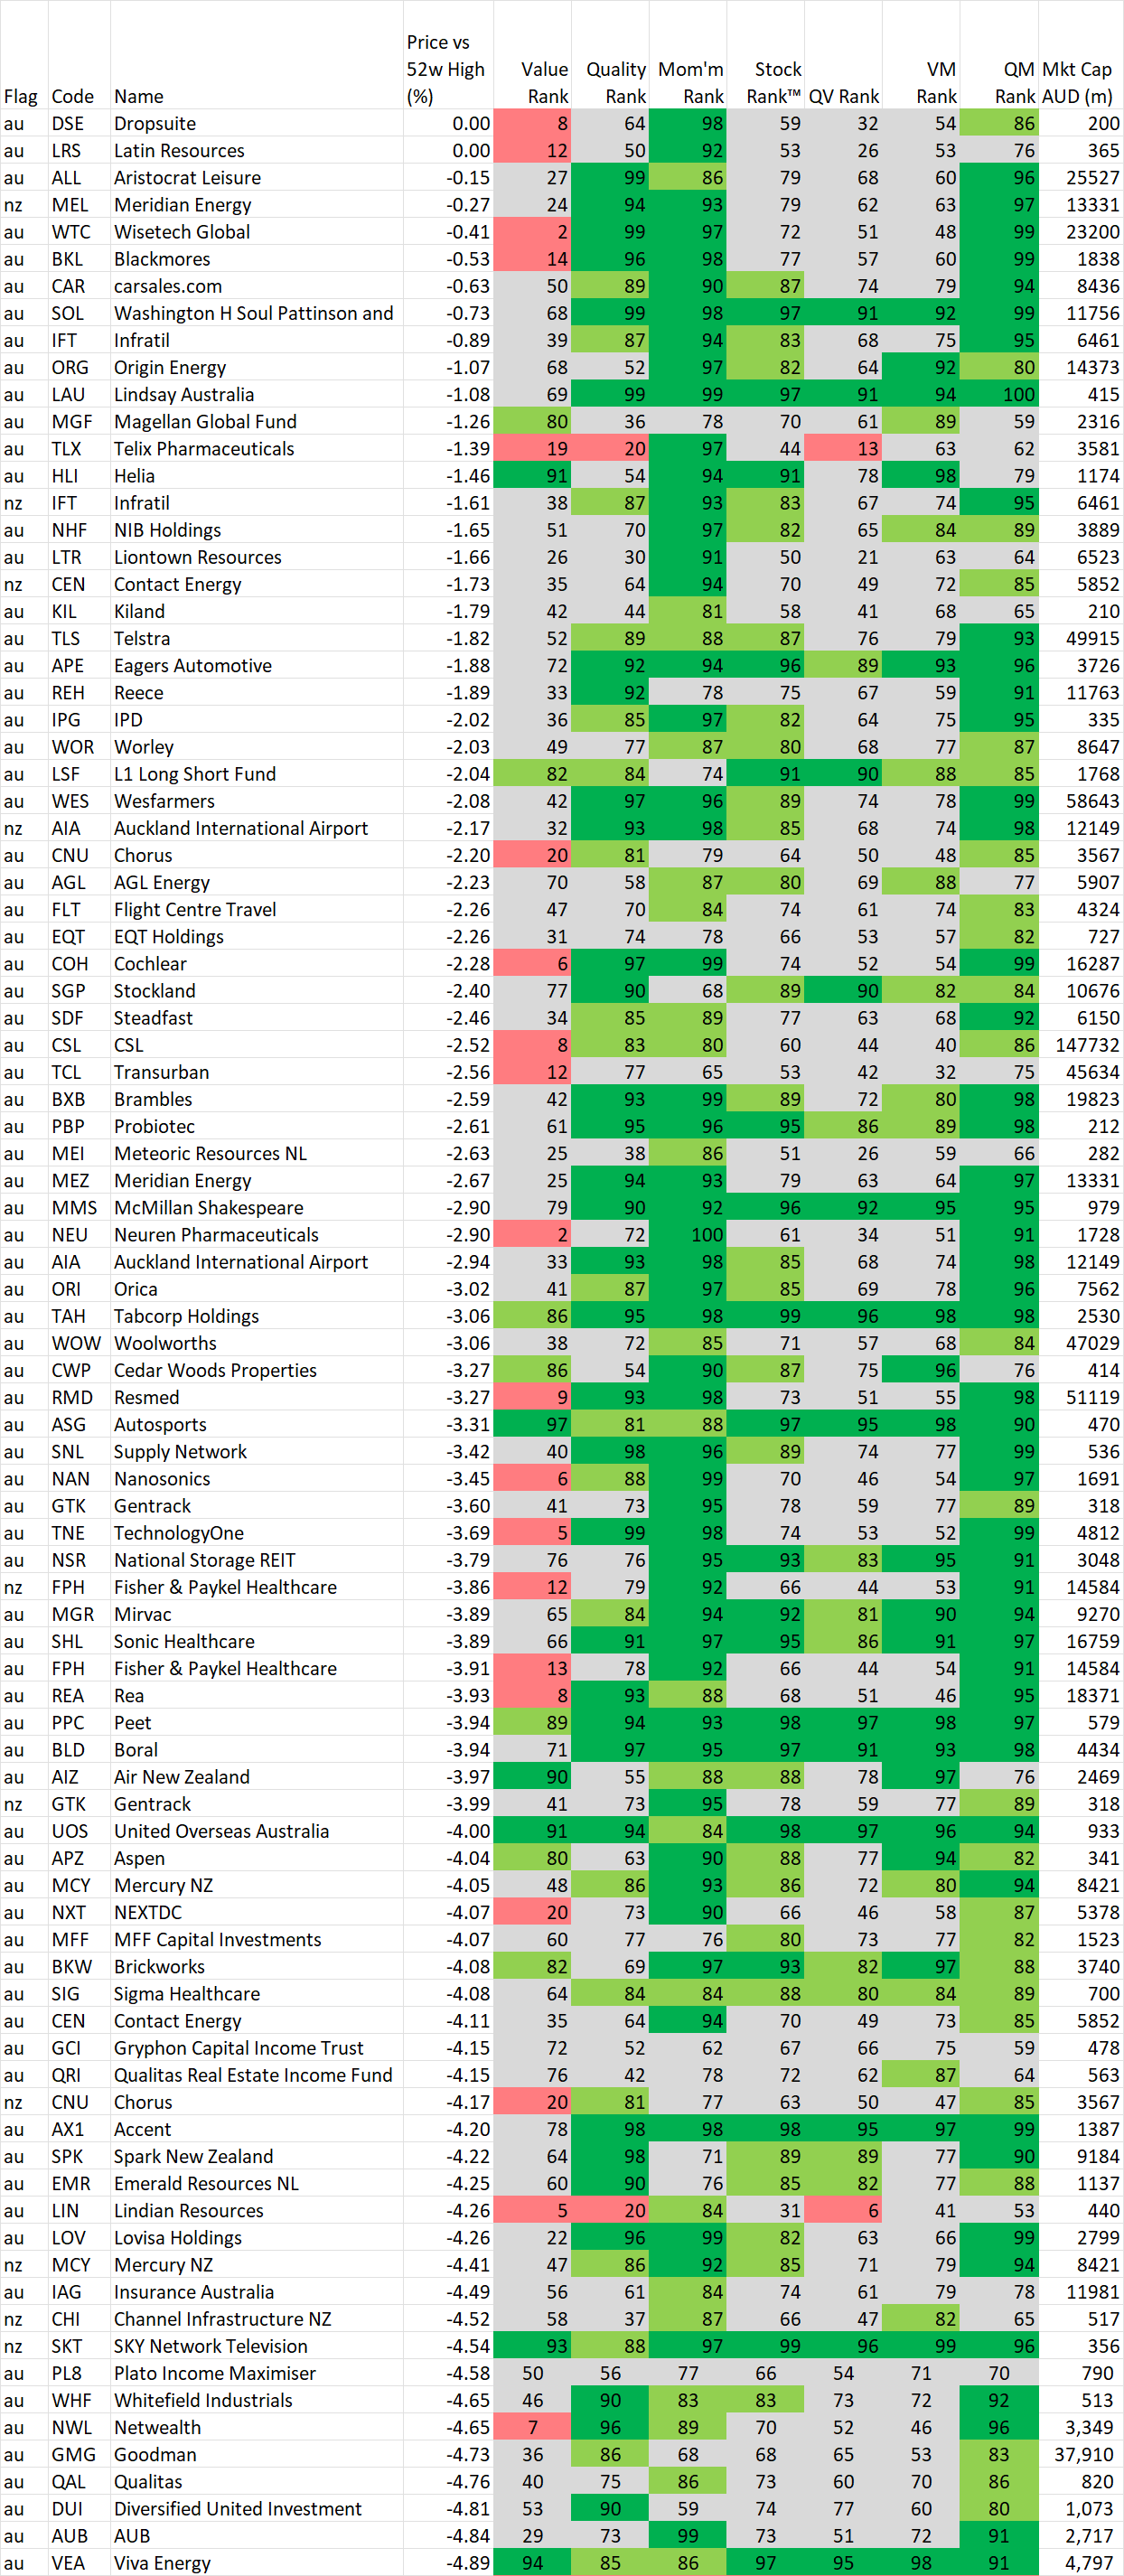
In this section we identify stocks within 5% of their 52 week high based on the idea, supported by academic studies, that stocks close to their 52 week highs tend to outperform. Weekly changes to the list will also be noted.
If you wish to recreate this screen in the screener select "Price vs 52 high" greater than -5% and Mkt Cap greater than $200M
As announced last week, we will now record changes to the list week to week. A stock coming onto the list is NOT an automatic buy, just as a stock that leaves the list is NOT an automatic sell. However movements on this list may alert you to interesting charts so be sure to look at the Stockopedia and the chart first.
Note: The list now separates AU and NZ listings.
Data is at 12 May and is sorted by the stocks closest to their 52 week high.
And remember, past performance is no guarantee of future performance.
Changes from last week
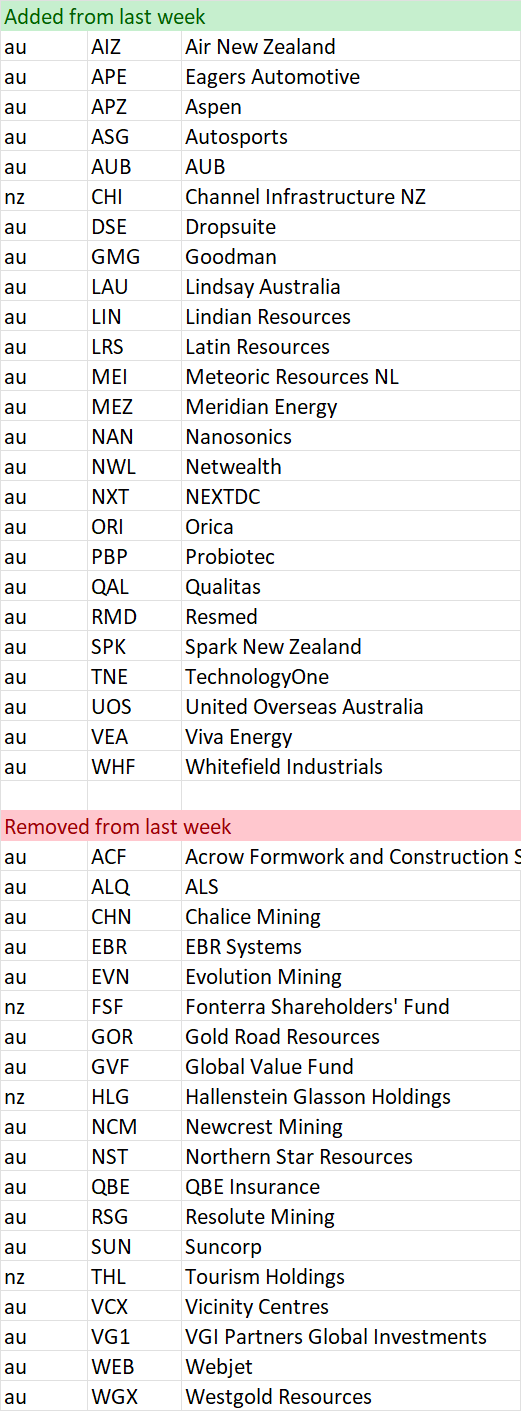
Stocks within 5% of their 52 week high as at May 12
Important Information: Stockopedia Ltd ABN 39 757 874 670 UK business registration number 0637267 (“Stockopedia”) is an Authorised Representative of Daylight Financial Group Pty Ltd ABN 77 633 984 773 (“DFGPL”) which is the holder of an Australian Financial Services Licence (AFS Licence No. 521404).
Information in this commentary is current as at date prepared unless otherwise stated. However, please bear in mind that investments can go up or down in value, and that past performance is not a reliable indicator of future performance. For more Important Information please refer to the Disclaimer section of this website.
This communication may contain general financial product advice. It has been prepared without taking into account your personal circumstances, and you should therefore consider its appropriateness in light of your objectives, financial circumstances and needs before acting on it.
If our advice relates to the acquisition or possible acquisition of a particular financial product, you should obtain a copy of and consider the Product Disclosure Statement (PDS) before making any decision.
The author holds interests in stocks highlighted specifically in the article: AX1, BSL, TLC and other companies listed in the data tables . This position can and will change at any time without notice.
Disclaimer
This is not financial advice. Our content is intended to be used and must be used for information and education purposes only. Please read our disclaimer and terms and conditions to understand our obligations.
3 comments
Thanks Elio. Excellent commentary. I think the changes you’ve made are a good compromise from the feedback I could see in previous weeks (including my own). P.S. I didn’t have an opportunity to read Monday momentum until Sunday morning so sorry for untimely feedback. I’m interested in your opinion about RF1 Regal Investment Fund, particularly why it has a quality rating of just 4 !?
Thanks for the feedback and contribution NicholasB. Unfortunately RF1 missed this weeks cut as I write this piece over the weekend. I will be sure to include it next week.
Hi Elio
I would be interest in your assessment of ALL.
Cheers Bernie