Momentum Monday 17 July

Welcome to Momentum Monday once again and last week’s ASX moves see us up this financial year to date (Despite the fact we are just two weeks in.) More on that in a moment.
Last Friday we held our second Friday Lunch ‘n Learn session and you can watch a recording of the session here.
Also as a brief reminder to newer members, should you wish to re-acquaint yourself with the methods I use within this article, I have captured them here in a series of articles that I wrote.
They will help provide context on what I am writing about and the editorial angle of this report.
The content for this week's edition is:
Broader market sentiment
Member corner
Stocks in the “Shine Zone” (including changes)
52 week high screen (including changes)
A reminder that you don’t have to read all this contribution. Simply scroll to the area of interest.
Broader Market Sentiment
We look at the direction of both the US and ASX markets to gain an understanding of the broader sentiment at the minute. It is important to stress here that I DO NOT use this to time my entry or exit out of stocks. I prefer to use the individual charts of stocks to do that. However I find it useful in helping us determine how aggressive/cautious traders should be in their trading. In short the more positive the broader market is the more risks you can take and vice versa.
US / S&P500
US Markets powered ahead after a brief respite last week.
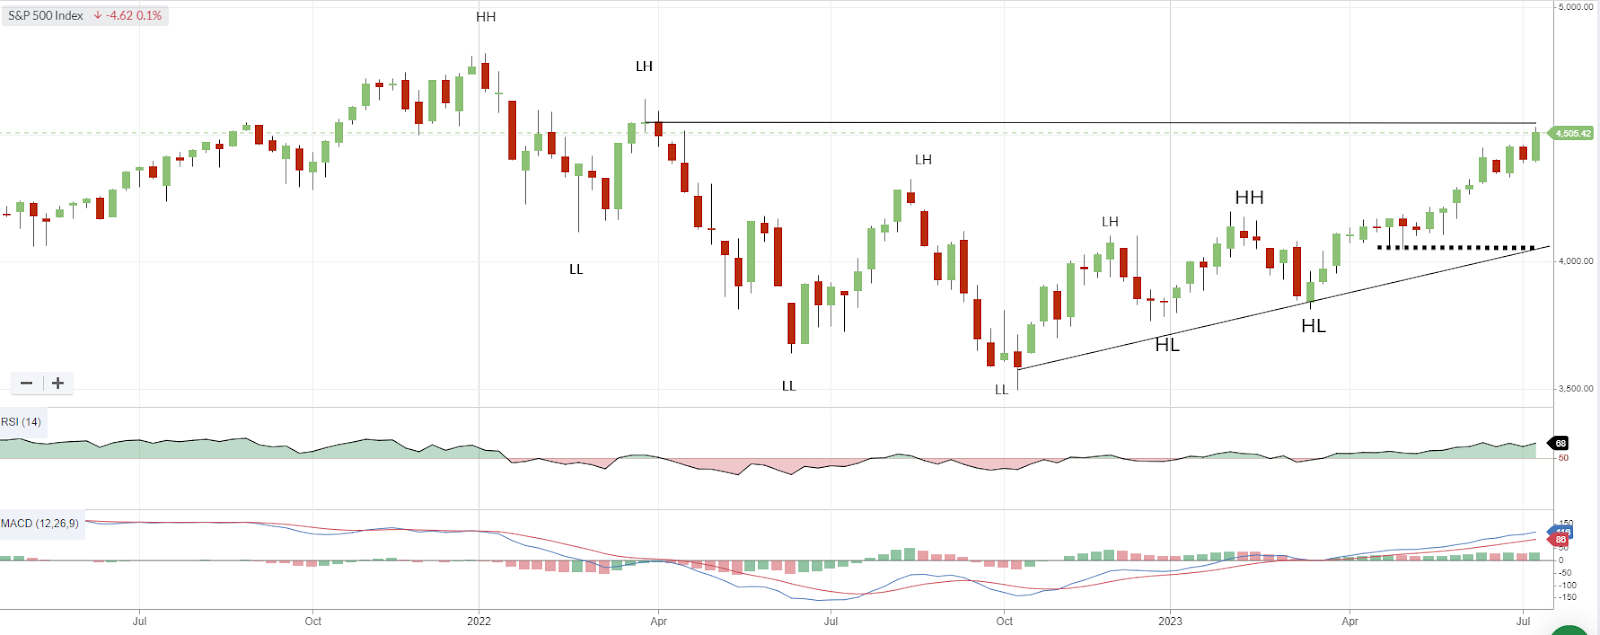
S&P500 Weekly chart
Therefore our target remains (as it has for the last few weeks) of 4535 and support is still 4056. The only thing which has changed slightly, is that previously we saw that 4056 level as short-term support. Though, as the market continues to rise, it becomes a firmer level to observe.
As per last week, the weekly MACD and RSI remain strong and the market is in a short term uptrend.
The start of the US earnings season has thus far been kind as a few US Banks and Financials have reported well. This season many analysts are quite pessimistic on earnings, forecasting a roughly 7% year-over-year drop on average according to reports. That would mark the worst earnings season since the second quarter of 2020, when S&P 500 profits dropped 31.6% on the back of COVID issues..
But it is important to remember that rarely does a reporting season come in below expectations. Analysts notoriously estimate to the downside so as to not get caught in a disappointment. With the early results we have seen, this historical behavioural bias looks set to continue, which bodes well… though it is only early days yet.
Though the big kicker to support this week for the S&P500 which saw it add 2.4% over the five trading days, was the soft inflation numbers which saw CPI rising just 3% year over year, its lowest level since March 2021. This number was further supported the next day by a low producer price index report (a measure of inflation before consumers purchase final goods and services) which came in very low.
Traders through the week cheered the return of a possible Goldilocks scenario (not too hot, not too cold) where there is declining inflation pressures and still fairly robust economic growth. Though as mentioned last week, often interest rates peak well after inflation does, but it looks like traders for the moment are factoring that in confortably.
AUS S&P/ASX200
It was a strong week for the All Ords, taking its lead from Wall Street and general optimism that the global rate rising cycle is closer to the end than the beginning.

S&P/ASX200 Weekly Chart
The move was so strong it covered last week and then some. It was the single most impressive week since March. It was even enough to turn the RSI above 50 and MACD positive (just)

But in essence…. We are still going sideways.
Last week I spoke a few concerning aspects when looking at the daily chart, though they were definitely ignored with four consecutive positive days resulting in the market finishing up 3.7% for the week. That said, the Daily Chart has moved back into the short-term safety of triangle that it briefly broke out of last week.

S&P/ASX200 6 month Daily chart
What we are witnessing may be a case of price contracting, before a strong breakout, OR it is the beginnings of an upward move. This is something we can’t yet consider until it crosses back above the previous lower high. There is no need to try to pre-empt, we simply observe.
With reducing US inflation fears, we obviously rallied as interest rate sensitive sectors experienced strong rallies. While it may not seem immediately obvious why what happens there impacts us, remember many of our global businesses source funding from rates that use US benchmarks, so an easing of a rate rise cycle over there does impact our companies. And even though there is no immediate catalyst for cutting rates on the horizon, the reprieve from the rising rate cycle will be perceived as a reason for margins to remain solid.
Speaking of which, we are also fast approaching our reporting season, with confession season (the time leading up to the report where companies provide high level updates) interestingly quiet.
This can mean one of two things:
Companies are happy with how they have progressed last financial year and see no marked difference from what they or the market thinks they will achieve.(positive)
Companies are remaining ‘Mum’ as the full magnitude of margin compression could be worse than first thought (negative)
Time will tell which it is, though as always, reporting season can be a challenging time for Momentum focused investors, so they need to tread warily. Perhaps wait for some of the early reports to see some general themes because you know that if the big guys are seeing a few droplets, it will be a downpour in the smaller end of town, with most of those guys reporting in the 3rd week of reporting season and after.
One of the other VERY pleasing aspects has been the significant jump in the number of companies within the Shine Zone, as well as those within 5% of their 52 week high this week. This shows clearly that sentiment below the surface (ie outside the bug guys in the index) is looking a lot healthier than had previously been the case. It warrants further attention from traders (all within the lens of broader market sentiment of course.)
Notwithstanding the strong week, be demanding of your chart patterns as “less is still more” in this sideways moving market, unless you receive a clear signal. As mentioned for a few months now, you can trade stocks at the minute if you wish, but look for impeccable set-ups as the market will not look to do you any favours. And as always, keep your stops in place.
Member corner
In this section we will provide a detailed chart assessment, on a maximum of ten stocks weekly, on companies from those of you in the Gallery.
If no one asks for a stock to be analysed, this section will remain blank.
Also please note, that while we may receive a number more queries than ten per week, we retain the right to save a stock for another week, or ignore it all together.
The analysis will be akin to what was covered under the “Stocks of Interest” within the previous Momentum Monday reports and is highlighted in the Shine Zone area below.
If you have a stock you would like analysed from a momentum perspective, please write it into the comments section below or email us at support@stockopedia.com.au
ASX:AD8 Audinate Limited
StockRank 62
Momentum Rank 75
QM Rank 77
VM Rank 53
A$9.17
Audio visual business Audinate (ASX:AD8) is a global leader in the development and sale of AV equipment. Pre-pandemic it had started to generate profits, but they quickly disappeared though they are forecast to return to profitability in 2024. One pleasing aspect has been there ability to continue lifting revenues, further emphasing their market leading position.
I have held this stock before and I am keen to buy them once again, so when might that be on the chart?
I only spoke about this stock one month ago. At the time I noted the breakout and subsequent pullback. It almost all went to plan as the price rose to $10.11, but has since come back, and even tested the support level once again.

ASX:AD8 Daily chart 1 year
Let me start by saying the most recent pullback was deeper than I had hoped. As I mentioned in Friday’s Lunch ‘n Learn session, the price pullback broke through short term support. Had it been able to hold $9.06 at the time it would have felt a lot more comfortable.
But on reflection, this is not disastrous, in fact the pullback to $8.63 in July was close enough to the multi-month support/resistance line highlighted previously (formed from the first spike in late 2022), and you will see the price has since bounced off that level.
So I opened this commentary with when I would get in. I am going to wait for a breach of $9.38 as that will be above the ATR, above the 50 day MA and it still won’t be too far from $8.63 which would now become my stop-loss. I like that level as a stop “because I won’t have to wait long to know if I am wrong” and a breach below that will mean that over the short term the price has topped.
We need to respect the recent shape of the last few months, irrespective of personal biases for the stock.
ASX: 360 Life360
StockRank 65
Momentum Rank 97
QM Rank 85
VM Rank 66
A$7.91
Life360 (ASX:360) is company I Iast spoke of in March. At the time the price was bubbling along a multi month support level, testing it a number of times.

ASX:360 Daily chart 1 year
At the time I mentioned that if the price broke $4.75 I would sell, and I did for a loss on my second trade of the stock. However sure as anything, the price rebounded and got back to the $4.70 - $5.20 range it got stuck in for two months.
I did say at the time the price was hanging on for dear life, so I was cautious on any break to the downside. I also said that the price needed to get back above $5.37 to show signs of a recovery. So when it did, I got back in, and the rest is history.
Now the chart is at 52 week highs and continues to look bullish, with each pullback an opportunity to top up. If I was looking for an entry point here, now is it, with a potential stop at $7.26. The risk if it breaches that level (not a "certainty" - but its a risk) is the price could fall back to $5.80 which would fill the gap created in May. So I have my stop in place.
Hopefully Momentum can continue for this stock. After all, with over 50M users worldwide and aiming for more, there is runway for continued growth.
ASX: A4N Alpha HPA
StockRank 47
Momentum Rank 94
QM Rank 71
VM Rank 50
A$1.18
Another very impressive looking chart belongs to Alpha HPA (ASX:A4N) . The company is involved in a process for extracting ultra-high purity alumina (HPA). The outcome of what they produce is used in components in the production of LED lighting, synthetic sapphire, semiconductors, and lithium-ion batteries.

ASX:A4N Daily chart 1 year
This chart looks so good, it should be in a Momentum investing textbook.
Unfortunately I missed the first breakout at $0.75, despite looking fantastic on the set-up (lesson learnt). Fast forward to today and if it closes above $1.195, I will be in it. My parachute stop loss level will be $1.10. There is really not much to add.
Hopefully the pattern of price growth can continue.
Stocks in the Shine Zone
To learn about the Shine Zone and how to use it, you can read it here.
The rules for inclusion in this list are based on those I like to see in a stock before considering a trade in it:
QM Rank above 80
Price is above the 2.5x ATR
50d MA is above the 200d MA
Price is greater than the 200d MA
Market cap greater than $200M
This is a very important point: the “Shine Zone” are rules for possible buying. They are not for holding and/or selling. If a stock falls out of the shine zone, use support levels to set your stops, or instigate a parachute stop if necessary. With markets moving sideways, one expects frequent changes in these lists.
Read the “how to” article above to learn more
Data is at 14 July and is sorted by the stock code.
Changes from last week

Shine Zone list as at 14 July
52 week high screen
In this section we identify stocks within 5% of their 52 week high based on the idea, supported by academic studies, that stocks close to their 52 week highs tend to outperform. Weekly changes to the list will also be noted.
If you wish to recreate this screen in the screener select "Price vs 52 high" greater than -5% and Mkt Cap greater than $200M
A stock coming onto the list is NOT an automatic buy, just as a stock that leaves the list is NOT an automatic sell. As with the shine list, assess every chart on its merits. However movements on this list may alert you to interesting charts so be sure to look at the Stockopedia and the chart first.
Data is at 14 July and is sorted by the stocks closest to their 52 week high.
And remember, past performance is no guarantee of future performance.
Changes from last week

Stocks within 5% of their 52 week high as at July 14, 2023

Important Information: Stockopedia Ltd ABN 39 757 874 670 UK business registration number 0637267 (“Stockopedia”) is an Authorised Representative of Daylight Financial Group Pty Ltd ABN 77 633 984 773 (“DFGPL”) which is the holder of an Australian Financial Services Licence (AFS Licence No. 521404).
Information in this commentary is current as at date prepared unless otherwise stated. However, please bear in mind that investments can go up or down in value, and that past performance is not a reliable indicator of future performance. For more Important Information please refer to the Disclaimer section of this website.
This communication may contain general financial product advice. It has been prepared without taking into account your personal circumstances, and you should therefore consider its appropriateness in light of your objectives, financial circumstances and needs before acting on it.
If our advice relates to the acquisition or possible acquisition of a particular financial product, you should obtain a copy of and consider the Product Disclosure Statement (PDS) before making any decision.
The author holds interests in 360 and in companies listed in the data tables . This position can and will change at any time without notice.
Disclaimer
This is not financial advice. Our content is intended to be used and must be used for information and education purposes only. Please read our disclaimer and terms and conditions to understand our obligations.
1 comment
Member corner request.
ASX:DRR Deterra Royalties Ltd
ASX:VEA Viva Energy Group Ltd
Thanks!