Momentum Monday 17th June 2024

Welcome to Momentum Monday.
There was a disconnect between Australian and US Markets last week, as their Tech Heavy index out performed our Mining Heavy Index. From time to time this will occur but it doesn't mean the narrative is any different. As a Momentum Investor you will understand that there are times when certain sectors are hot, and times when they are not.
Therefore this raises the question of diversification, and if you ask me from a Fundamental perspective, I say it is essential. If you ask me from a Momentum perspective I say there in no need to diversify, PROVIDED you have your exit strategy defined for every stock. No questions. It is easy at the moment to see the stocks that are not going up relative to a market at all time highs, therefore keep your trigger finger in your pocket, and wait for the price to show you the right signs.
As the great Quality Investor Warren Buffett said, “The stock market is a device for transferring money from the impatient to the patient” - this is just as true when it comes to Momentum investing. Ours is not to pick tops and bottoms. Rather it is the chunky bit in between and hopefully it is headed North East rather than South East.
Interesting links
This week on Weekend Watchlist run in conjunction with Shares for Beginners, we cover stock with a high visual presence in REA - REA Group. Listen here to the replay
We have run the Friday Lunch ‘n Learn session for members. Click here to access the replay
We have also launched our Investor Mastermind Series with the first in the hot seat being Roger Montgomery from Montgomery Investment Group to be held this week. Book your place here.
Our “Empower Others” referral program has been updated and it offers the biggest discount we have available anywhere (Even better than the EOFY offer). To Learn read more here if you are interested in sharing this tool with other like minded investors
For any external commentary we make to the broader market, follow us on Social Media Facebook Linkedin Instagram or X (formerly Twitter)
This week’s content is as follows:
Broader market sentiment
Member corner
Stocks in the “Shine Zone” (including changes)
Buses pulling out of the station (volume + price movers)
52 week high screen (including changes)
A reminder that you don’t have to read all this contribution. Simply scroll to the area of interest.
Broader Market Sentiment
We look at the direction of both the US and ASX markets to gain an understanding of the broader sentiment at the minute. It is important to stress here that I DO NOT use this to time my entry or exit out of stocks. I prefer to use the individual charts of stocks to do that. However I find it useful in helping us determine how aggressive/cautious traders should be in their trading. In short the more positive the broader market is the more risks you can take and vice versa.
US / S&P500
A slightly weaker close on Friday for the S&P500 was not enough to de-rail the Bulls at this time and the US Market closed up once again for the week.

S&P500 Weekly chart
For the weak the broader index closed up 1.6%. It is fair to say that his latest run has been lead in large part by the tech sector. This week it was Adobe's ability to beat analyst's expectations that was applauded. Though it's fair to say the sheer massive size of their IT sector and our small representation here is most likely the reason for any divergence this week.
This week it was all about the softer than expected inflation numbers which added more support to further rate cuts coming. This despite the Federal Reserve changing its view that three further rate cuts were expected down to one.
The weakness in inflation coming from both consumers and producers was enough to drown out less than enthusiastic commentary from the Fed.
After such a strong week I would normally remind investors that each win brings us closer to our next loss. However, this is only our second consecutive up week on this latest run and therefore the next direction will be a guessing game to be honest.
I do notice though that on a weekly basis the RSI has risen above 70 for the first time in a while. Historically this has lead to a period in volatility, but I don't use the indicator in that manner (A reading of above 50 on a weekly chart is enough to tell me the trend is positive)

MACD and RSI since start of 2024
My level of 4734 remains stoic, though I do note that the recent run in the index has created a new level of interest for short term traders and that has been lifted to 4967. This coincides with the structural close in the middle of April this year.
I continue to be aggressive with Equities globally.
AUS S&P/ASX200
It was a shortened trading week this week, but unfortunately it was not a positive one. It opened near the high and closed near the low.

S&P/ASX200 Weekly chart
As mentioned above this underperformance of the S&P500 may be frustrating for some, but it is to be expected in my view.
The 1.7% decline in the S&P/ASX200 for the week was somewhat disappointing (it was the worst in two months) but again doesn't change the narrative. All themes are well established, and have been discussed here many times.
Of course it is tax time coming up, and I hope you are holding many gains making this period a relaxing one for you. However, if you do pay tax, remember if you are sitting on losses, some of those stocks that you may sell are going to be worth more to you as a tax deduction than if they double in price.
As we return to usual programming this week, look to the release of minutes from the RBA meeting from it's coming Board meeting to be the next catalyst for sentiment. As many suspect, current rates will remain on hold and the commentary will support the idea that we won't see another rate cut in 2024.
It has been also unsurprising to see the reduction in both the Shine Zone lists and 5% from 52 week high lists. Also it was interesting to see the number of false starts from Buses pulling out of the station. This is totally to be expected when the index has a big sell off during the week. But as I say in the opening of each section, falling out of the list is not necessarily a sell signal. But I do find the expansion and subsequent retraction of the size of the lists interesting.
Anyway, there should be no need to hold stocks going south-east at the minute. Otherwise you need a strong Fundamental reason for why the market is wrong.
Either way I will remain steadfast in my view on broader market sentiment until the index at least falls below 7547 in the short term.
Member corner
In this section we will provide a detailed chart assessment, on a maximum of ten stocks weekly, on companies from those of you in the Gallery.
We welcome stock requests to be analysed from members. We will also be looking at the charts of some of the more actively researched stocks for the week. We will try to rotate through a selection so as to not make the charts stale, however we will likely not cover a stock within 2 months of when it was last discussed.
If you want to see what has been written about a stock recently, go to the discussion area.

We will not be making up suggestions. If there are no changes to the most viewed list and/or there are no suggestions from members, then no stocks will be covered.
To learn of the methods used to analyse companies in this section, refer to my Momentum Journey series that I articulate here in three parts.
They will help provide context on what I am writing about and the editorial angle of this report.
Also look at the market capitalisation and liquidity before making any decisions!
And again, if you have a stock you would like analysed from a momentum perspective, please write it into the comments section below or email us at support@stockopedia.com.au
IF NO ONE ASKS… HOW AM I SUPPOSED TO KNOW?!?
ASX: DRO - Drone Shield
StockRank 58
Momentum Rank 97
QM Rank 84
VM Rank 55
A$1.455
A stock that appeared in the most reviewed list last week quite often is a stock we last discussed from a Momentum perspective in March this year. It is DroneShield (ASX:DRO)

ASX:DRO 1 year Daily chart
At the time, we noted that it was a thematic/story stock. And that support could be found at $0.42 or $0.62 cents for traders. Well it still remains a thematic stock and though it breached the $0.62 level (not $0.42) it has kept running. Again I feel that stop losses need to be tight on such stocks are the news flow can impact price in such a large way. It was also unsurprising to see it do a capital raising in April.
The price has gone from strength to strength on the back of the announcements of new contracts, as well as the fact that it has turned this current optimism into profits and cash flows. So the question is, where to from here? In my view you will all know I feel prices zig and zag, they rarely go in a straight line north-east (or south-east for that matter)
For non holders there may be some better buying to be had at the $1.12 level, or $1.20 odd if you can’t wait. For holders who have enjoyed the run up, a stop at $1.295 which was the close at the start of early June may be appropriate.
But all it’s going to take is another contract win and all these levels will change. It is definitely a stock in the right place at the right time. As I said last time I commented on this from a Momentum Perspective, they “will have to prove to keep the price around here is that the run is sustainable moving forward.
ASX: BHP - BHP Limited
StockRank 81
Momentum Rank 66
QM Rank 77
VM Rank 79
A$43.09
As the largest stock on our exchange it is not unusual that BHP (ASX:BHP) gets a frequent look in by members, and it has been two months since it was last reviewed.

ASX:BHP 1 year Daily chart
Back then I called the chart ‘messy’ and it still appears that way. You can read the past coverage here I do acknowledge its size though and its impact on the broader market, I actually think that has been a saving grace for it. However as Copper prices start to weaken, the pullback in Iron Ore prices are less insulated and we have seen that reflected in the price. My view that, “the price keeps moving sideways at best. Negative at worst” is still relevant, particularly following that breach of support in March this year.
But how I see the stock is that it has been going sideways for some time, and it needs something significant to break out of that trajectory. Perhaps it had hoped the Anglo American purchase, which has now failed, would provide a leg up?
ASX: S32 South32
StockRank 63
Momentum Rank 67
QM Rank 69
VM Rank 63
A$3.66
A member lamented their timing on exiting South32 (ASX:S32), a stock we have discussed recently. Anton wrote about it in April though it was covered from a Momentum perspective in the same month and you can read that here.

ASX:S32 1 year Daily chart
I cheekily said,not to wake me until the price had crossed above $3.55. Well it did that, it even got to $3.97. The price has retraced, though I think it could go lower but it is at an interesting juncture where the resistance of $3.55 may prove to be a better buying level. While I mentioned that it needs to hold the lower low of $2,82, an optimum point for buying may be above $3.30 which will create a nice exit point if needed at that lower low level just mentioned.
I agree that it is hard to get a handle on the commodities S32 is involved in and their moves, but this is a very different business now than they were back at the demeger so understanding that is crucial. The recent price weakness I dare suggest is due to their copper exposure. And just like BHP, they don’t chart their own destiny as much as they are price takers of whatever commodity prices give them.
And a final point. Those that master Momentum Investing are able to easily manage the hardest task in investing. No, it is not selling a stock - that is actually quite easy. Rather it is buying back into a stock at a higher price than what they sold it at. That is the real challenge.
ASX: DRR - Deterra Royalties
StockRank 65
Momentum Rank 32
QM Rank 62
VM Rank 48
A$4.15
Unsurprising that after a near 7% fall in price in one day from Income Investor favourite in Deterra Royalties (ASX:DRR) saw it jump onto the most viewed list on Saturday. However this was discussed from a Momentum perspective back in July last year

ASX:DRR 1 year Daily chart
Back then I said, “The continued ramp up of the South Flank operations, an improvement in iron ore prices and new asset will help with sentiment. Until then it appears range bound.” In hindsight I should have written ‘a new asset that makes sense to the market” as it is obvious the market didn’t like the acquisition of Lithium land, despite the size of the Thacker Pass Lithium Mine in Nevada US.
Obviously the change in dividend payout ratio was also going to happen given the acquisition was made up totally of debt, and all previous earnings were paid out to investors. But somehow this too came as a shock. While the drop in yield may be a disappointment, I don’t see the expansion into the US as an operational risk, given they don’t actually mine the stuff. They just hold the land. And the Thacker Pass is one of the largest known Lithium deposits in the world with a multi decade life expectancy.
Therefore what to do now? I will say from the outset that I like companies that don’t have to do anything. But I appreciate they’re not the type of stock you often look at from a momentum perspective. The Price went up to its peak at the end of January as Iron Ore prices rebounded, but have since fallen with the ultimate capitulation on Friday. As a price taker, there isn’t much DRR can do about its price other than use their cash to pay dividends or make these acquisitions, which in this instance hasn’t floated anyone’s boat.
I see DRR in a short term downtrend with a series of lower highs and lower lows created. Actually it was interesting to see two things. One that the lower low found support at the 4Qtr 2023 levels, and two, that Lower High was established close to the structural level of resistance that was created all the way back in 2021 (three years ago). Also the pullback saw it touch structural support at around $3.95, a level that was established in 2022, and it is there that there may prove better buying, but if it fails to hold that, then the target becomes $3.57, it too a level not seen since 2021

ASX:DRR 5 year Weekly chart
This is a relatively tight range for such a large business, but it is unsurprising given the surety of earnings and dividends. Though that all changes for the moment until the acquisition is bedded down and a dividend cheque is paid. Suffice to say, if channel riding is your thing, then you are closer to the bottom today than the end of January. Over time though I still see the company paying a high yield and remaining more of a focus for income investors, though over the short term this view has taken a hit as reflected by the price on Friday.
Stocks in the Shine Zone
To learn about the Shine Zone and how to use it, you can read it here.
The rules for inclusion in this list are based on those I like to see in a stock before considering a trade in it:
QM Rank above 80
Price is above the 2.5x ATR
50d MA is above the 200d MA
Price is greater than the 200d MA
Market cap greater than $200M
This is a very important point: the “Shine Zone” are rules for possible buying. They are not for holding and/or selling. If a stock falls out of the shine zone, use support levels to set your stops, or instigate a parachute stop if necessary. With markets moving sideways, one expects frequent changes in these lists.
If you feel there is a stock that should be included but is missing please let us know. This is a manual process and occasionally one gets through the cracks
Also look at the market capitalisation and liquidity before making any decisions!
Data is at 15 June and is sorted by the stock code.
Changes from last week
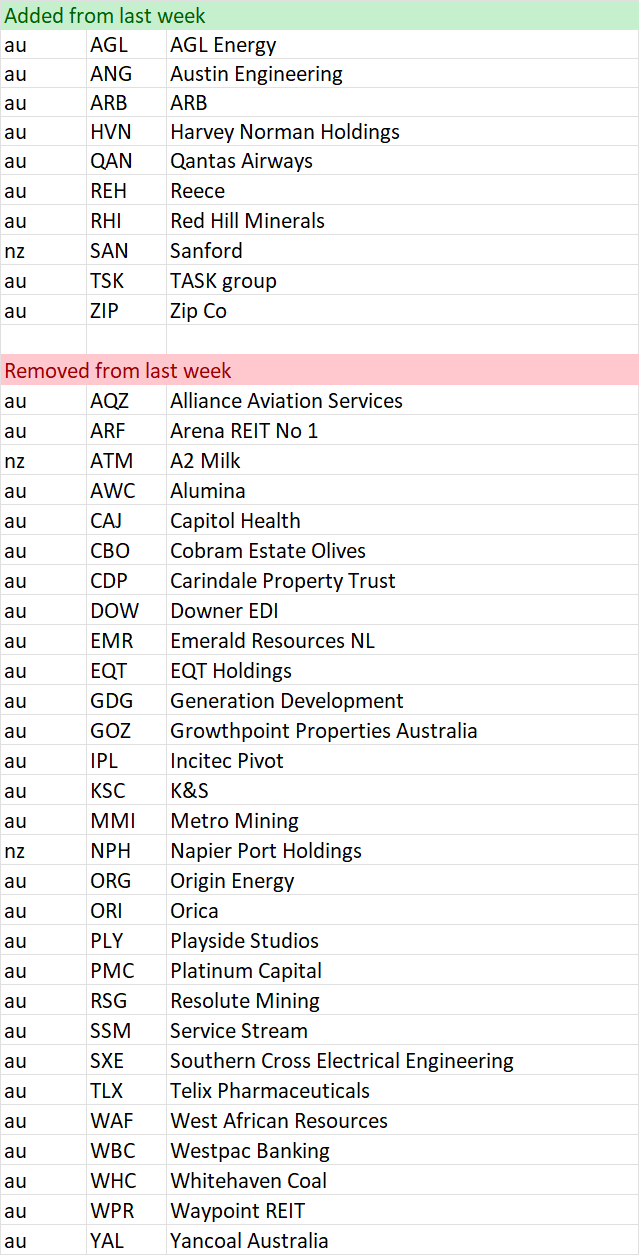
Shine Zone list as at 15 June

“Bus pulling out of the station”
To learn more about this screen read the following article on the objective of the screen
Here is a shortcut in understanding the reasons why a stock is removed:
Volume drop = Bus might be moving, but no one is on it
Price 1 mth < 0% = Bus has been cancelled
Price 3mths >= 3% = Bus has pulled out of the station
Also look at the market capitalisation and liquidity before making any decisions!
Data is at June 15 and is sorted by the stock code.
Changes from last week
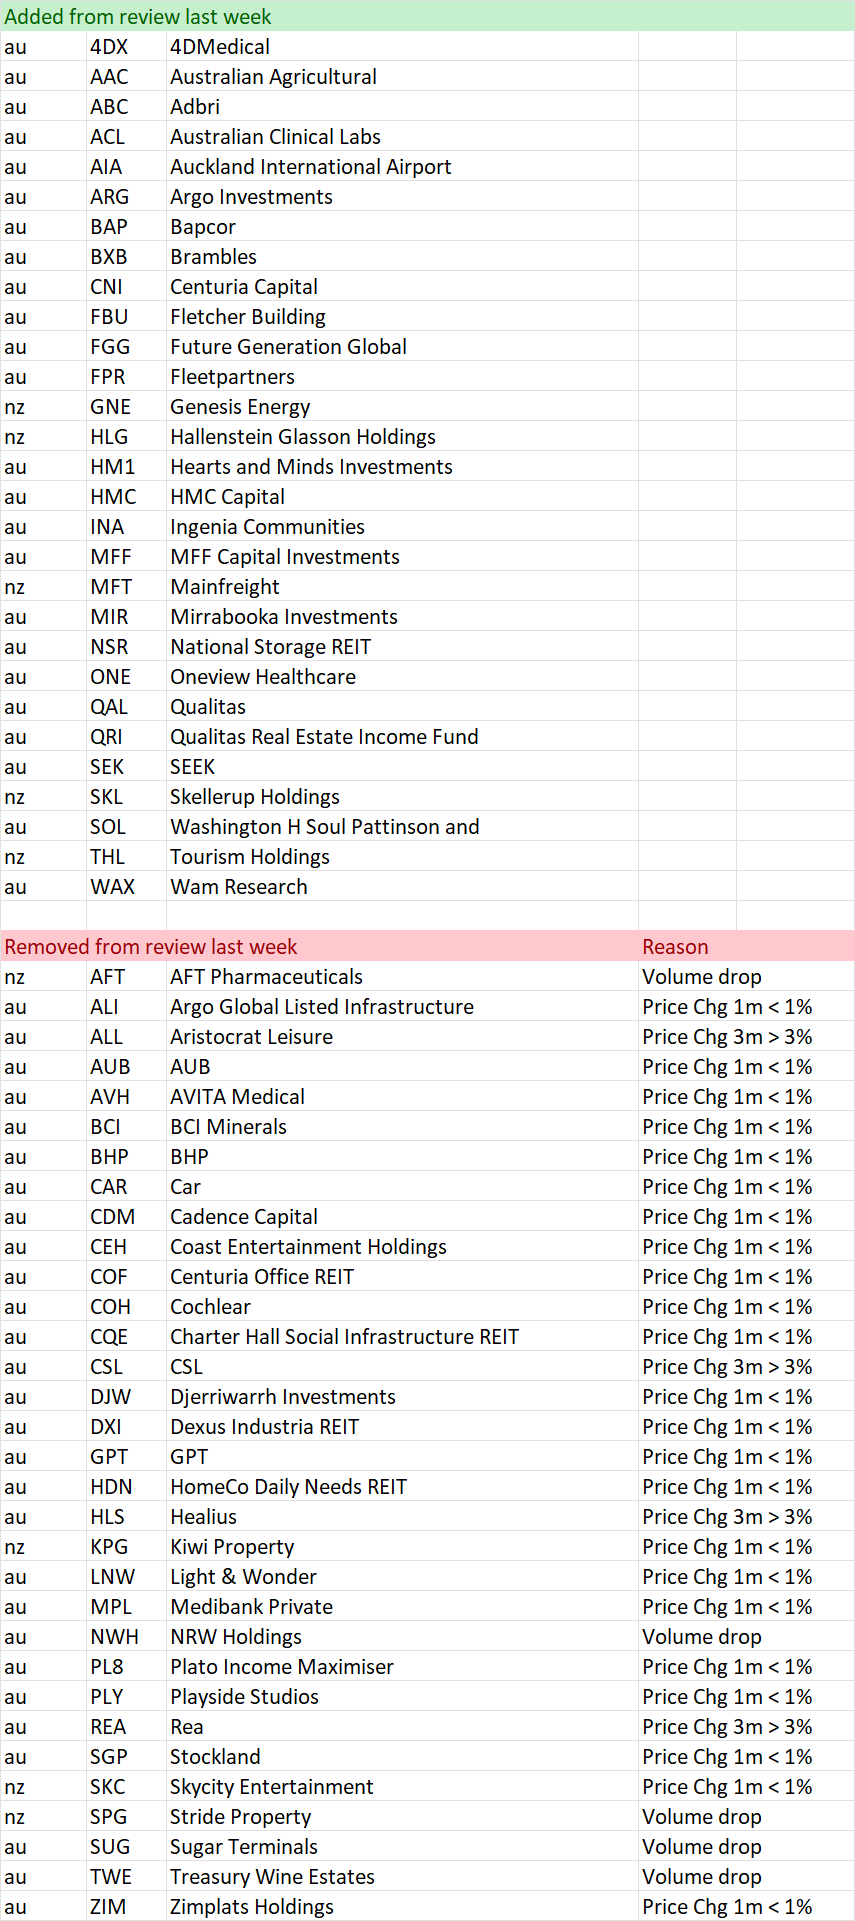
“Pulling out of the station” on 15 June
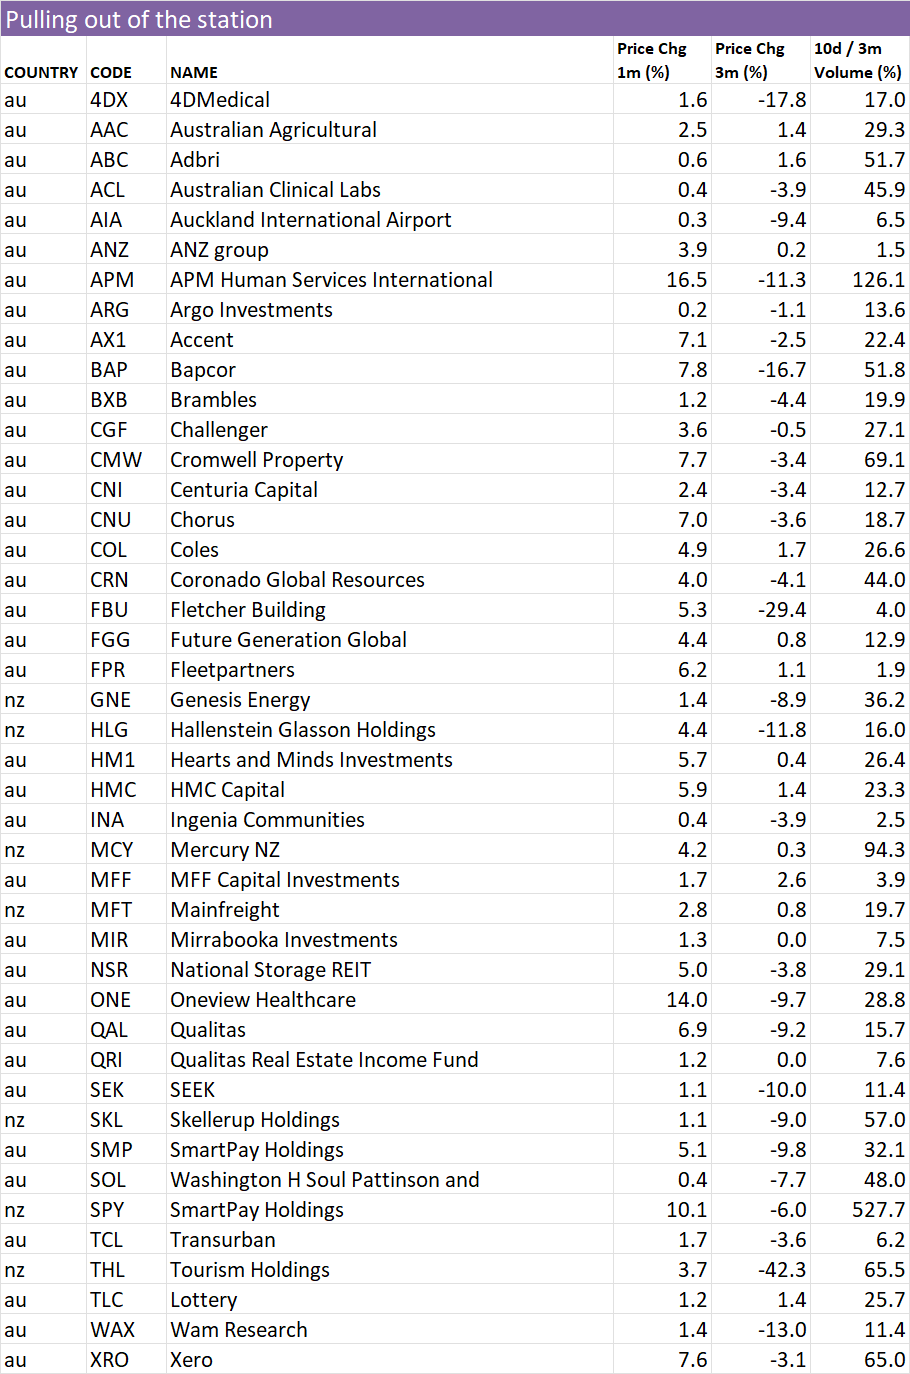
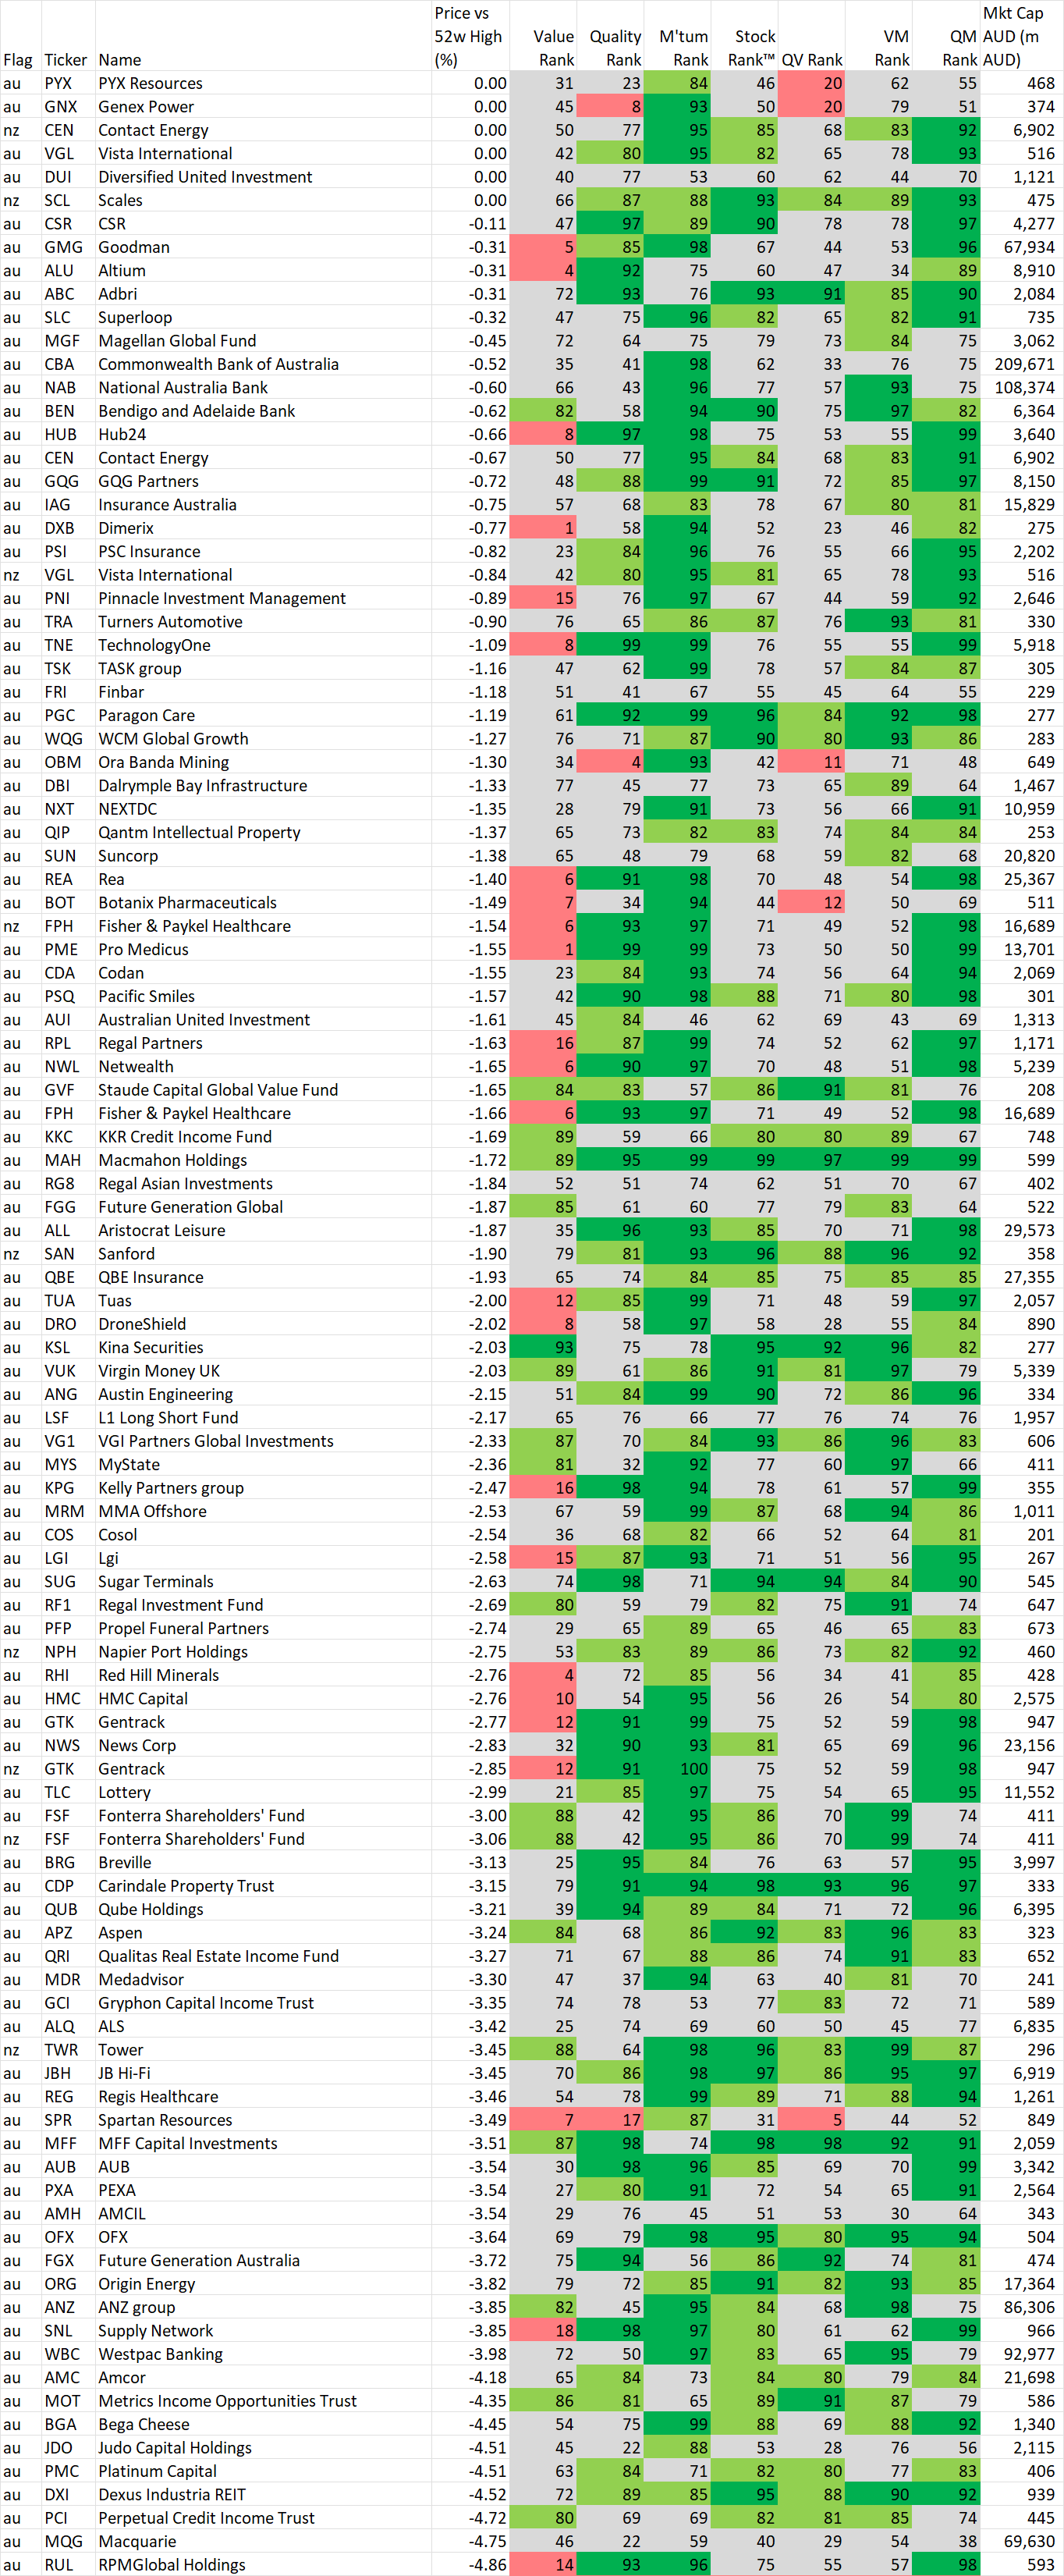
52 week high screen
In this section we identify stocks within 5% of their 52 week intraday high based on the idea, supported by academic studies, that stocks close to their 52 week highs tend to outperform. Weekly changes to the list will also be noted.
If you wish to recreate this screen in the screener select "Price vs 52 high" greater than -5% and Mkt Cap greater than $200M
A stock coming onto the list is NOT an automatic buy, just as a stock that leaves the list is NOT an automatic sell. As with the shine list, assess every chart on its merits. However movements on this list may alert you to interesting charts so be sure to look at Stockopedia and the chart first.
Data is at 15 Jun and is sorted by the stocks closest to their 52 week intraday high.
Also look at the market capitalisation and liquidity before making any decisions!
And remember, past performance is no guarantee of future performance.
Changes from last week
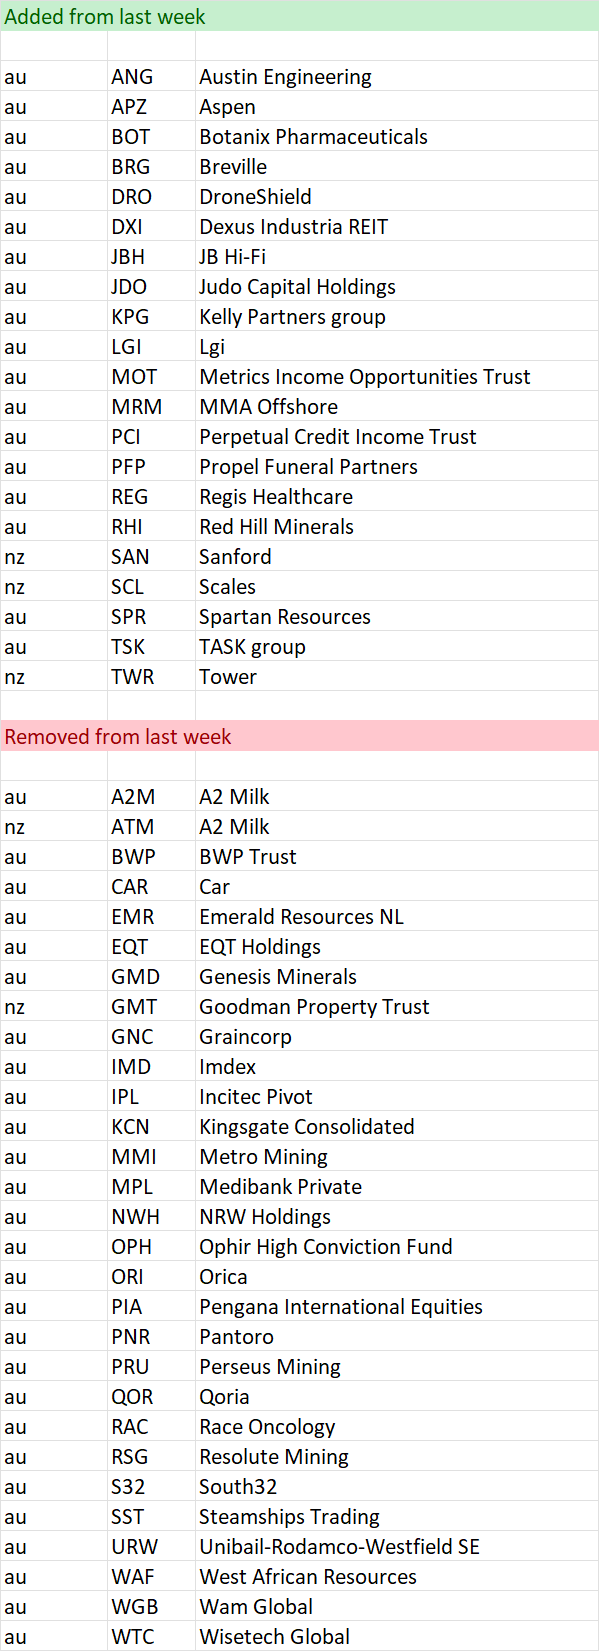
Stocks within 5% of their 52 week high as at 15 Jun
Important Information: Stockopedia Ltd ABN 39 757 874 670 UK business registration number 0637267 (“Stockopedia”) is an Authorised Representative of Daylight Financial Group Pty Ltd ABN 77 633 984 773 (“DFGPL”) which is the holder of an Australian Financial Services Licence (AFS Licence No. 521404).
Information in this commentary is current as at date prepared unless otherwise stated. However, please bear in mind that investments can go up or down in value, and that past performance is not a reliable indicator of future performance. For more Important Information please refer to the Disclaimer section of this website.
This communication may contain general financial product advice. It has been prepared without taking into account your personal circumstances, and you should therefore consider its appropriateness in light of your objectives, financial circumstances and needs before acting on it.
If our advice relates to the acquisition or possible acquisition of a particular financial product, you should obtain a copy of and consider the Product Disclosure Statement (PDS) before making any decision.
The author holds interests in companies listed in the data tables . This position can and will change at any time without notice.
Disclaimer
This is not financial advice. Our content is intended to be used and must be used for information and education purposes only. Please read our disclaimer and terms and conditions to understand our obligations.
2 comments
You must a lot of time and effort giving us these VERY DETAILED reports - BIG thanks ☺️
Thanks Elio. For those interested in DroneShield (ASX:DRO), today is the day that Tranche 2 of the capital raising shares are issued to institutional investors. This will be 38 million shares issued at 80 cents, so I imagine it will be tempting for the instos to cash out. If we see some weakness this week, that is most likely the reason.