Momentum Monday 18 December

Welcome to Momentum Monday.
And many happy returns to you and yours this festive season.
This will be the last Momentum Monday until 08 January next year. It has been our absolute pleasure to deliver this very accurate component on your membership (even though the market hasn't moved much).
Look forward to more level setting in 2024!
Interesting links
Weekend Watchlist with Shares for Beginners is on hold till the new year. Listen here to replays
The final Q&A session of the Multibagger series is now available for members only to View here Scroll to the bottom of the page under “Accessing Masterclasses” to access it.
“Empower Others” referral program Learn more here
Follow us on Social Media Facebook Linkedin Instagram or X (formerly Twitter)
This week’s content is as follows:
Broader market sentiment
Member corner
Stocks in the “Shine Zone” (including changes)
Buses pulling out of the station (volume + price movers)
52 week high screen (including changes)
A reminder that you don’t have to read all this contribution. Simply scroll to the area of interest.
Broader Market Sentiment
We look at the direction of both the US and ASX markets to gain an understanding of the broader sentiment at the minute. It is important to stress here that I DO NOT use this to time my entry or exit out of stocks. I prefer to use the individual charts of stocks to do that. However I find it useful in helping us determine how aggressive/cautious traders should be in their trading. In short the more positive the broader market is the more risks you can take and vice versa.
US / S&P500
Ok… we are very close to all time highs for the broader S&P500 with another very strong week.
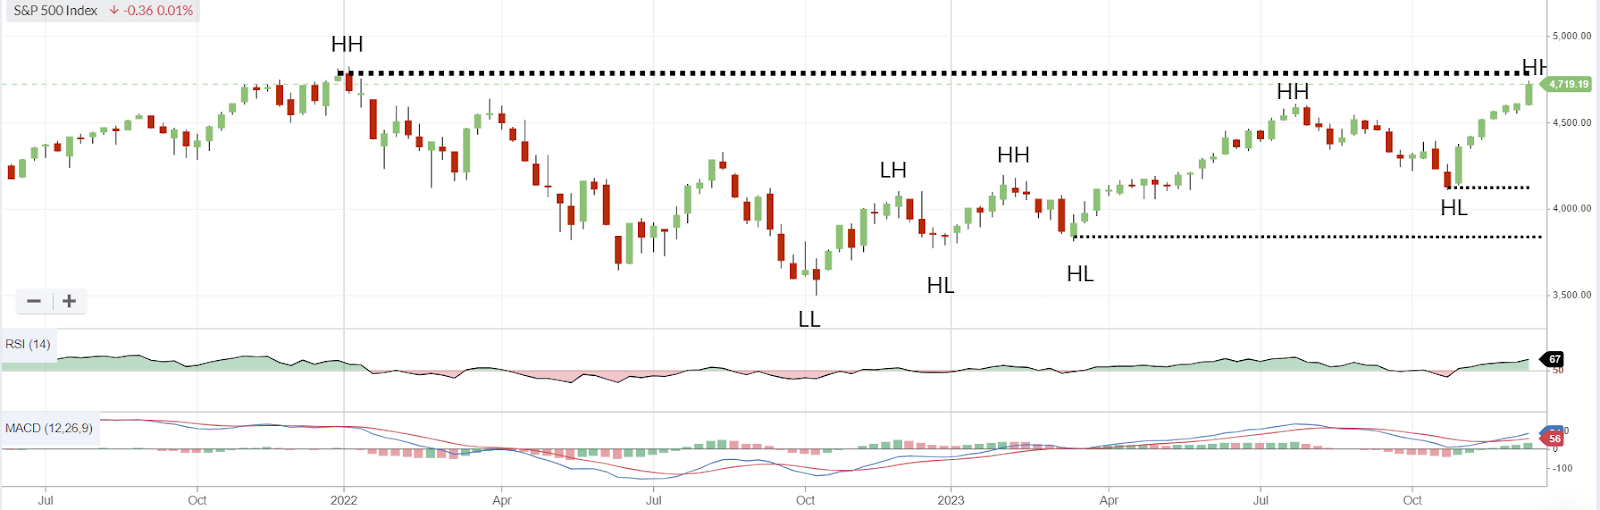
S&P500 Weekly chart
I get that the general sentiment should be positive (I know I am) but this was the 7th consecutive up week, the first since 2017, for the broader index and we now find ourselves at a key resistance level of all time highs (well about 2% off)
Either we need to take a breather to keep the momentum going, or we will become so stretched that a pullback is in order? (I don't predict remember…)
But positivity abounds in the bear term. Short term support remains at 4117 until there is some kind of pullback. And both RSI and MACD are looking very positive.

RSI and MACD since Oct
The firecracker last week was the Federal Reserve admitting that the next interest rate cut would likely be down with three cuts earmarked for 2024. This saw the Dow reach all time high levels, and the broader S&P500 now looks destined to follow suit.
We are in equities globally and hopefully Santa keeps running to the end of the year. All time high levels are a good place to be.
AUS S&P/ASX200
Another good week for the market. A new short term higher high reached and the upper band of resistance looks destined to be tested.

S&P/ASX200 Weekly chart
More M&A activity buoyed the index with WDC and STO talks, despite ORG seemingly falling through and of course a number of others. More stocks than ever are in the 52 week high category and in the shine zone. We are strong.
Banks have experienced a strong re-rate on a falling USD and hopes are that rate rises will be over for now. It looks almost certain that previous highs will be tested and the market is showing all the positive signs with MACD and RSI looking incredibly positive
Barring disaster it looks like it will be a positive year for the index. It was volatile, we know, especially when you scratch a little deeper below the surface. The chart is also quite messy with the short-term higher high that we finished on coming after a short-term lower low.
Therefore you will spare me for sounding less than over excited as I still want evidence to suggest we are out of this sideways move that has been going on for a while now. But I am definitely more positive than not, and at the end of the day I'd rather be here than the alternative.
Member corner
In this section we will provide a detailed chart assessment, on a maximum of ten stocks weekly, on companies from those of you in the Gallery.
We welcome stock requests to be analysed from members. We will also be looking at the charts of some of the more actively researched stocks for the week. We will try to rotate through a selection so as to not make the charts stale, however we will likely not cover a stock within 2 months of when it was last discussed.
If you want to see what has been written about a stock recently, go to the discussion area.

We will not be making up suggestions. If there are no changes to the most viewed list and/or there are no suggestions from members, then no stocks will be covered.
To learn of the methods used to analyse companies in this section, refer to my Momentum Journey series that I articulate here in three parts.
They will help provide context on what I am writing about and the editorial angle of this report.
And again, if you have a stock you would like analysed from a momentum perspective, please write it into the comments section below or email us at @stockopedia.com.au">support@stockopedia.com.au
ASX: PLS - Pilbara Minerals
StockRank 77
Momentum Rank 22
QM Rank 63
VM Rank 58
A$3.92
This was a big week for Lithium stocks. Likewise it was a big week for Pilbara Minerals (ASX:PLS). The most shorted stock on the exchange sitting at 20% (or over $2b)

To be fair it has been a terrible looking chart since August 2023 . The price has almost halved, though not as bad as what Lithium prices have. Since the new lower low on Dec 5th and 6th there has been a rapid improvement since and sees it in a short term uptrend. But long term it hasn't. And that is the presiding sentiment in my view. The stock is in a downtrend with a bounce the opportunity for an “elegant” exit if required.
The direction of PLS and any other Lithium producer/explorer will be governed by Lithium prices. PLS has the added complexity of the amount of short positions on it.
If Lithium prices improve then look for PLS to improve. But for now, it's still in a downtrend. It won't be looked at from a trade perspective until it crosses above $4.30.
ASX: SIG - Sigma Pharmaceuticals
StockRank 69
Momentum Rank 68
QM Rank 88
VM Rank 46
A$0.975
Given the events this week it was unsurprising to see Sigma Healthcare (ASX:SIG) amongst the most viewed stocks amongst members.

ASX:SIG 1 year Daily chart
Over the past year the stock has been attempting to pull itself out of the long term downtrend, with some good effect.
A series of higher highs and a stoic ability to stay above 60 cents means that it has returned to a positive momentum (though interesting to note that the gap from June was pretty much filled.) The jump on Wednesday however was enough to cement the return to positive flavour.
It does highlight though Corporate Actions can impact price significantly in the short term. If I was not fortunate to .be on the first run (as is the case here) I will wait for the price to settle down before considering a position.
Preferably I will see a slight pullback. There is a big gap to fill if I am patient enough (I doubt I will be.)
ASX: STO - Santos
StockRank 96
Momentum Rank 79
QM Rank 88
VM Rank 93
A$7.75
We are covering Santos (ASX:STO) from a momentum perspective for the very first time.

ASX:STO 1 year Daily chart
It gained notoriety last week following the announcement that Woodside was sniffing around.
Long term it has been in a downtrend for some time. Like PLS this week and Woodside last week, as a producer it is a price taker and its price reflects as much.
But STO is the only short-term winner of the deal in our view, so if you wish to play the corporate action then this is it. Otherwise wake me when it crosses $9.
ASX: MFG - Magellan Financial Group
StockRank 99
Momentum Rank 91
QM Rank 98
VM Rank 98
A$9.07
A stock that has been discussed ad nauseum, but never from a momentum perspective is Magellan Financial (ASX:MFG)

ASX:MFG 1 year Daily chart
However you cut it - this has had a tough run. Since the cathartic decline in early October, the price has rebounded now to get back to this levels.
Therefore it is not unsurprising that many are looking at it now. FINALLY the blood letting may have stopped as they achieved net inflows for the last month. It has become a major holder in TAH at a cheap price it would see. It also is moving the global fund to an open fund and at the AGM highlighted why it is optimistic of the future.
In the short-term this looks solid with a series of higher highs and the rapid rebound. But this is a case of buyer beware. There are still skeletons in this closet. Again, don't wake me till it crosses $10.67. For what it is worth, it must stay above $6.17 at all costs.
Stocks in the Shine Zone
To learn about the Shine Zone and how to use it, you can read it here.
The rules for inclusion in this list are based on those I like to see in a stock before considering a trade in it:
QM Rank above 80
Price is above the 2.5x ATR
50d MA is above the 200d MA
Price is greater than the 200d MA
Market cap greater than $200M
This is a very important point: the “Shine Zone” are rules for possible buying. They are not for holding and/or selling. If a stock falls out of the shine zone, use support levels to set your stops, or instigate a parachute stop if necessary. With markets moving sideways, one expects frequent changes in these lists.
If you feel there is a stock that should be included but is missing please let us know. This is a manual process and occasionally one gets through the cracks
Data is at 16 December and is sorted by the stock code.
Changes from last week

Shine Zone list as at 16 December

“Bus pulling out of the station”
To learn more about this screen read the following article on the objective of the screen
Here is a shortcut in understanding the reasons why a stock is removed:
Volume drop = Bus might be moving, but no one is on it
Price 1 mth < 0% = Bus has been cancelled
Price 3mths >= 3% = Bus has pulled out of the station
Data is at 16 December and is sorted by the stock code.
Changes from last week

“Pulling out of the station” on 16 December

52 week high screen
In this section we identify stocks within 5% of their 52 week intraday high based on the idea, supported by academic studies, that stocks close to their 52 week highs tend to outperform. Weekly changes to the list will also be noted.
If you wish to recreate this screen in the screener select "Price vs 52 high" greater than -5% and Mkt Cap greater than $200M
A stock coming onto the list is NOT an automatic buy, just as a stock that leaves the list is NOT an automatic sell. As with the shine list, assess every chart on its merits. However movements on this list may alert you to interesting charts so be sure to look at Stockopedia and the chart first.
Data is at 16 December and is sorted by the stocks closest to their 52 week intraday high.
And remember, past performance is no guarantee of future performance.
Changes from last week

Stocks within 5% of their 52 week high as at December 16, 2023

Important Information: Stockopedia Ltd ABN 39 757 874 670 UK business registration number 0637267 (“Stockopedia”) is an Authorised Representative of Daylight Financial Group Pty Ltd ABN 77 633 984 773 (“DFGPL”) which is the holder of an Australian Financial Services Licence (AFS Licence No. 521404).
Information in this commentary is current as at date prepared unless otherwise stated. However, please bear in mind that investments can go up or down in value, and that past performance is not a reliable indicator of future performance. For more Important Information please refer to the Disclaimer section of this website.
This communication may contain general financial product advice. It has been prepared without taking into account your personal circumstances, and you should therefore consider its appropriateness in light of your objectives, financial circumstances and needs before acting on it.
If our advice relates to the acquisition or possible acquisition of a particular financial product, you should obtain a copy of and consider the Product Disclosure Statement (PDS) before making any decision.
The author holds interests in PLS and companies listed in the data tables . This position can and will change at any time without notice.
Disclaimer
This is not financial advice. Our content is intended to be used and must be used for information and education purposes only. Please read our disclaimer and terms and conditions to understand our obligations.
2 comments
Thanks for your help, advice and structure over the last year. I certainly have not used your comprehensive approach to trading and investing, although I have traded invested for more than 20 years. Am slowly coming round to your approach. Have a great season and looking forward to 2024 and in particular resources and Lithium making a comeback. Cheers.
I would definitely cheer Lithium back... but only if the charts tell me to open my mouth. I think my next evolution in 2024 is to limit the stocks I look at so I don't miss patterns. It's had when you cover all ASX and NZX... but the limited time I now have to look at markets means I have to do something... right?.... Thanks for the support and more to come in 2024!