Momentum Monday 19 February

Welcome to Momentum Monday.
On behalf of Chris and I, we wish to pass on our thanks for the sentiments shared at Friday’s Lunch ‘n Learn session.(recording accessed under interesting links) Both those internal and expressed. We look forward to more smooth sailing ahead.
Everything was mixed which is typical of a market at the top. As a final reminder reporting season here (in Australian and NZ as well as in the US), so remember for those who utilise Quality metrics, if you want to know whether your companies’ latest financials have arrived, look at the data table. If you see “TTM” and that the financial year ends June, then you know the latest half year figures are being counted.

Interesting links
Weekend Watchlist with Shares for Beginners this week covered a stock that has many eyeballs on it and is the topic of much discussion, it is AGL AGL Limited. Listen here to the replay
We have recently completed our Friday Lunch ‘n Learn webinar. Watch here we have alo answered all questions, if not in the recording, afterwards
“Empower Others” referral program Learn more here
Follow us on Social Media Facebook Linkedin Instagram or X (formerly Twitter)
This week’s content is as follows:
Broader market sentiment
Member corner
Stocks in the “Shine Zone” (including changes)
Buses pulling out of the station (volume + price movers)
52 week high screen (including changes)
A reminder that you don’t have to read all this contribution. Simply scroll to the area of interest.
Broader Market Sentiment
We look at the direction of both the US and ASX markets to gain an understanding of the broader sentiment at the minute. It is important to stress here that I DO NOT use this to time my entry or exit out of stocks. I prefer to use the individual charts of stocks to do that. However I find it useful in helping us determine how aggressive/cautious traders should be in their trading. In short the more positive the broader market is the more risks you can take and vice versa.
US / S&P500
After 5 consecutive positive weeks for the S&P500, this week it took a breath after what was a volatile week.

S&P500 Weekly chart
So am I worried by a 0.42% decline over the week?
I suppose how I asked the question gives its own answer. In my eye the market is still above 5000, a level the S&P500 breached for the first time in its history last week. This is still a positive sign despite the volatility witnessed last week.
The economic news continued to paint the goldilocks scenario where good (bad news) and bad (good news). It seems though to be a battlefield that companies ignore as evidenced by the massive earnings have seen during earnings season. Especially from MegaTech that have driven the recent rally.
But it all comes down to interest rates and when the next cut will come. Talks around that will drive Momentum in US markets for the next few weeks and anything else will support that narrative. Last week we got the sense inflation may be persistent hence why the market likely fell.
Pleasingly for oil investors, US Crude closed Friday at its highest level since November as regional issues are starting to have an impact.
Despite the down week l remain in equities globally.
AUS S&P/ASX200
The S&P/ASX200 eked out a small gain this week after last week's pullback, which keeps the general narrative in play.

S&P/ASX200 Weekly chart
The key difference of course is that reporting season is starting to fire up, and therefore as a result we are seeing volatility. So much so that two of my QM stocks I like to look at in PME and DTL have re-entered my buy zones really quickly. I don't know if I will be right getting them at these levels. But I have my stops so in theory I should limit my damage somewhat if I am wrong.
The reason why I do this section is not to predict what the market will do. Rather it helps me with how aggressive I can be. With substantial pullbacks like that, I do take an interest.
Especially as both pullbacks look like the stocks missed lofty expectations, but extensibility look good operationally. PME has seen its numbers entered into the system. DTL will not be too far behind. This gives me comfort at least operationally the businesses are still sound. It then comes down to at what price am I willing to pay. And as I try to remind investors, prices zig and zag. In the case of these two, it is zagging substantially.
From a broader market perspective therefore things are looking good. Reporting season is pleasing on the upside and defying gloomy analyst forecasts. The focus on managing costs in this environment is pleasing. I read in the AFR that "About a third of the major companies have reported earnings for the December half so far; 47 per cent of those have beaten consensus expectations and 34 per cent have missed the forecasts" (this according to AMP. Despite this, participants in the market are still cautious about the year ahead in the current climate which in my mind tells me if things stay better and even improve, then the significant jumps we've seen will likely be sustainable.
Domestically the battery metals sector will likely get a boost in sentiment as the Federal Government looks to support the ailing Nickel sector who have seen high profile shut-downs in recent times. While the intention will not be to support speculators, the issues with our biggest miners in the face of cheap Indonesian imports can't be ignored for much longer. Basically "Nickel" has been added to the government’s official critical minerals list, meaning it can tap the nation's for funds and get export support internationally. And with Nickel prices expected to stay lower for longer it is needed.
I did note with interest the talk that we establish our own market to combat the Chinese owned LME (London Metals Exchange) with the help of the US government. While it will struggle to have the liquidity needed, plus prices won't vary too much, I see this as another long term step to reduce our reliance on the Chine thematic though they will be contined to be linked to our future.
For those seeking a grey cloud on the horizon beyond high value stocks seeing a pullback, they may point to the last two weeks of MACD which despite being positive have seen the moving average lines come closer.

Beyond that, for all the reasons discussed previously I remain exposed to domestic equities.
Member corner
In this section we will provide a detailed chart assessment, on a maximum of ten stocks weekly, on companies from those of you in the Gallery.
We welcome stock requests to be analysed from members. We will also be looking at the charts of some of the more actively researched stocks for the week. We will try to rotate through a selection so as to not make the charts stale, however we will likely not cover a stock within 2 months of when it was last discussed.
If you want to see what has been written about a stock recently, go to the discussion area.

We will not be making up suggestions. If there are no changes to the most viewed list and/or there are no suggestions from members, then no stocks will be covered.
To learn of the methods used to analyse companies in this section, refer to my Momentum Journey series that I articulate here in three parts.
They will help provide context on what I am writing about and the editorial angle of this report.
Also look at the market capitalisation and liquidity before making any decisions!
And again, if you have a stock you would like analysed from a momentum perspective, please write it into the comments section below or email us at @stockopedia.com.au">support@stockopedia.com.au
IF NO ONE ASKS… HOW AM I SUPPOSED TO KNOW?!?
ASX: AD8 - Audinate
StockRank 66
Momentum Rank 99
QM Rank 96
VM Rank 54
A$20.64
No surprises to see stocks with big moves or big market caps in our most viewed list. This includes Audinate (ASX:AD8)

ASX:AD8 1 year Daily chart
I last spoke of AD8 back in July last year I said at the time I was waiting for a breach above $9.38 to get again, as it did, only to fall back to support. BUT IT HELD. and that was the last time it tested it, rising ever since creating new higher highs and higher lows.
To be fair, as this is a short term trade, I was on alert with the low in February this year. But the subsequent gap up when it released its results on the 12th (they are in the system) have allayed those fears. AD8 have their multimedia Dante solution which exhibition and concert halls are lapping up.
So what now? I mentioned stocks abilities to fill gaps and that is a warning signal for me on this. I have this as a trade so the stock has to stay above $18. As an investor I saw the higher low is still the point to watch, and though you wouldn’t sell straight away, $14.30 may be too deep for people to stomach from here. So will leave it for you to manage. But it’s a good problem to have.
Stocks in the Shine Zone
To learn about the Shine Zone and how to use it, you can read it here.
The rules for inclusion in this list are based on those I like to see in a stock before considering a trade in it:
QM Rank above 80
Price is above the 2.5x ATR
50d MA is above the 200d MA
Price is greater than the 200d MA
Market cap greater than $200M
This is a very important point: the “Shine Zone” are rules for possible buying. They are not for holding and/or selling. If a stock falls out of the shine zone, use support levels to set your stops, or instigate a parachute stop if necessary. With markets moving sideways, one expects frequent changes in these lists.
If you feel there is a stock that should be included but is missing please let us know. This is a manual process and occasionally one gets through the cracks
Also look at the market capitalisation and liquidity before making any decisions!
Data is at 17 February and is sorted by the stock code.
Changes from last week
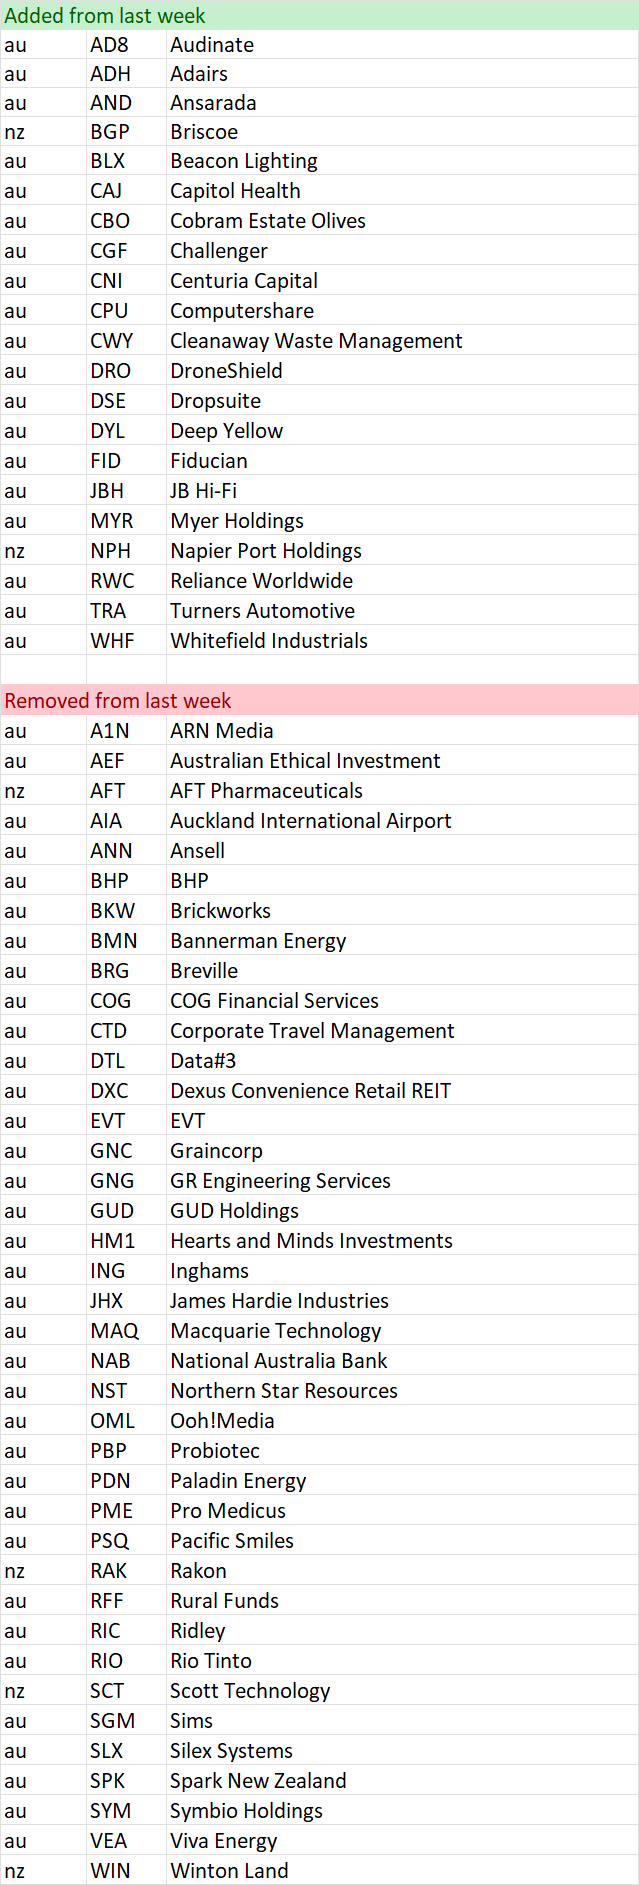
Shine Zone list as at 17 February

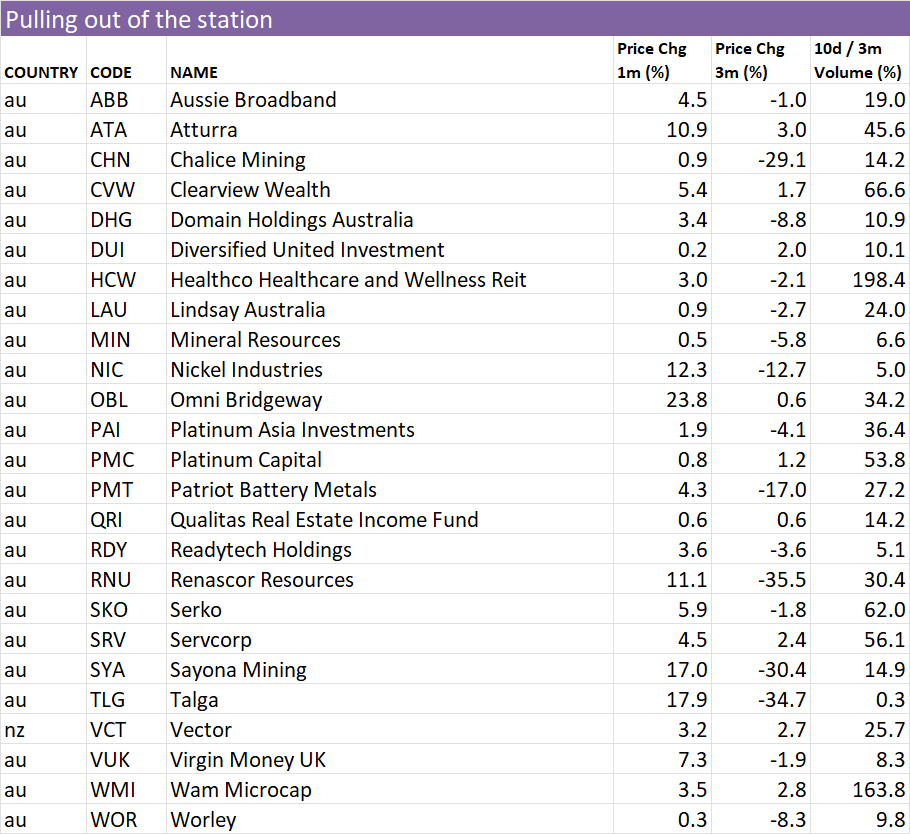
“Bus pulling out of the station”
To learn more about this screen read the following article on the objective of the screen
Here is a shortcut in understanding the reasons why a stock is removed:
Volume drop = Bus might be moving, but no one is on it
Price 1 mth < 0% = Bus has been cancelled
Price 3mths >= 3% = Bus has pulled out of the station
Also look at the market capitalisation and liquidity before making any decisions!
Data is at 17 February and is sorted by the stock code.
Changes from last week
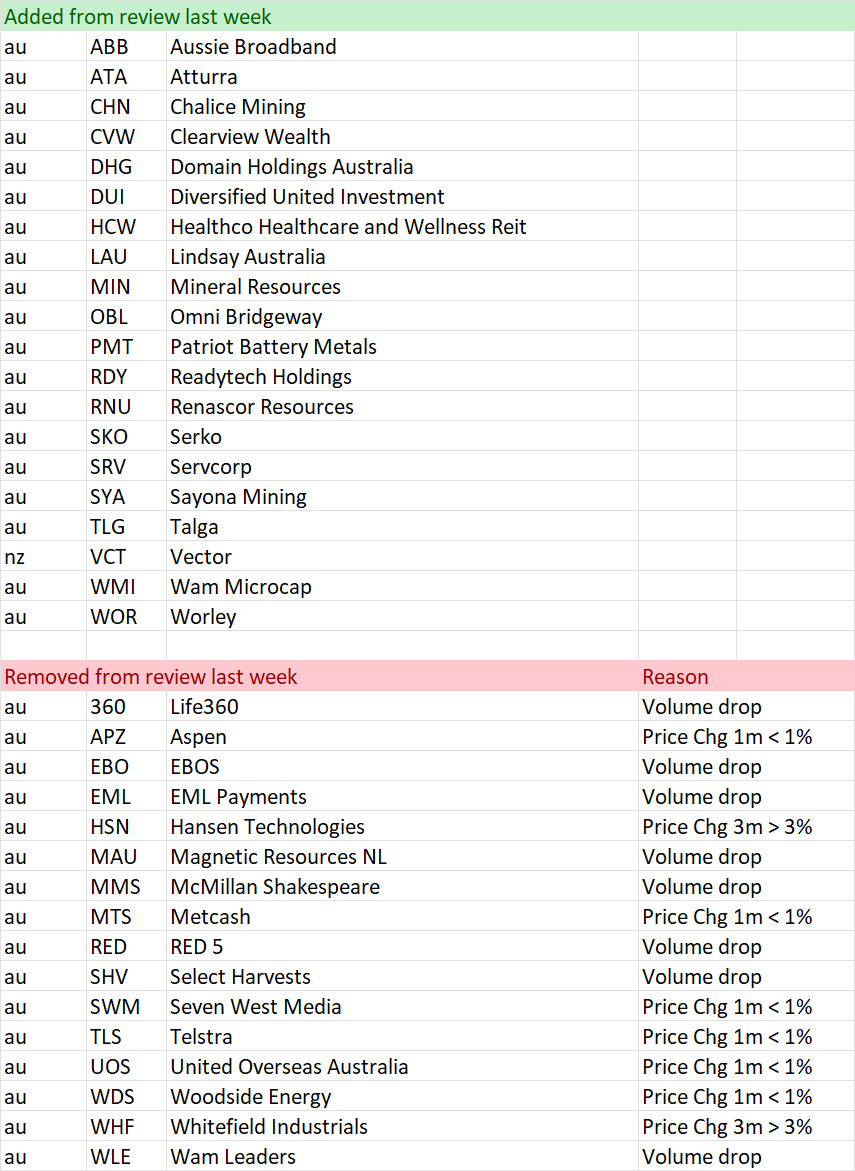
“Pulling out of the station” on 17 February
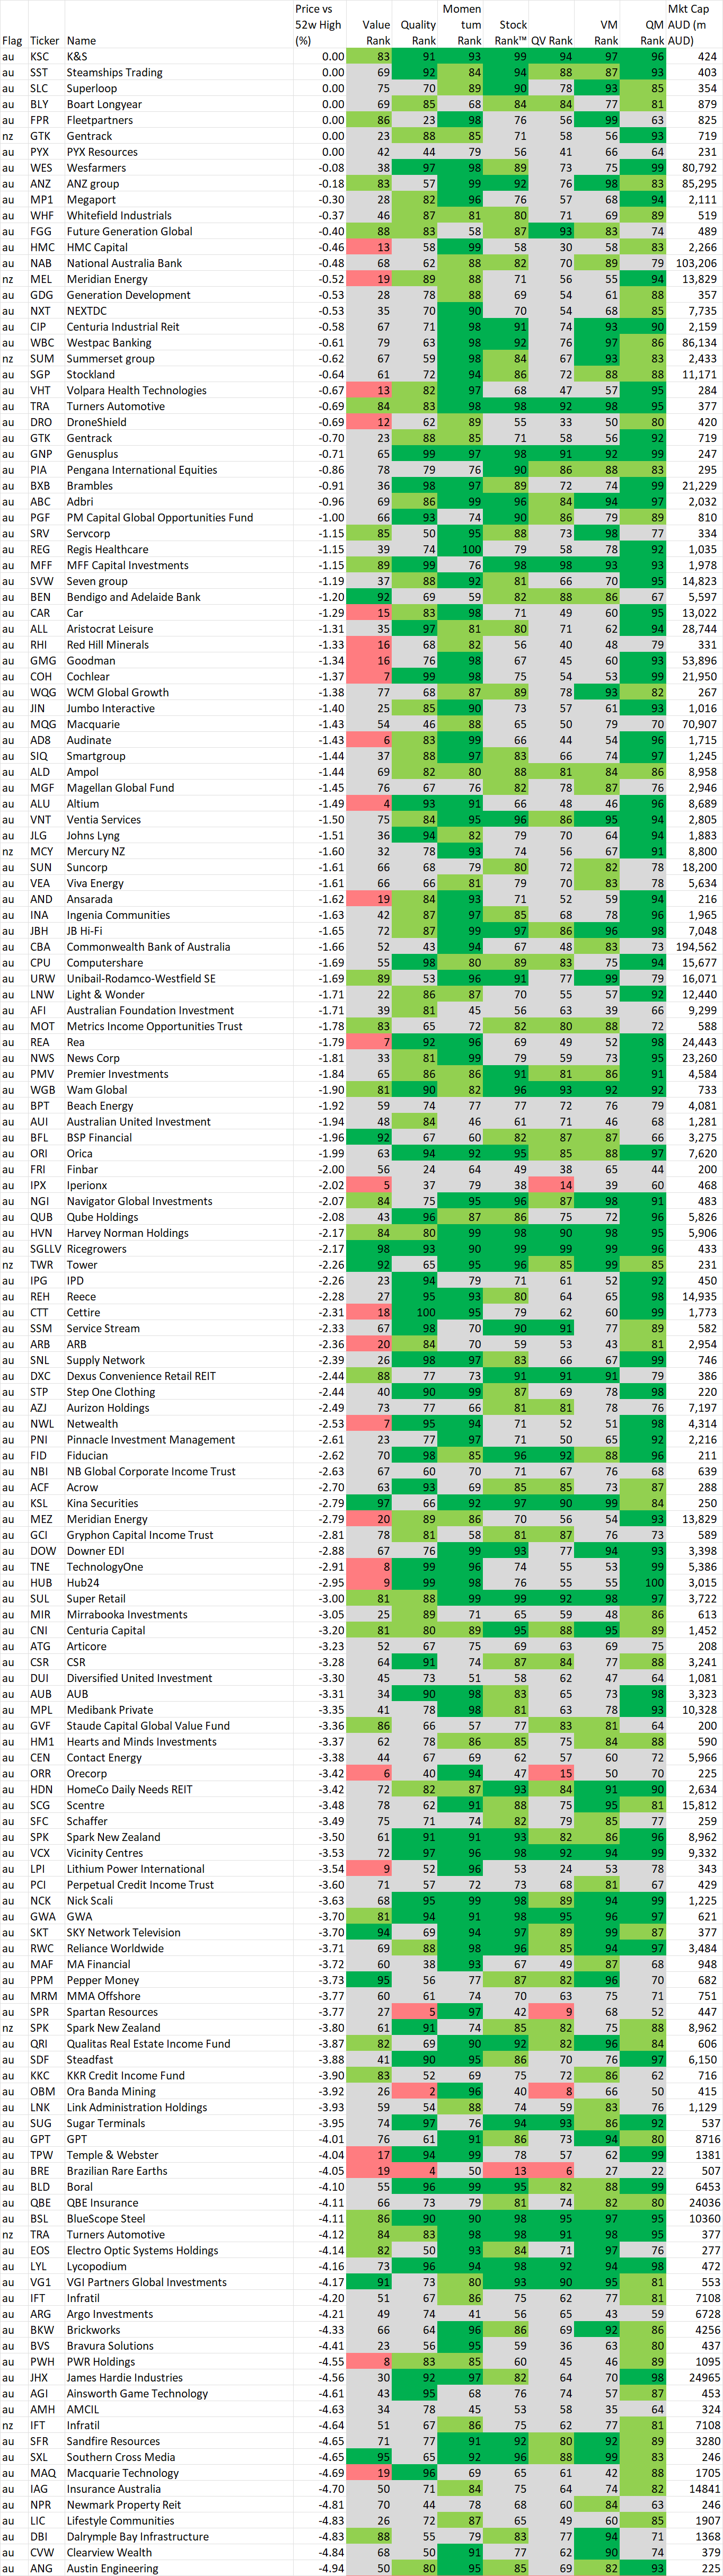
52 week high screen
In this section we identify stocks within 5% of their 52 week intraday high based on the idea, supported by academic studies, that stocks close to their 52 week highs tend to outperform. Weekly changes to the list will also be noted.
If you wish to recreate this screen in the screener select "Price vs 52 high" greater than -5% and Mkt Cap greater than $200M
A stock coming onto the list is NOT an automatic buy, just as a stock that leaves the list is NOT an automatic sell. As with the shine list, assess every chart on its merits. However movements on this list may alert you to interesting charts so be sure to look at Stockopedia and the chart first.
Data is at 17 February and is sorted by the stocks closest to their 52 week intraday high.
Also look at the market capitalisation and liquidity before making any decisions!
And remember, past performance is no guarantee of future performance.
Changes from last week
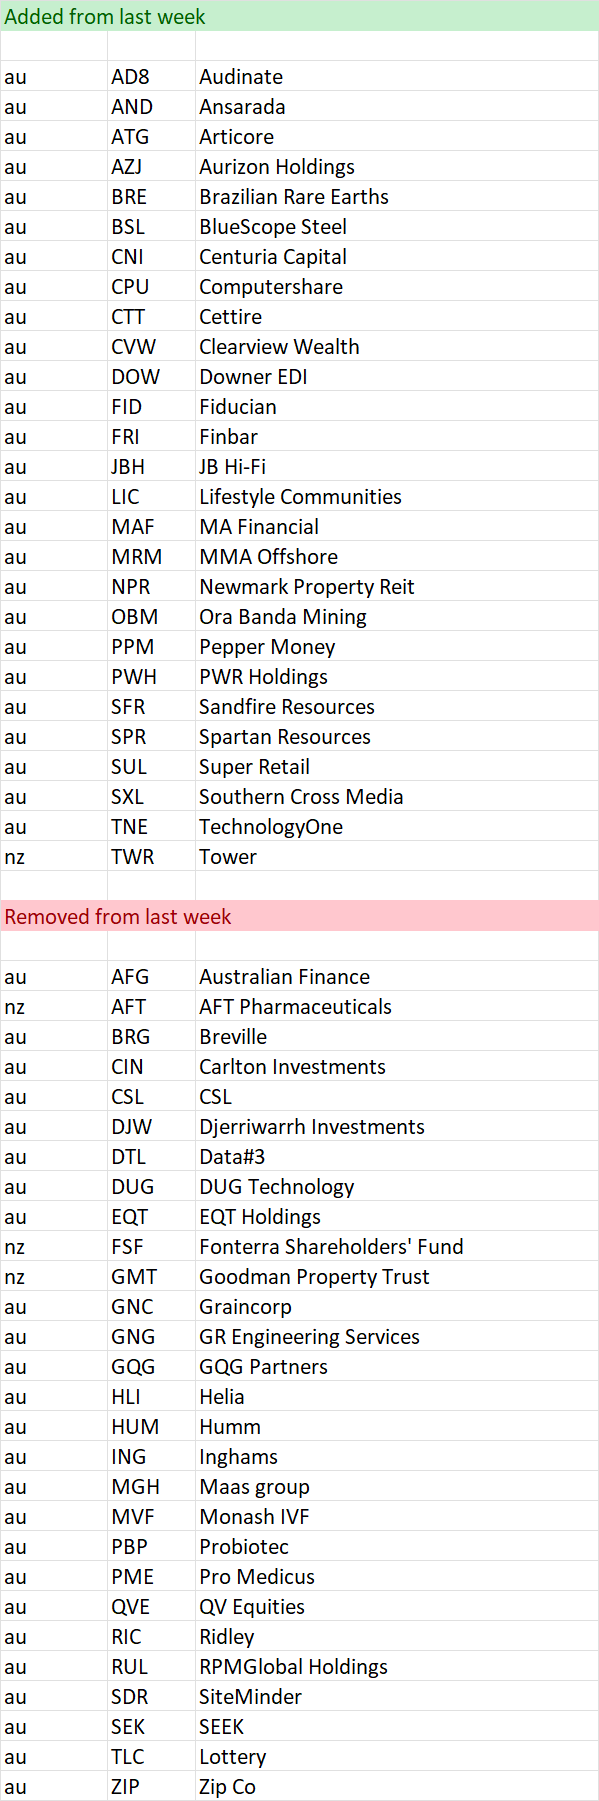
Stocks within 5% of their 52 week high as at 17 February
Important Information: Stockopedia Ltd ABN 39 757 874 670 UK business registration number 0637267 (“Stockopedia”) is an Authorised Representative of Daylight Financial Group Pty Ltd ABN 77 633 984 773 (“DFGPL”) which is the holder of an Australian Financial Services Licence (AFS Licence No. 521404).
Information in this commentary is current as at date prepared unless otherwise stated. However, please bear in mind that investments can go up or down in value, and that past performance is not a reliable indicator of future performance. For more Important Information please refer to the Disclaimer section of this website.
This communication may contain general financial product advice. It has been prepared without taking into account your personal circumstances, and you should therefore consider its appropriateness in light of your objectives, financial circumstances and needs before acting on it.
If our advice relates to the acquisition or possible acquisition of a particular financial product, you should obtain a copy of and consider the Product Disclosure Statement (PDS) before making any decision.
The author holds interests in AD8 and other companies listed in the data tables . This position can and will change at any time without notice.
Disclaimer
This is not financial advice. Our content is intended to be used and must be used for information and education purposes only. Please read our disclaimer and terms and conditions to understand our obligations.
1 comment
Hi Elio, if you have time, I'd be interested in your thoughts on SHAPE Australia (ASX:SHA) , DGL (ASX:DGL) and Environmental (ASX:EGL) from a momentum perspective. Looking at some small caps at the moment as I've heard a few fund managers say that they think they could be in for a good year.