Momentum Monday 19th August 2024

Welcome to Momentum Monday.
Well last week was fun. Our “correction of all ages” hasn’t eventuated (yet) and we carry on. Does this mean it will never happen? Of course not. Just stop trying to predict it? (BTW I am talking to market commentators and the Financial Press more than I am to you.) To show you how little the world knows of what really drives markets. I heard that one of the reasons for Bitcoin pulled back two weeks ago was fear of a US Recession!!!! Idiots!
Interesting links
This week on Weekend Watchlist run in conjunction with Shares for Beginners, we cover a company that has just reported. It is JBH - JB Hi-Fi. Listen here to the replay
The replay of our latest Investing Mastermind series is now available for members. To listen to a recording click here.
Also last Friday’s Lunch ‘n Learn session is recorded for those that are members and booked a place at the virtual table. If you have not received the replay in your inbox do let us know at support@stokopedia.com.au
It’s the last week that I will remind you of the Investing Newsletter Group. Go to https://www.tinglive.com.au/ to learn more about our gold star rating. Even though we are not a tip sheet, we still rate number #1. So please feel free to forward that link to a friend to “Empower Others”. Then again, if they wouldn’t be interested - then you can’t fix stupid I am afraid. (Please don’t overestimate their intelligence.) To Learn read more here

For any external commentary we make to the broader market, follow us on Social Media Facebook Linkedin Instagram or X (formerly Twitter)
This week’s content is as follows:
Broader market sentiment
Member corner
Stocks in the “Shine Zone” (including changes)
Momentum Movers
52 week high screen (including changes)
A reminder that you don’t have to read all this contribution. Simply scroll to the area of interest.
Broader Market Sentiment
We look at the direction of both the US and ASX markets to gain an understanding of the broader sentiment at the minute. It is important to stress here that I DO NOT use this to time my entry or exit out of stocks. I prefer to use the individual charts of stocks to do that. However I find it useful in helping us determine how aggressive/cautious traders should be in their trading. In short the more positive the broader market is the more risks you can take and vice versa.
US / S&P500
There are a lot of people shaking their heads. I may be one of them. But after the strongest week for the S&P500 since November 2023 and just 2% from all time highs achieved in Mid July, you can be forgiven for assuming the sell off in Early August was a blip on a longer term upward trajectory.

S&P500 Weekly chart
Well that is what the chart is telling us. If I stretch the analogy of landing from Mars one more time, they would seriously be questioning what all the fuss is about.
But for perma-bears out there if you want something to be concerned about, then rarely do such aggressive moves go in a straight line. But I think that masks a more bullish story. Last week I mentioned what heightened volatility could mean. And while there is no change in footing from a graph perspective, the daily noise can become incessant if you listen to it constantly.
This week's strong run is being attributed to Retail sales data released on Thursday (their time) came in much stronger than economists expected, while weekly jobless claims fell the day before. Both offered some evidence that recession fears, which helped spark a global sell-off earlier this month, were overblown. Inflation readings released earlier this week also bolstered hopes that a soft landing scenario was still possible.
And let’s face it. There were ‘fears’ of a recession. Particularly when investors feared the Federal Reserve was too late to cut interest rates and the economy was therefore slipping. A hedge fund Japanese currency trade unwind added to the market volatility. But all this is now forgotten it would appear. Especially as a survey from the University of Michigan showed that consumer sentiment rose more than expected.
All this market activity occured in an environment of increased geopolitical uncertainty internationally and domestically reminding us that such matters can be blamed from time to time, but they should not be relied upon.
Earnings season continues in earnest over there. Though the majority of the S&P500 have reported, there will be a range of reports that will add weight to the consumer story in Target, Macy’s and Lowe’s. While normally not that interesting, given the consumer led route a few weeks ago, they can't be ignored.
There is due to be Iranian retaliation this week for an attack on its sovereign land. I don't believe that has happened yet and talk is that a cease fire in the region may be due soon and that saw oil fall for the day. But it was still up for the week. Most other commodities, including Iron Ore, are linked more to the issues in China and there are not likely to be resolved soon, though they are well covered.
I also noticed that Gold hit an intraday high last Friday and this has been interesting because the precision metal normally has an inverse relationship with the USD, but that continues to be quite strong. Though it did weaken a bit, especially as the Japanese Central Bank lifted rates from Zero percent to 0.25% and subsequently apologised in typical Japanese fashion for having to do so. Anyway, I think this disconnect will continue to occur for some time as the uncertainty discussed is yet to find a solid footing. In response to all this I say “why fight city hall?”
In summary, I can find plenty of reasons why the market should not be at these levels, but here we are. So who is wrong? Who cares? I maintain my view that I will remain aggressive in global markets for as long as the index stays above 4967 and a timely reminder. This is not designed to be an in/out of the market indicator trying to pick tops and bottoms. Rather it purely frames thinking. And for now we are still aggressive with global markets and our stocks.
AUS S&P/ASX200
A week certainly is a long time in investing. Basically all of what was lost last week was gained this week on the S&P/ASX200. In fact if looked at very closely, you will see that we have only finished 0.5 points from our weekly all time high achieved a few weeks ago.

S&P/ASX200 Weekly chart
But the world was falling in on our heads right? I think I have explained why I look at weekly charts when garnering sentiment. Even the thickest of individuals will now have this week to further prove it to them. Does this mean we are clear of the woods? That we can’t have a major correction sooner (or later)? Of course it doesn’t. But if I listened to all the commentary I would have slashed my wrists, let alone sold stock. Rather, this week I experienced big gains (at least on paper) and it was nothing other than staying of course the chart said to stay in, and also being aggressive on some big pullbacks when the fundamentals don’t suggest it.
But I will always remember this quote from an old stock dog…. “It’s never a win till it's off your HIN” so perhaps I won’t crack the champagne out just yet…
That said you can see why I get so mad at those that pontificate. Not because they are? But because they are often wrong. If it was so easy as ringing a bell,then we would never have a crash because everyone sees it coming. Rather it's when no one sees it coming that we are most at risk. And those that tread their own path are rewarded.
The macro news this past week was a strong set of employment numbers that drove the market. And as I have shared in this and in many past lives….when you have an employed consumer then you are fine. That said, I noticed that Governor Bullock has said that interest rates won’t be coming down this year because inflation is sticky. I say, “Never say never” when it comes to markets and the factors that drive them. Her predecessor knows better than most.
Of the biggest impact particular to our budget was the price of Iron Ore, which notoriously is hard to pin down, but there is general consensus that it has now well and truly fallen below US$100 per tonne. The Treasury has the price of Iron Ore slumping to US$60 this time this year. Other estimates I have seen are between US$80-US90 either way we know that China has issues with its property market. The issues are relevant because China is our largest trading partner and the property sector historically accounts for 25% - 30% of Chinese GDP. So if there is a prolonged drop off in steel production, there will be more steel mills shut. There will be less demand for iron ore, and therefore the price of the commodity will fall impacting our national prosperity.
But there was a great saying from Nathan Rothschild, A British Financier from the 19th Century, who said the now often made quote, “Buy when there is blood in the streets.” And we actually saw a bit of that in another commodity whose troubles have been even more well publicised, in Lithium, when Pilbara Resources purchased Latin Resources for $560M in an all script offer. While some may question the valuation and the diversification out of Pilgangoora, the reality is that if they had made this purchase at the peak in 2023 they would have had to pay a premium on top of the 42 cent share price price. Today, assuming there are no counter offers, they have purchased it for the equivalent of 20 cents per share. At a minimum a greater than 50% discount. Time will tell whether they are correct in doing so or not.
Last week, reporting season kicked off and the best way to describe it to date is “it could have been worse.” This is the exact place you want to be from a traders perspective because it means that things are “predictable”. Results are predictable. Price moves are predictable, It really hots up next week though, particularly when looking at the constituents of the S&P/ASX200. So don’t rest on your laurels. That said you will need to be quick to seize on any short term opportunities at the moment, because the aggressive nature of the market means that good results that are sold off are getting snapped up accordingly. But good, bad or indifferent. If the sentiment is good then seize the opportunity I say. Just be careful around stocks paying a dividend. This may result in a short term drop in price, but if it is any good as business. It should bounce back.
So after the fun and frivolity of last week. The 7547 level wasn’t breached back then all the above aside. Therefore I remain aggressive in the market, but remain alert (as I always should be as a Momentum Investor because who knows what comes next)..
Member corner
In this section we will provide a detailed chart assessment, on a maximum of ten stocks weekly, on companies from those of you in the Gallery.
We welcome stock requests to be analysed from members. We will also be looking at the charts of some of the more actively researched stocks for the week. We will try to rotate through a selection so as to not make the charts stale, however we will likely not cover a stock within 2 months of when it was last discussed.
If you want to see what has been written about a stock recently, go to the discussion area.

We will not be making up suggestions. If there are no changes to the most viewed list and/or there are no suggestions from members, then no stocks will be covered.
To learn of the methods used to analyse companies in this section, refer to my Momentum Journey series that I articulate here in three parts.
They will help provide context on what I am writing about and the editorial angle of this report.
Also look at the market capitalisation and liquidity before making any decisions!
And again, if you have a stock you would like analysed from a momentum perspective, please write it into the comments section below or email us at support@stockopedia.com.au
IF NO ONE ASKS… HOW AM I SUPPOSED TO KNOW?!?
ASX:JBH JB Hi-Fi
StockRank 98
Momentum Rank 99
QM Rank 99
VM Rank 92
A$77.39
We recently received the results for JB Hi-Fi (ASX:JBH) . They were also the topic of discussion in the recent Weekend Watchlist that investors can listen to here. However from a Momentum perspective they were last discussed at the start of this calendar year and you can read the commentary here.

ASX:JBH 1 year Daily chart
Way back then I said I was hoping for a retrace to the $46 - $49 range. It only pulled back to $55. I also said that “a break into all-time highs can't be ignored and if it gets there we will reassess.” It did that the next month. Since then a series of higher highs have supported the trend, and though it created a new short-term lower low in May, it actually stayed above the low of February and it became short-term support for the price.
Following the E&S acquisition and solid dividend, now that it trades at all time highs the question is, “what do we do now”?
Readers will know my perspective on patience and gaps. Therefore I would wait until the price retraces back to the $68 mark (or there abouts) before considering a nibble. If I do then my short-term stop becomes $60.81. Longer term, that level of prior support has to be monitored. Though the drawdown may be significant from here,the stock has a history of having a broader support level. It did so in the late 2010’s, then again in 2022-23. Therefore if it doesn’t exhibit support then one could be worried.
But it is trading at all time highs despite the revenue drop off. I then remember the old adage, “Think less, make more money.” Shame I didn’t remember it here.
ASX:BHP BHP Limited
StockRank 81
Momentum Rank 60
QM Rank 73
VM Rank 78
A$40.01
It’s time again to cover one of the biggest stocks on our market. It is BHP (ASX:BHP). Out of interest if you want to read what was said about it most recently from a Momentum perspective read it here.

ASX:BHP 1 year Daily chart
The comment was a continuation of the bearish sentiment and it was noted that the price was at the lower end of the channel than the top.
Looking at it today, the continued fall in Iron Ore prices below $100 US per tonne, plus the other cuts to revenue generating activity such as Escondida Union issues and shutting down the West Australian Nickel shut down, has seen the price of BHP fall. Its in a downtrend now following the lower highs and lower lows and therefore remains an avoid. From this point the price has to stop falling and retrace above $46.24 before I look at it again.
ASX:AGL AGL Energy
StockRank 98
Momentum Rank 99
QM Rank 90
VM Rank 99
A$11.77
Despite its size and its coverage in the press, this will be the first time that we look at AGL Energy (ASX:AGL) from a momentum perspective.

ASX:AGL 1 year Daily chart
I will start with the bleeding obvious, the stock is in a short term uptrend. The 50D MA is above the 200D MA and both are headed in the right direction. Its at 52 week highs, and there have been a series of short-term higher highs and higher lows.
But then I expand the chart and what I see is stock that has been in a downtrend since it peaked in 2017. Though more recently than that, the Cannon-Brookes saga in 2022 saw a new lower high established before the continued sell down. Therefore in my view this level (and time) is quite significant and the price is recovering and has nearly got back to that point which is $12.27.

ASX:AGL 10 year Weekly chart
If the price can cross back above this level, and on its pullback stay above as a bare minimum $7.84 then we could see the start of a very long anticipated turn around in the price of AGL. A fairer level for a possible re-entry will likely be $9.00 - $9.50. However if it gets there it will have crossed below the ATR and depending how quickly it gets there it may be trading below its 200D MA which as a general rule I am not a fan of. Therefore a position in this company will be based on your fundamental perception of the business moving forward, because as of the charts it is a little difficult to pick right now. But for the first time ina long time, it is showing signs of life.
ASX:MMS - McMillan Shakespeare
StockRank 69
Momentum Rank 52
QM Rank 64
VM Rank 69
A$17.29
We have preferred the other leasing businesses to McMillan Shakespeare (ASX:MMS) and therefore it may not come as a surprise that we last assessed their momentumprospects over One year ago (You can read that commentary here.)

ASX:MMS 1 year Daily chart
It's been one helluva ride since then with some extreme volatility making this a good trading stock. I said at the time there wasn’t a single trading indicator known to man that wouldn’t have the stock as a “Buy” at that time. I also said, “a stop would be appropriate at $15.12 if recently purchased. $12.76 would be appropriate if you have held them earlier post the COVID crunch.”
The price though went up after the commentary by an extra $6 so in effect that was all rendered useless.
Though a few other interesting things happened.
The price spiked in August 2023 and then came back straight down. This is a huge risk whenever a price goes parabolic (particularly in a large cap stock) one has to be very careful.
The spike got tested again in early 2024 but the price failed to cross above it. Again a timely reminder of how stocks trading at significant levels should be respected. The subsequent failure of two attempts now means that level is a resistance level.

ASX:MMS 2 year Daily chart
The gap created in February 2024 was eventually filled a few months later
A level of support is the top end of the previous channel (in my view), but if you are a short-term trader then assuming it holds $16.10 that is good in my view
Ignoring the big levels of resistance and of support, the stock is in an uptrend as a series of higher lows should provide some comfort. This could all change based on their upcoming report, meaning while “you won’t have to wait long to know if you are wrong”, a bad report could see the price smash below it (and vice versa if it is a good report.)
Long story short, in my view with MMS at the moment, it is in an uptrend but I would take some profits at $22 if it got there. Preferably I want it to hold $16.10. All bets though will be off if it crosses below $14.80. Perhaps waiting for the company to report may help manage some of the risk? But if you want to trade such a volatile price sometimes you have to be ready to take a losing side.
Stocks in the Shine Zone
To learn about the Shine Zone and how to use it, you can read it here.
The rules for inclusion in this list are based on those I like to see in a stock before considering a trade in it:
QM Rank above 80
Price is above the 2.5x ATR
50d MA is above the 200d MA
Price is greater than the 200d MA
Market cap greater than $200M
This is a very important point: the “Shine Zone” are rules for possible buying. They are not for holding and/or selling. If a stock falls out of the shine zone, use support levels to set your stops, or instigate a parachute stop if necessary. With markets moving sideways, one expects frequent changes in these lists.
If you feel there is a stock that should be included but is missing please let us know. This is a manual process and occasionally one gets through the cracks
Also look at the market capitalisation and liquidity before making any decisions!
Data is at 19 August and is sorted by the stock code.
Changes from last week
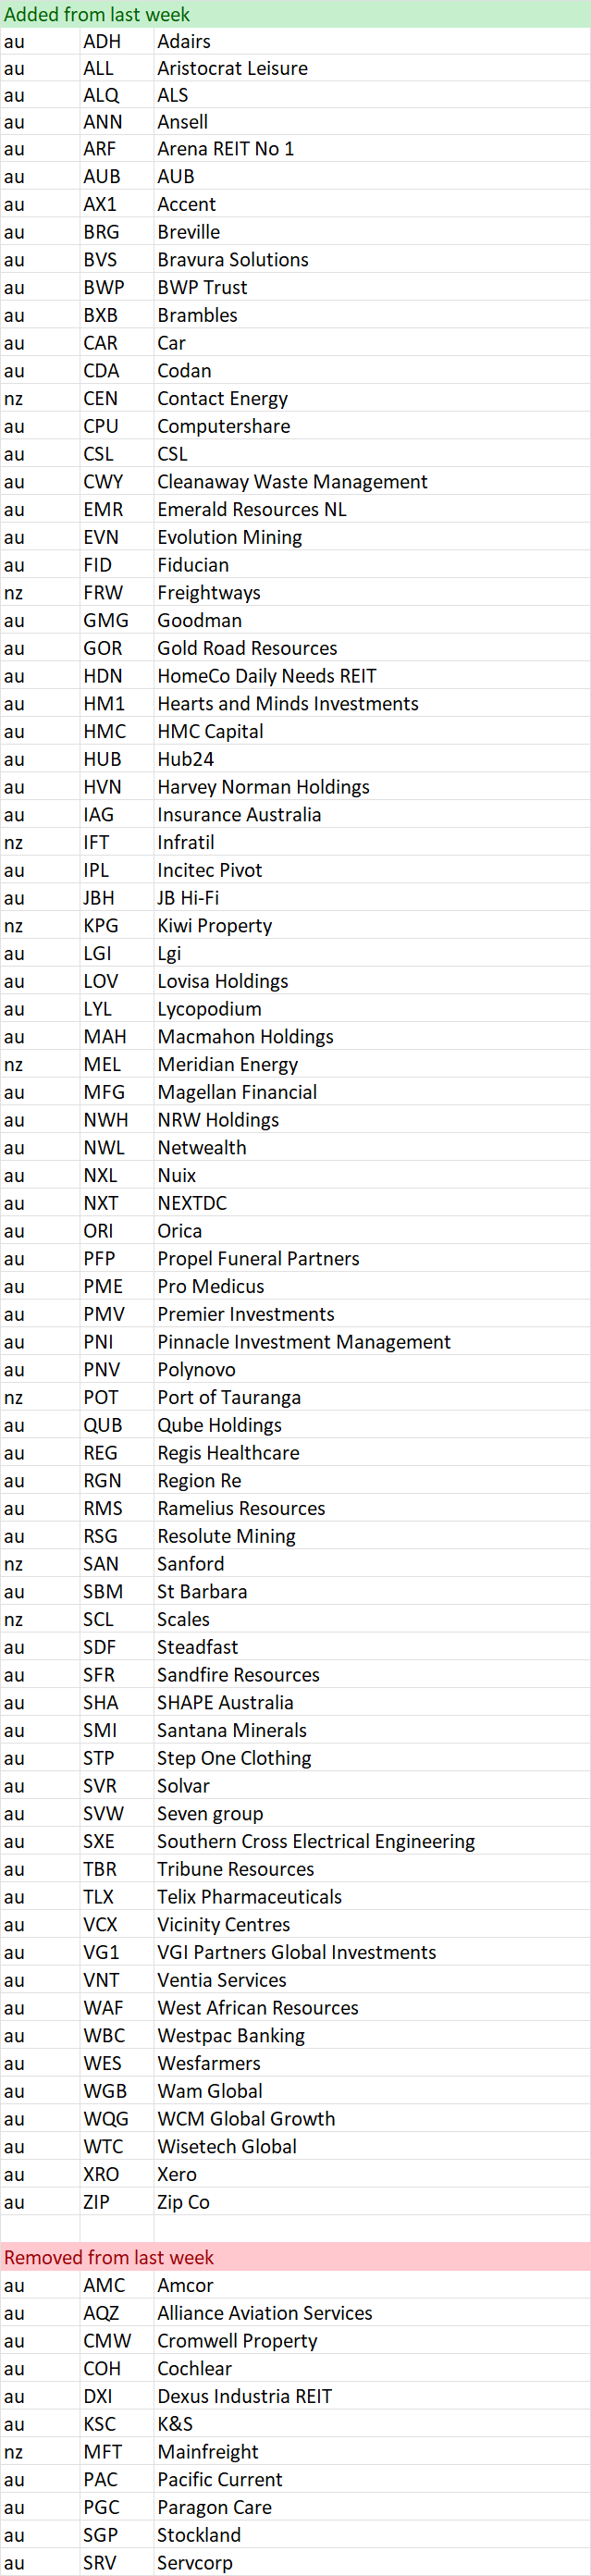
Shine Zone list as at 19August

Momentum Movers
I have actually published an article discussing my thinking with these tables. You can read about it here.
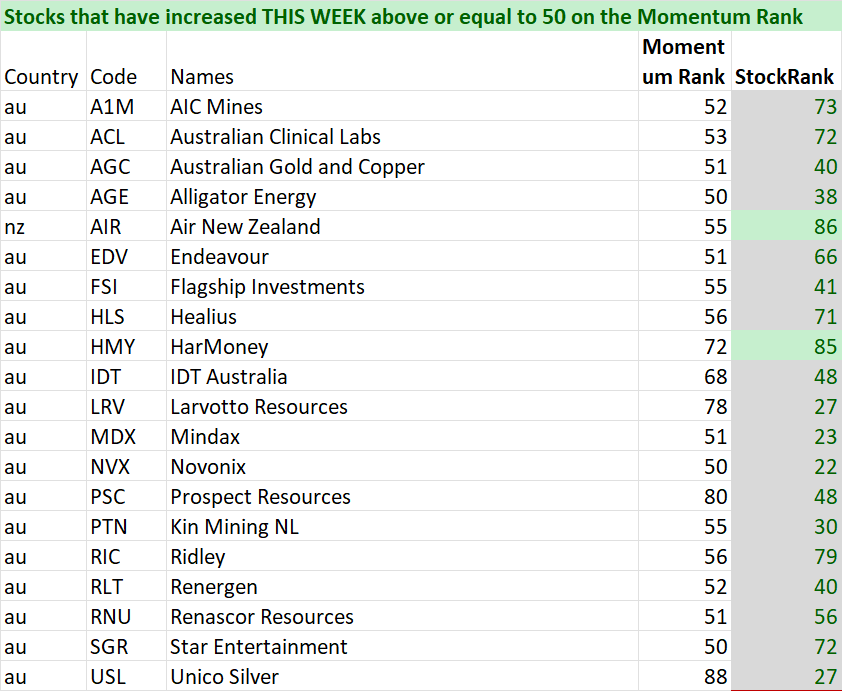
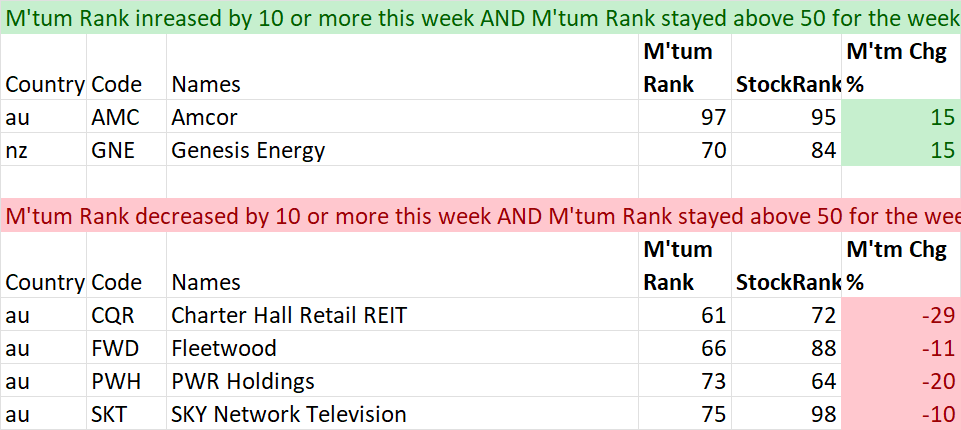
In summary, there is a school of thought that the change in something is just as important as the absolute number itself. Momentum is our most volatile ranking. This section is intended to bring to readers attention the big moves from a Momentum Perspective. As with other lists this is not designed to be a list of stocks that are replicated. Rather it can be a starting point of investigation for further consideration. Initially it will record weekly changes. This will include a monthly change when enough time has elapsed. This section is divided into two lists.
First is a list of stocks that have just crossed above 50 from a Momentum perspective. By definition, these will be stocks that have improved over the past week and month and may warrant further investigation. As a bare minimum a look at liquidity and market cap.
The second list measures all stocks that are currently ranked above 50, have remained above 50 during the time periods analysed (ie not just added or removed) AND whether they have improved or worsened by more than 10 points on the Momentum Rank.
With all filters a minimum market cap of $50 Mil has been included to help ensure investability from a small perspective. Be sure to check liquidity relative to your preferences.
As this is a new list we welcome any feedback you may have. If we have missed anything do let us know.
Data is at 19 August and is sorted by their code.
And remember, past performance is no guarantee of future performance.
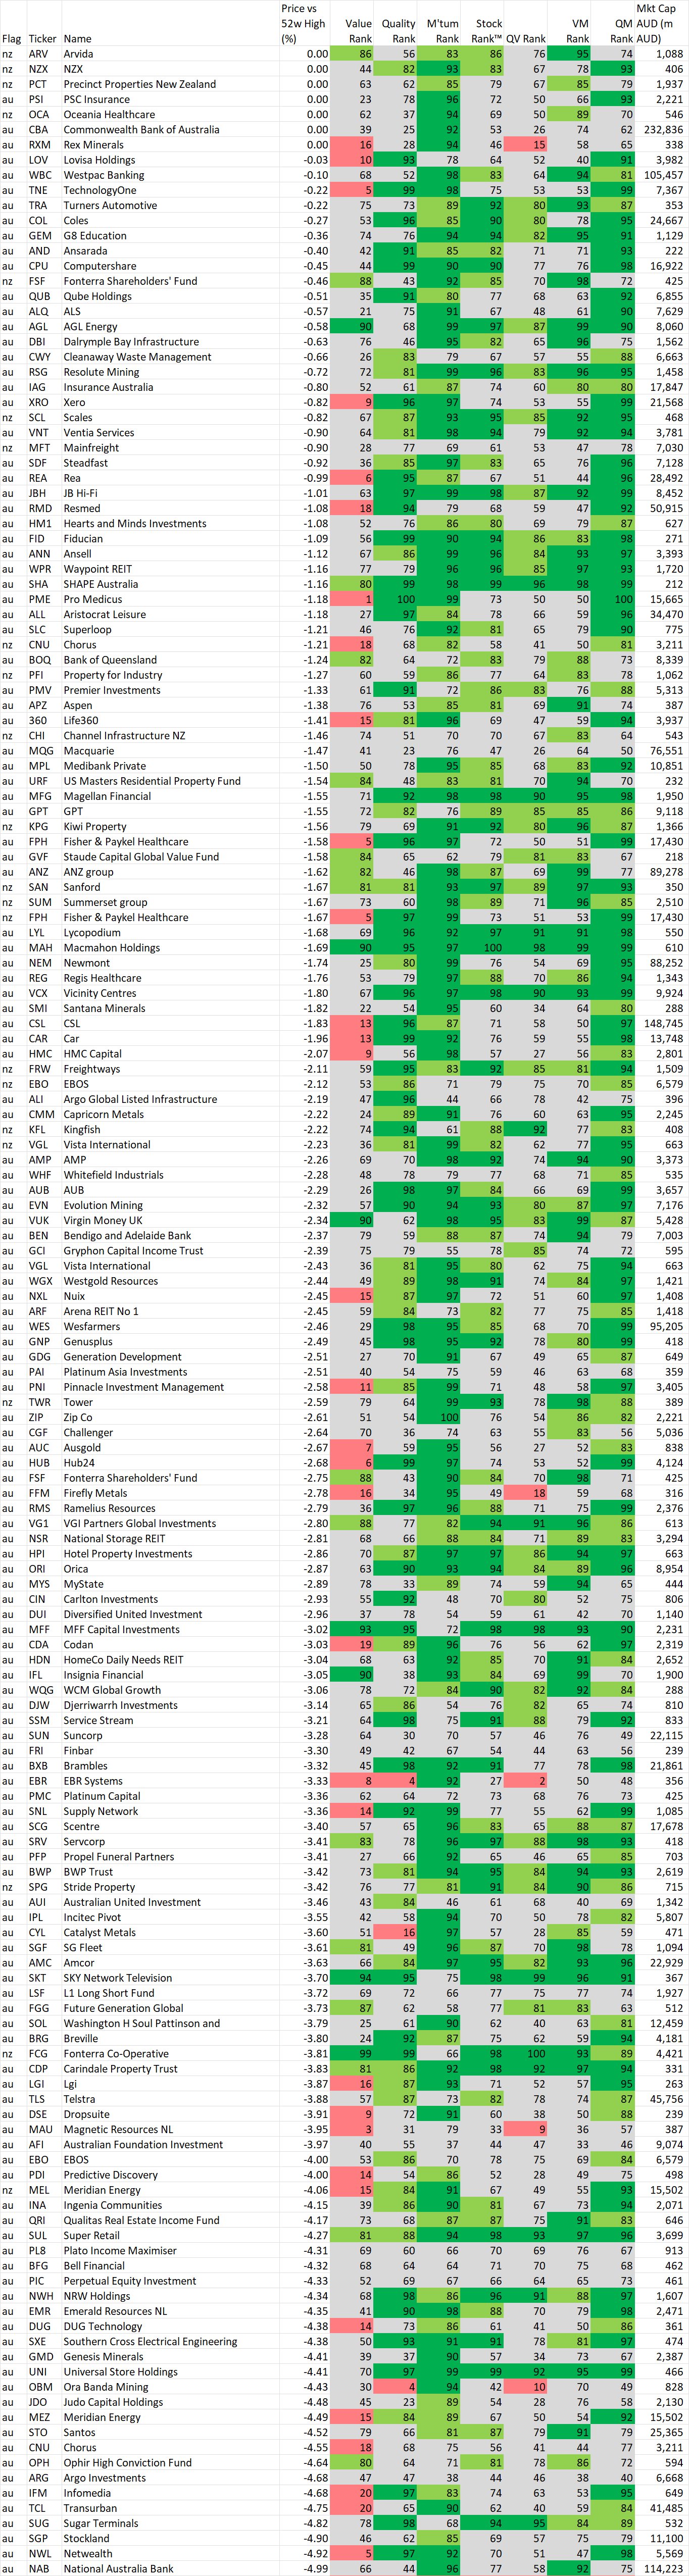
52 week high screen
In this section we identify stocks within 5% of their 52 week intraday high based on the idea, supported by academic studies, that stocks close to their 52 week highs tend to outperform. Weekly changes to the list will also be noted.
If you wish to recreate this screen in the screener select "Price vs 52 high" greater than -5% and Mkt Cap greater than $200M
A stock coming onto the list is NOT an automatic buy, just as a stock that leaves the list is NOT an automatic sell. As with the shine list, assess every chart on its merits. However movements on this list may alert you to interesting charts so be sure to look at Stockopedia and the chart first.
Data is at 19 August and is sorted by the stocks closest to their 52 week intraday high.
Also look at the market capitalisation and liquidity before making any decisions!
And remember, past performance is no guarantee of future performance.
Changes from last week
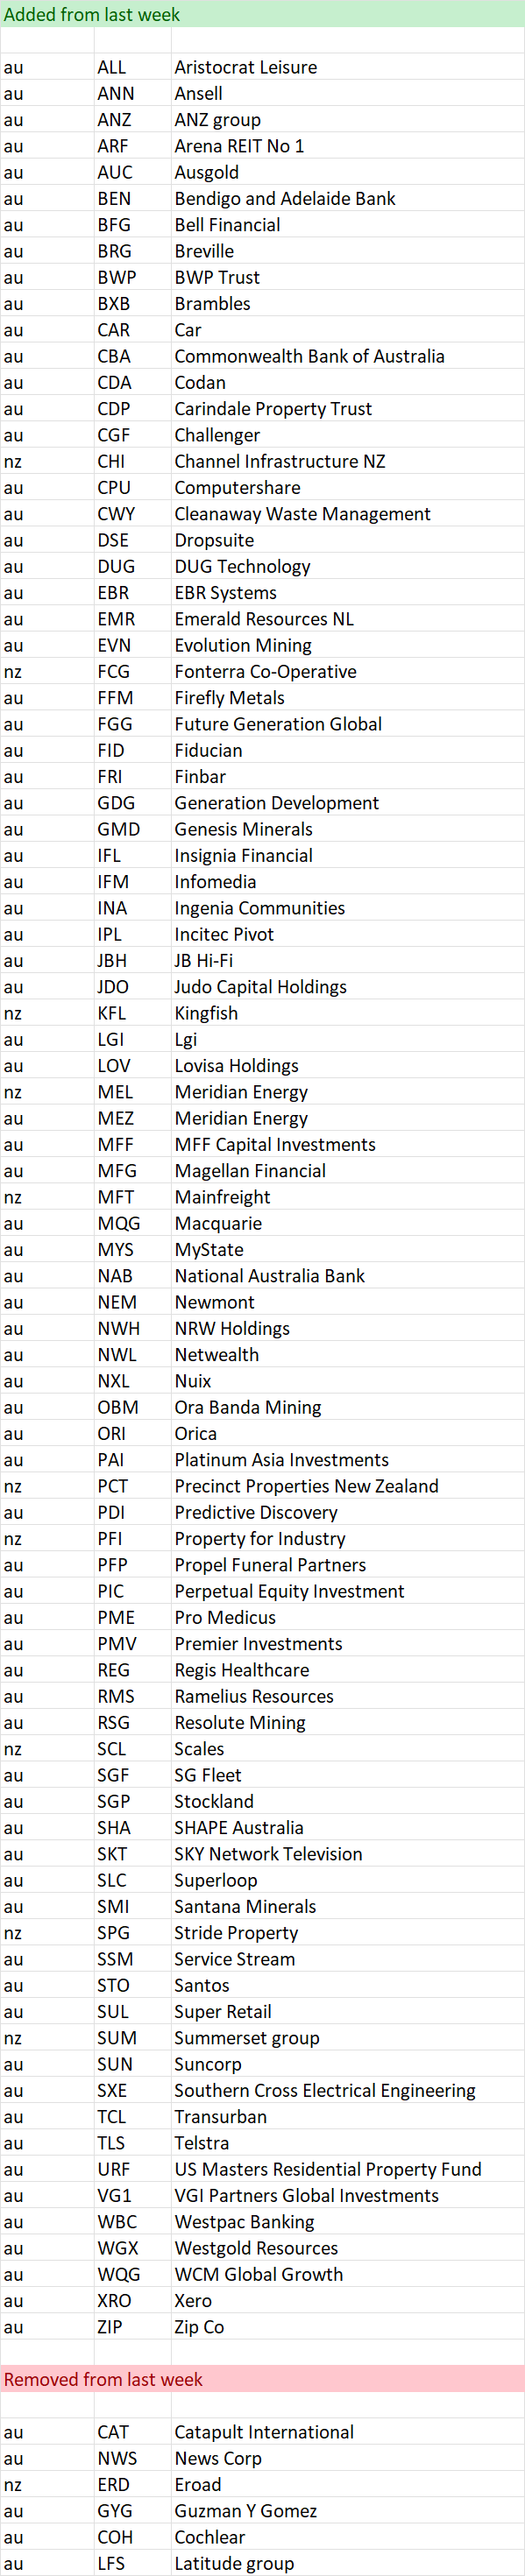
Stocks within 5% of their 52 week high as at 19 August
Important Information: Stockopedia Ltd ABN 39 757 874 670 UK business registration number 0637267 (“Stockopedia”) is an Authorised Representative of Daylight Financial Group Pty Ltd ABN 77 633 984 773 (“DFGPL”) which is the holder of an Australian Financial Services Licence (AFS Licence No. 521404).
Information in this commentary is current as at date prepared unless otherwise stated. However, please bear in mind that investments can go up or down in value, and that past performance is not a reliable indicator of future performance. For more Important Information please refer to the Disclaimer section of this website.
This communication may contain general financial product advice. It has been prepared without taking into account your personal circumstances, and you should therefore consider its appropriateness in light of your objectives, financial circumstances and needs before acting on it.
If our advice relates to the acquisition or possible acquisition of a particular financial product, you should obtain a copy of and consider the Product Disclosure Statement (PDS) before making any decision.
The author holds direct interests in JBH - JB Hi-Fi and companies listed in the data tables . This position can and will change at any time without notice.
Disclaimer
This is not financial advice. Our content is intended to be used and must be used for information and education purposes only. Please read our disclaimer and terms and conditions to understand our obligations.
No comments yet
No one has commented here yet! Why not be the first one?