Momentum Monday 1st May

Welcome to the new and revamped Momentum Monday
Here is the format for the revised report:
Broader market sentiment
Member Corner
Stocks in the “Shine Zone”
52 week high screen (including changes)
I will include a description at the top of each section which will highlight the intention and how the information should be digested. Be sure to read them. As always, you don’t have to read everything, just go to the sections that are of interest to you.
Hopefully you enjoy the new format. Be sure to let us know your feedback down below and hopefully we can continue to support those of you that apply a Momentum elemnent to your investing moving forward.
And don’t be shy. Please interact with us. This service will only be as powerful as what you contribute.
Broader Market Sentiment
Here we look at market direction (both in the US and ASX). This is not to determine an entry or exit signal… We should always rely on individual charts of stocks to do that. But rather to understand how aggressive/cautious traders should be when considering individual stocks.
We have split the discussion for each region into Chart sentiment and Macro sentiment so that the two remain separate. We have included discussions around macro sentiment because, rightly or wrongly, they move markets.
S&P500
Chart sentiment
The market finished the week by peeping it head above the HH and therefore our next target is now 4280.
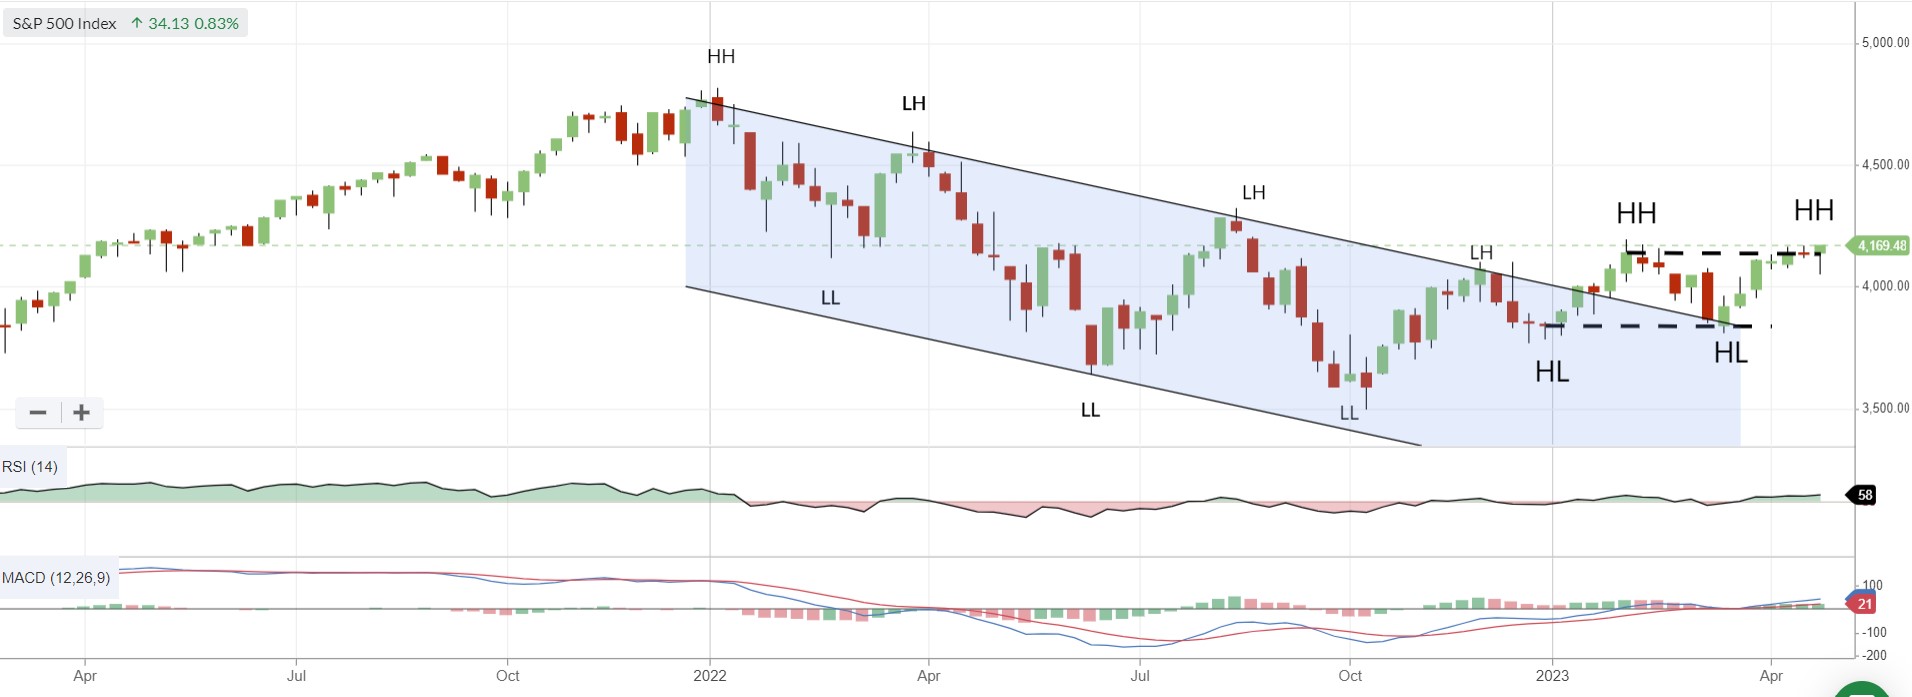
S&P500 Weekly chart
The pleasing thing to note has been that this is now the second short term higher high meaning the index is going on a little gallop and my initial goal of 4180 looks like it will be broken (hopefully). The Weekly RSI is above 50 and MACD is positive.
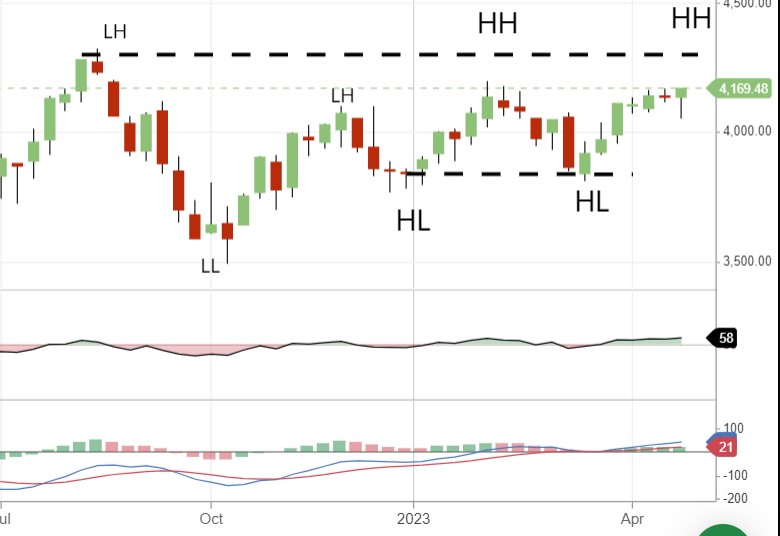
S&P500 Weekly since 1 July 2022
We can buy into global equities with support at 3840.
Macro sentiment
We finished the week with news of another potential Bank Failure in the form of First Republic and the release of another key inflation figure, the personal consumption expenditures index (which excludes food and energy) rose 0.3%. Markets widely expect the Federal Reserve to raise rates another quarter percentage point at next week’s meeting, it will be the tenth rate rise this cycle.
In typical sentiment style however, the market put aside these concerns and the S&P500 rose for both the week and April +0.9% and +1.5% respectively.
Notwithstanding these events, earnings season has been particularly good on low expectations, particularly from the tech sector which obviously makes up a large part of the US Market. We mentioned a few weeks back that earnings season will drive a lot of sentiment and so it has been the case. At the time of writing, some 80% of companies that have thus far reported have beaten expectations, highlighting the low benchmark by analysts this season.
Further there is a growing and strong belief that this will be the last rate rise, before we start to see an easing cycle as higher rates begin to bite. Evidence supporting this view came in the form of a report from the Commerce Department showing the US economy had expanded by 1.1%, rather than the 2% expected.
And remember the old VIX index? - otherwise known as the 'fear' index? That is close to its lowest point in 2023 indicating markets are relatively comfortable of where things are at right now. A pessimist however will view an imminent credit tightening from the fallout in the U.S. banking sector will likely cap economic growth somewhat for the rest of the year. But no one is listening.
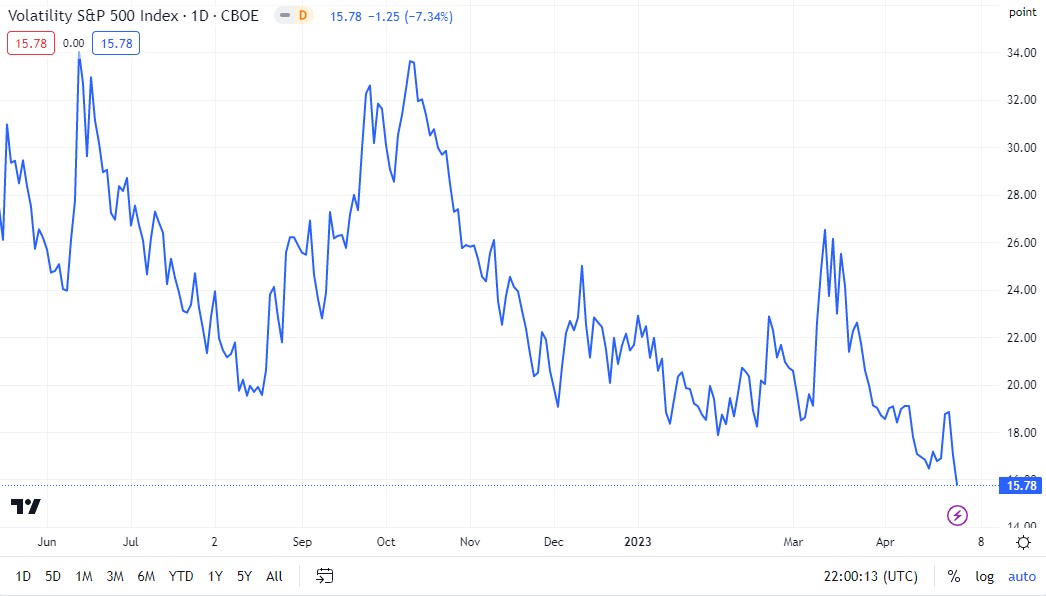
VIX Volatility Index S&P500 CBOE 1 year
Interesting times indeed, however for now the macro issues appear to be under control and are not playing a major role in sentiment for the minute.
S&P/ASX200
Chart sentiment
Despite the strong April performance of 1.8%, this was our second consecutive down week on the S&P/ASX200
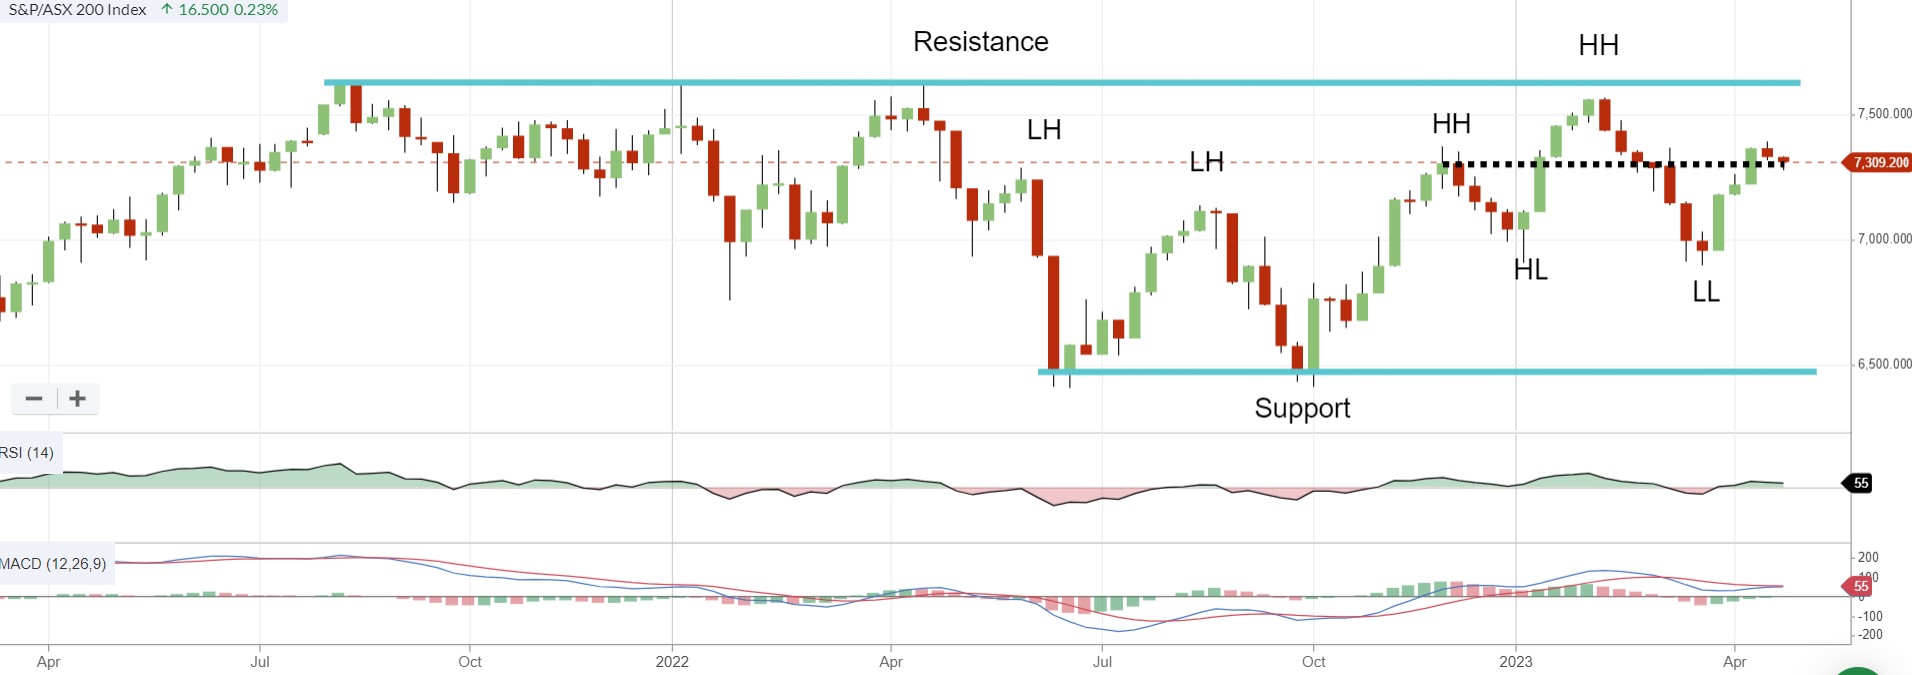
S&P/ASX200 Weekly chart
As discussed last week, the recovery since the terrible February now sees price hovering around November levels. And given by the behaviour of the past two weeks, the market is hanging on for dear life. It does however give the impression it wants to go higher, however with a flat RSI and MACD, the index remains in its range.
The fear of course is that we are starting to see a short term head and shoulders pattern occur which is a reversal pattern. However if that forms, the target price is still above support, providing optimism that the chart is starting to look in our favour,
Holding these levels will likely see a retest of Resistance, a break below and support becomes our next target.
Macro sentiment
This week was dominated by quarterly inflation coming in at 7.0% as opposed to 7.8% in the December qtr. While economists and media analysts were quick to champion this number as a sign that a rate pause can continue when announced tomorrow, the reality is that inflation is cumulative and the rate is still very high.
That said it has created a potential catalyst for markets as economists are now predicting a rate freeze come Tuesday’s rate decision. Whilst a cynic may say, “Of course rates won’t change given the government pressure of the Central Bank at the moment”, we need to accept that the current level is still unacceptable. The obvious risk at the minute is that If there is a rate rise on Tuesday, the market won’t expect it and therefore may cause some short term down move. If they keep rates on hold as expected I don’t see that driving the market.
If commentary from the RBA further suggests inflation concerns are easing then the market should maintain a stable footing, but keep an eye out for margins. As we have talked about on various different forums for a few months and is now evident in recent company updates, the costs of doing business have been rising and that will flow to the bottom line.
Despite all the above, the market rose a very strong 1.8% in April. Our best sector for the month was Industrials, whereas Materials was our worst. This mainly on account of a string of disappointing quarterly reports that all said the same thing: bad weather and staff shortages were impacting production.
Member corner
In this new section we will provide a detailed chart assessment, on a maximum of two stocks weekly, on companies from those of you in the Gallery. If no one asks for a stock to be analysed, this section will remain blank. Also please note, that while we may receive a number more queries than two per week, we retain the right to save a stock for another week, or ignore it all together.
The analysis will be akin to what was covered under the “Stocks of Interest” within the previous Momentum Monday reports.
If you have a stock you would like analysed from a momentum perspective, please write it into the comments section below.
<No requests received from Members this week>
Stocks in the “Shine Zone”
I have articulated my momentum journey in articles that are published within Stockopedia.
There are clear things I like to see in a stock before considering a trade in it:
QM Rank above 80
Price is above the 2.5x ATR
50d MA is above the 200d MA
Price is greater than the 200d MA
For this exercise I have also changed one rule, where I will include stocks with a market cap of $200M or more (this is different from the $500M criteria previously used within the MM report.).
In this section, I will highlight stocks in what I have called the “Shine Zone” and identify weekly changes to the list.
This list has been produced with an element of human assessment ie. looking for a price above the 2.5x trailing stop loss line. Therefore, there is a chance that there may be an error. Should you identify one or notice an omission, please be sure to add it to the comments below. Note: The stock must meet the criteria above.
And some reminders:
I don’t blindly buy on these rules, as I then look for support/resistance levels to identify possible better entries and stop loss levels. I would also look at:
Liquidity
On Balance Volume (OBV) to see if the recent price action is supported by volume.
Direction of the 50 and 200 day moving averages (I prefer to see them rising)
However the preliminary criteria identified above are what shines a light on a stock that I can then put onto my radar for possible consideration from a Momentum perspective. In the spirit of the objectives of Stockopedia, the stocks in this list are not automatic buys.
NOTE: The criteria for the “Shine Zone” are rules for possible buying. They are not for holding and/or selling. There can often be times where I continue to hold a stock, even though one of the rules above have failed. (For example, the price is below the 2.5x ATR but is still above structural support. Please read my Momentum journey to learn more.
On Wednesday I will publish an article explaining how members could approach using the list in the most efficient manner.
Data is at 28 April and is sorted by the stock code.
Changes from last week
N/A as this is our first week
Companies in the Shine Zone as per 28 April 2023 (Sorted by code)
| ||||||||||||||||||||||||||||||||||||||||||||||||||||||||||||||||||||||||||||||||||||||||||||||||||||||||||||||||||||||||||||||||||||||||||||||||||||||||||||||||||||||||||||||||||||||||||||||||||||||||||||||||||||||||||||||||||||||||||||||||||||||||||||||||||||||||||||||||||||||||||||||||||||||||||||||||||||||||||||||||||||||||||||||||||||||||||||||
52 week high screen
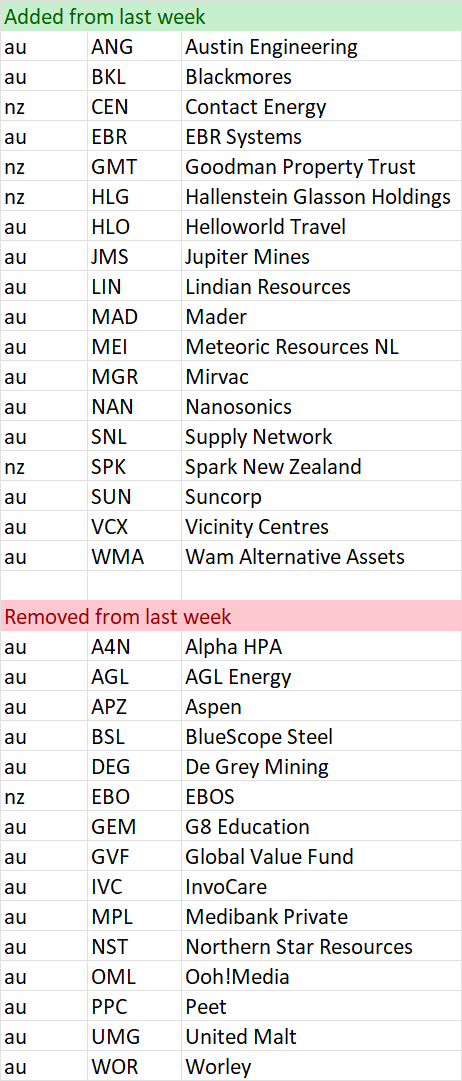
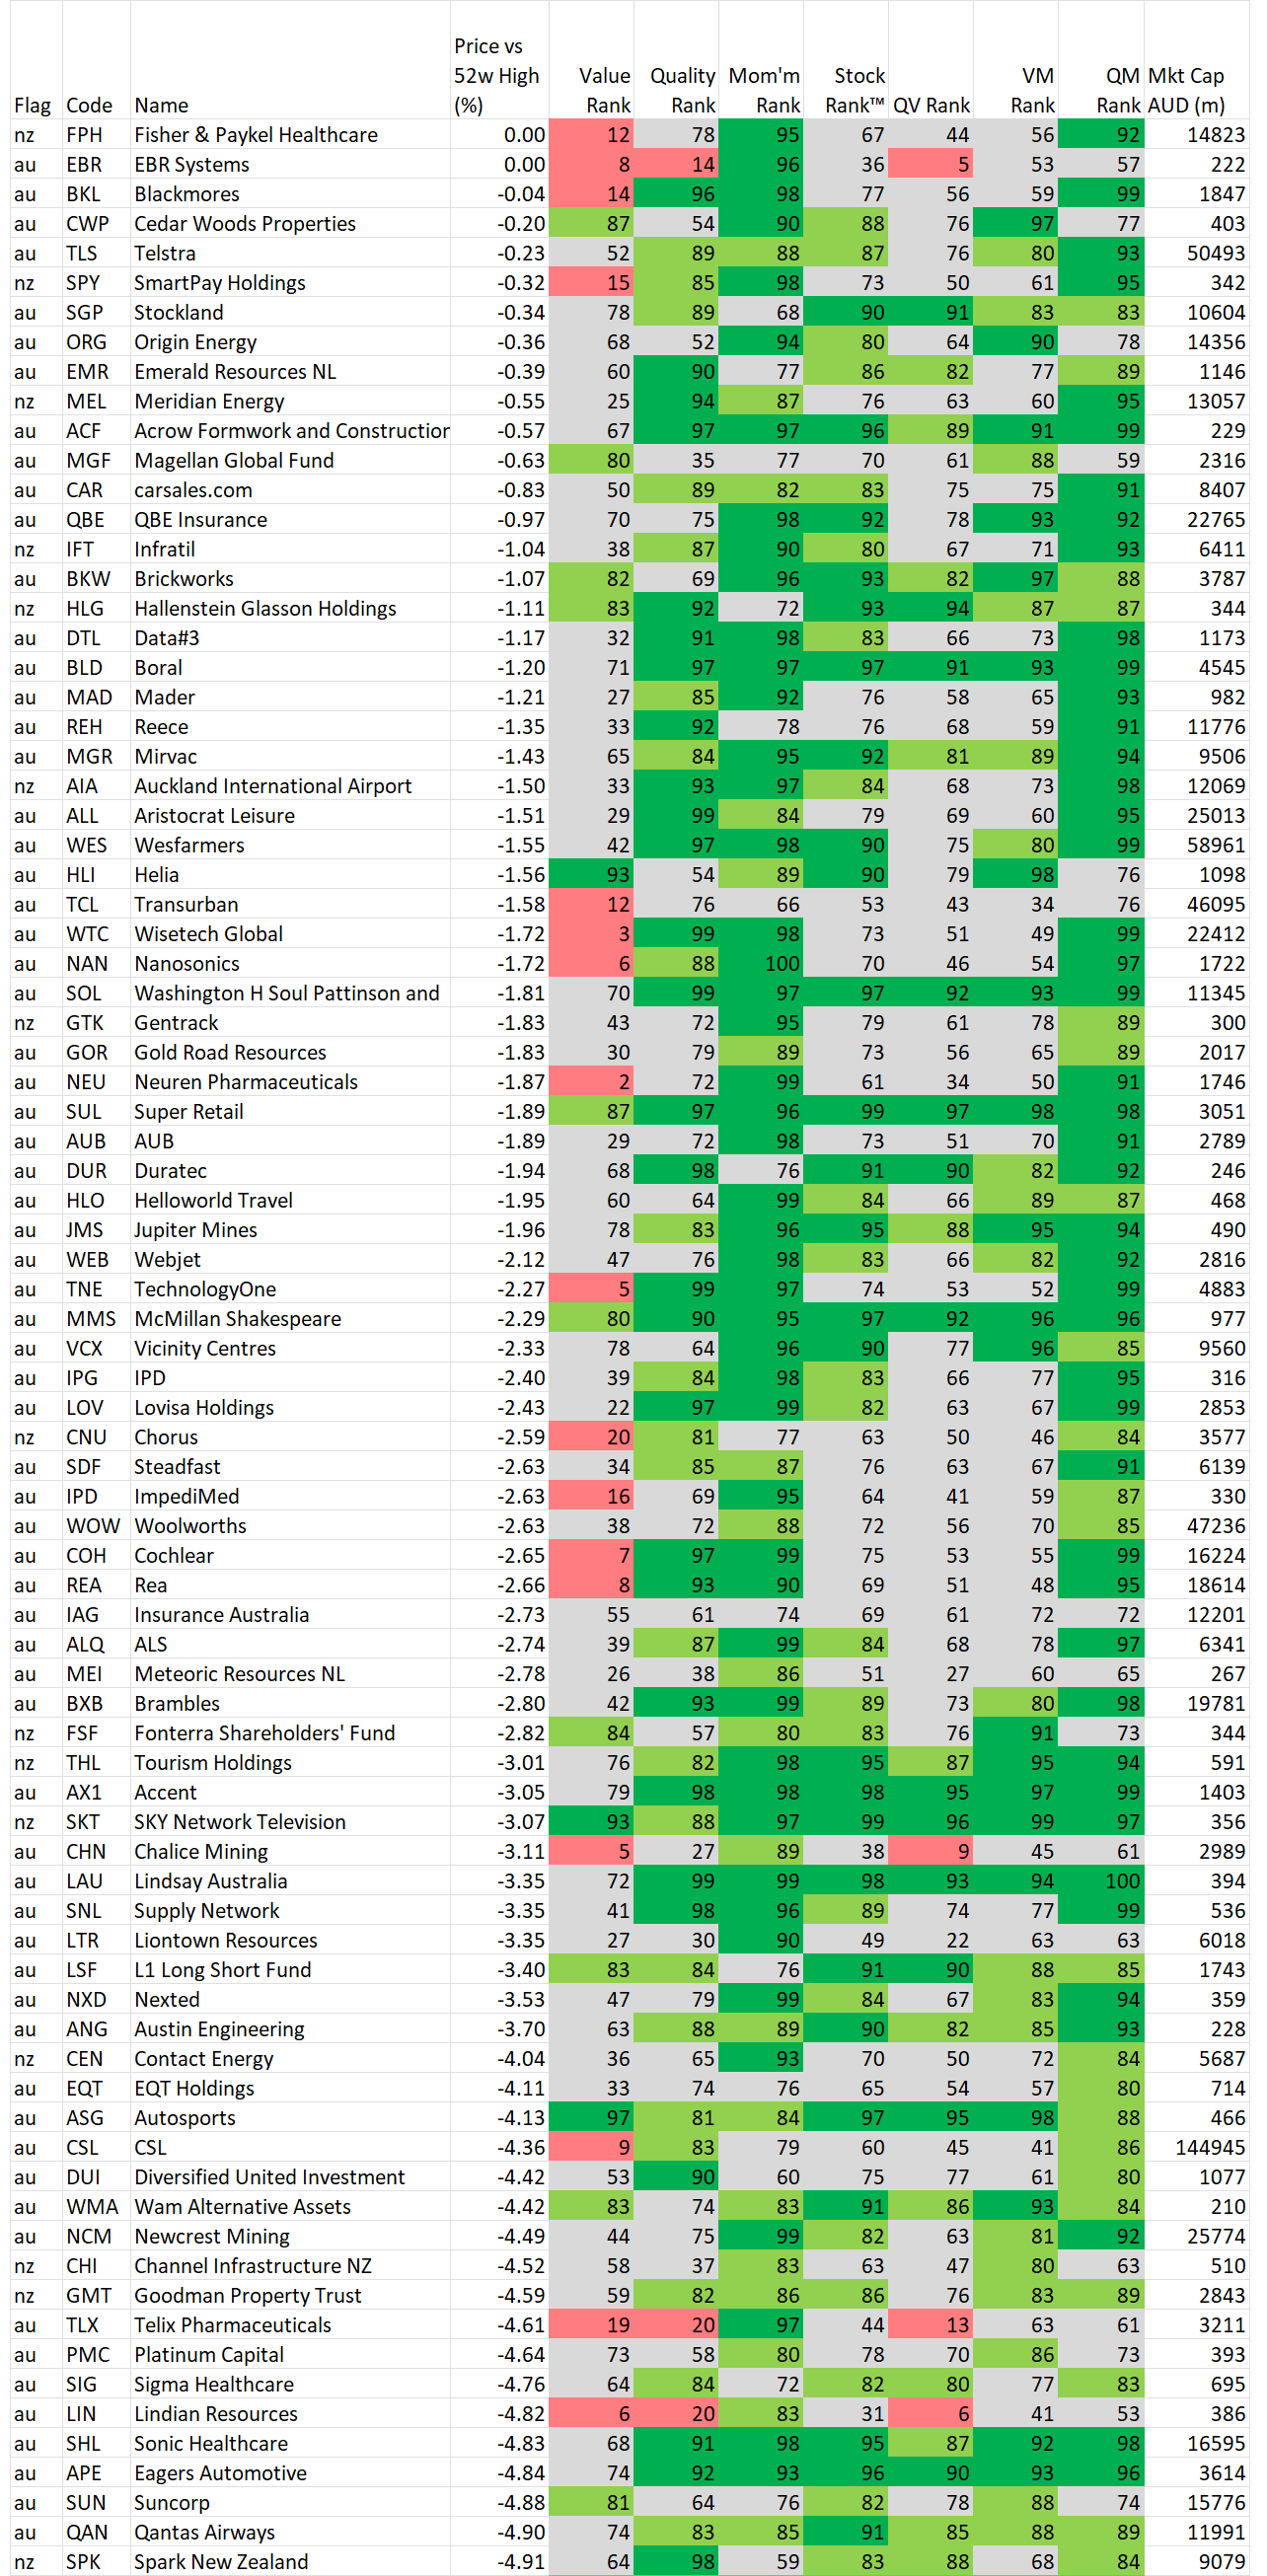
In this section we identify stocks within 5% of their 52 week high based on the idea, supported by academic studies, that stocks close to their 52 week highs tend to outperform. Weekly changes to the list will also be noted.
If you wish to recreate this screen in the screener select "Price vs 52 high" greater than -5% and Mkt Cap greater than $200M
As an added feature we will now record changes to the list week to week. A stock coming onto the list is NOT an automatic buy, just as a stock that leaves the list is NOT an automatic sell. However movements on this list may alert you to interesting charts so be sure to look at Stockopedia and the chart first before making any decisions.
Data is at 28 April and is sorted by the stocks closest to their 52 week high.
And remember, past performance is no guarantee of future performance.
Changes from last week
List for 28 April
Important Information: Stockopedia Ltd ABN 39 757 874 670 UK business registration number 0637267 (“Stockopedia”) is an Authorised Representative of Daylight Financial Group Pty Ltd ABN 77 633 984 773 (“DFGPL”) which is the holder of an Australian Financial Services Licence (AFS Licence No. 521404).
Information in this commentary is current as at date prepared unless otherwise stated. However, please bear in mind that investments can go up or down in value, and that past performance is not a reliable indicator of future performance. For more Important Information please refer to the Disclaimer section of this website.
This communication may contain general financial product advice. It has been prepared without taking into account your personal circumstances, and you should therefore consider its appropriateness in light of your objectives, financial circumstances and needs before acting on it.
If our advice relates to the acquisition or possible acquisition of a particular financial product, you should obtain a copy of and consider the Product Disclosure Statement (PDS) before making any decision.
The author holds interests in stocks highlighted in the data tables . This position can and will change at any time without notice.
Disclaimer
This is not financial advice. Our content is intended to be used and must be used for information and education purposes only. Please read our disclaimer and terms and conditions to understand our obligations.
10 comments
An explanation on how you apply Liquidity and On Balance Volume (OBV) would be good.
I really liked reading your momentum journey, while its not necessary to footnote, there is alot of academic background underlying. I'm not on the momo journey yet myself. But stories like Nicolas Darvas are interesting. And Soros "positive feedback loops" or reflexivity is the core that powers mo...
Investing in irrational exuberance in a normal (tightening) liquidity environment against the mean of equilibrium - good luck with that.
If you are a concentrated investor, opening an initial position at 1% of portfolio is a bit low imo, however in terms of making risk adj for macro factors atm I'd come to about =< 1% myself. See blue portion graph below. Thanks for the reflecting reminder. Factoring in a size of a position whereby ratio is maintained (not nominal consistency). (Kelly Criterion - a scientific gambling method now incorporated into portfolio management).
Thanks Jonner and I hope others appreciate the effort you went into or your post. My method is part science, part art, part "making enough mistakes to be classified as an expert" .
There is a reason why behavioural economics/finance (aka scientific gambling) is starting to engage much of academic literature...
However I hate to be pragmatic and say that a tribesman of the Serengeti would have told us the same thing our esteemed wise ones have, as they have observed the Wildebeest do the same thing for generations.
Running as a group in right direction is the best chance they have in making it to the next watering hole. Sure the occasional laggard gets eaten by the Lion, but the group as a whole survives and thrives.
As for the concentrated investor... bet on the bigger faster beast, Thanks again.
As for how I apply Liquidity, this is very different as an individual vs a fund manager vs my trading strategy vs my conviction strategy. As a rule of thumb as a DIY investor, even if I really like the business, liquidity has to be 2x times greater than any position I take. From a trading perspective (when I need to get in and out like a cat burglar) this increases to 5x... maybe more (depending how much risk I am taking.)
As for OBV I don't look for anything, actually what I look for is what not it there. The way the calc works is in theory when the price goes up, the OBV should follow as the calc simply balances of volume on up days vs down days, and when there is more volume of up days vs the volume on down days, this implies that support is coming into the stock in terms of volume.
The normal state for OBV is to act in parallel with price.
What I am looking for is when an uptrend in price is not supported by a rising OBV. This suggests that while the price might be rising, the volume on the sell days implies a large cohort exiting on strength. Same as when I see a falling price, if OBV is rising it suggests that heavy volume is coming in bargain hunting despite the price fall.
Appreciate that Elio, outstanding value you add. Maybe I should get around to learning to screen.
Thank you Elio. Very Valuable, very efficient
Thanks Elio. The new format looks promising. I did like your technical analysis/review of a handful of stocks in the previous format. I'd like that to be re-included if possible (more work for you though). Also I'd like to hear views on OM Holdings (ASX:OMH) please... It goes ex-div on Friday this week.
Thanks NicholasB, I will still do the stock discussions, however they will be member driven and limited to two. Feedback we received was that the article was a bit long and that something more akin to the new "Shine Zone" would be more of value... but as always we are evolving so thank you for your feedback.
But yes, we can't do both... besides the length... the sheer amount of content would mean releasing on Monday would be an unrealistic timeframe. As far as I know, I don't think there is a service as comprehensive as ours from a Momentum perspective and this is only one piece of the total Stockopedia offering.
In the interests of time given the yield is due soon I will cover OMH now... (but in a another comment). For the benefit of everyone else, future requests will be looked at next week or beyond. keep the feedback coming!
PLEASE READ MY COMMENT IN A PREVIOUS REPLY BELOW TO SEE WHY I AM REPLYING HERE
OM Holdings (ASX:OMH) is a long established maker of all things Manganese based out of Singapore. To keep a very long story simple, the price of Manganese has been rank over the past year and bit as Chinese activity since COVID has either been reducing or under speculation that it will reduce. Manganese is used in steel to make it stronger in the form of ferroalloy. (It is also used in pure form for Lithium Ion batteries as a Cathode - but that is only small at the minute.
And while reports are starting to emerge of China's re-opening and the steel furnaces running once again, margins are being squeezed for Manganese producers due to soring energy costs and OMH is one of those. OMH have also had an issue with one of their manganese alloy smelters not being operational - these are expected to come online soon. Further in April the first silicon metal furnace was stopped on account of not meeting expectations.
The company released an updated statement regarding its ongoing dividend policy in early Feb which it too was a little underwhelming (10% - 30% of NPAT capped at 50% FCF). At 2 cents I don't expect there to be a major impact on price. Obviously the price of Manganese and the resolving of their operational issues will be more important. As will any potential scale benefits that could come from Latrobe Magnesium (ASX:LMG) opening a smelter next door.
The problem with OMH from a Momentum perspective is that it can be very lumpy in terms of liquidity. The stock since the mini peak in February has not been able to sustain itself. The breach of December higher low, means a target of $0.59 comes into play. OBV declining also has supported the recent sell down showing sentiment is on the downside.
And it will really need to hold that level. Otherwise there are some big downside targets. If we look at a 5 year chart that would mean $0.25, and even worse if it breaches below that.
As with most charts, rarely will it be a straight line down (though it can happen) therefore there may be opportunities for a more elegant exit. But the momentum of this stock is down and it needs Manganese to get somewhere closer to early 2022 highs to find the love again.
_____________
Important Information: Stockopedia Ltd ABN 39 757 874 670 UK business registration number 0637267 (“Stockopedia”) is an Authorised Representative of Daylight Financial Group Pty Ltd ABN 77 633 984 773 (“DFGPL”) which is the holder of an Australian Financial Services Licence (AFS Licence No. 521404).
Information in this commentary is current as at date prepared unless otherwise stated. However, please bear in mind that investments can go up or down in value, and that past performance is not a reliable indicator of future performance. For more Important Information please refer to the Disclaimer section of this website.
This communication may contain general financial product advice. It has been prepared without taking into account your personal circumstances, and you should therefore consider its appropriateness in light of your objectives, financial circumstances and needs before acting on it.
If our advice relates to the acquisition or possible acquisition of a particular financial product, you should obtain a copy of and consider the Product Disclosure Statement (PDS) before making any decision.
The author holds interests in stocks highlighted in the data tables . This position can and will change at any time without notice.
Thank you Elio, very helpful. I'm still trying to get the hang of incorporating/reconciling macro data (like your analysis above) with a stock ranking of 97, value 98 and quality of 88.
Fair question.... I think the easiest thing for me to say is "Don't", because what our StockRank system does (quite deliberately) is try to place that macro data whereit needs to be and just to highlight the number important to a specific style/factor of investing. Remember Momentum Monday (this report) only looks after investors who look at using the momentum (aka noise) to make a trade. Think of it this way:
- Quality (is it a sound business?)
- Value (is it a cheap business?)
- Momentum (is it a business on the move?)
When talking about Momentum, things like Manganese prices, China activity etc all have an impact as to whether the stock is on the move.
If I was looking at this just from a Quality perspective I would say something like, "Sure the price is down, but assuming the world needs Manganese, I want to find the best Manganese producer I can."
I know it is subtle, but the Ranks each look for different things. The macro 'should' be caught up in Momentum because price captures opinion and earnings momentum (aka analyst revisions) will captured a learned opinion.
Value captures some of the macro as price is obviously a factor in determining value. If the macro suggests a bit of fear, the price will fall, which makes the Value go up!
Quality doesn't capture as much of the Macro as it is a business assessment. Is it Quality, Healthy, Generating a good Return of Capital, Cashflow etc
In short if you are an investor that is cognizant of the macro, then an element of Momentum should be included. Just like me, I am a Quality Investor who also applies Momentum. That is why I look at the QM score a lot in the Screener and here https://www.stockopedia.com/sc... But then I also overlay some basic charting to further help me.
(Thank heavens) Not everyone needs to be like me. Ed for example is a VM (Value / Momentum) investor. The question you should ask yourself is what type of investor are you? Long-term, short-term, active, passive, dividends, care about macro, risk taker, risk averse etc.
Once you answer these questions then a strategy can be built around this and that is where Stockopedia can help you immeasurably by helping you stick to that strategy with discipline.
We look forward to accompanying you on that journey!