Momentum Monday 21st October 2024

Welcome to Momentum Monday.
What can we say that already hasn’t been said?... Look at this week’s edition to find out. But try not to over-think the obvious. "Think less, make more money."
Interesting links
Shares for Beginners is back and therefore look to our link in the program for our latest edition. This week it was Chris Batchelor talking about RDX Redox. Click here to be taken to the link of the recording.
Don’t forget to “Empower Others”. There is no better time to refer the award winning platform which is Stockopedia than right now at our best ever rate. If you think there is someone who will benefit from this offer, please reach out and we will send you the link.
For any external commentary we make to the broader market, follow us on Social Media Facebook Linkedin Instagram or X (formerly Twitter) Some of you already have so ‘Thank You’ for that.
If you haven’t already signed up to Podbean or your favourite streaming channel to receive our morning ASX market reports. (Assuming you know what I even mean)… Click here to signup for it - Signing up for Podbean though is the quickest way you will get it.
This week’s content is as follows:
Broader market sentiment
Member corner
Stocks in the “Shine Zone” (including changes)
Momentum Movers (weekly only)
52 week high screen (including changes)
A reminder that you don’t have to read all this contribution. Simply scroll to the area of interest.
Broader Market Sentiment
We look at the direction of both the US and ASX markets to gain an understanding of the broader sentiment at the minute. It is important to stress here that I DO NOT use this to time my entry or exit out of stocks. I prefer to use the individual charts of stocks to do that. However I find it useful in helping us determine how aggressive/cautious traders should be in their trading. In short the more positive the broader market is the more risks you can take and vice versa.
US / S&P500
Another week… and another record. All for the S&P500 and Dow Jones. Not quite the NASDAQ Composite, but it isn’t too far away.

S&P500 Weekly chart
This was the 6th consecutive week of gains for the S&P500 and it was the record for 2024. Dare I say it though, the more up weeks we have brings us closer to a down week. But a 0.85% gain for the week in our broadest US index is quite strong. The extra pleasing thing is the even broader Russell2000 rose by more, showing that smaller caps were doing better than the larger caps. It certainly doesn’t always happen like this. But “it is, what it is” so enjoy it.
Also I want to stipulate something right now. The next correction will occur when you LEAST EXPECT IT. If everyone could predict it accurately, there would be no correction, or no zigs and zags in price or the index. Therefore when everyone thinks it will collapse it won’t, and when everyone doesn’t think it will fall, it will.
There…. Now that I said that, of course it will correct one day…. But it is not today. I will let the chart tell me when that day comes. Until then I remain bullish on global markets and I will keep enjoying games of Five Hundred (for those wondering… this is a card game) until the global index crosses below 5408..
The accidental killing of Hamas leader, Yahar Sinwar helped oil prices lift globally on the day as threats of Iran’s increased involvement in the regional conflict grew, but I have to be honest with you, they had been falling prior for four consecutive days - so I hate to say it - but a bounce was expected. What happens next in the region may command the headlines, but will not drive prices given they haven’t driven them to date.
It was also interesting to see the European Central Bank cut interest rates by another 25 basis points. This on the back of the mega cut in the US and NZ of 50 basis points. So unlike Australia, it would appear there is room for rate cuts from our Global Central Banks. This is further exacerbated by talk that the US may already be close to its 2% inflation target. And that inflation in the UK came in at 1.7%.
Further aiding this view was initial unemployment claim filings totalling 241,000, a decline of 19,000 and lower than the estimate for 260,000. All the while retail sales data coming out of the US increased a seasonally adjusted 0.4% on the month of September, up from the unrevised 0.1% gain in August and better than the 0.3% forecast. See how any bit of news can be manipulated to any perspective? "Lies, damned lies and Statistics" indeed.
Reporting season has gotten underway over there and dare I say it, we are seeing the usual ‘beat on expectations’ that we expect every quarter…. About three quarters. Though with only a little over a tenth of the S&P500 actually reporting to this point it is still too early to make any assessment there.
On a final note, I read that the interest expense for the year in the world’s largest economic power, the US, totalled $1.16 trillion. This was the first time that figure has topped the trillion-dollar level. This one figure should be enough for us as mug punters to ignore everything now, and sometimes invest with our eyes closed, ears blocked and with our mouths shut (Just like the 3 wise monkeys).
On that note, I will do the same. The market is at an all time record over there!
AUS S&P/ASX200
Another positive week and another weekly close at all time weekly highs. This bull market continues and I hope we are all benefiting from it because these times don’t always happen.

Looking at the chart and it is interesting to see that the S&P/ASX200 has actually had an RSI on the weekly chart in positive territory since December last year. Prior to that it was all choppy, that is after the run the market had posted after the COVID sell down. That said, we are not even in the overbought range at this point and not even as high as it was back then, therefore when people say to me the market is ‘stretched’, perhaps it is, but there is not much in the chart that would suggest that at the moment.

S&P/ASX200 Weekly RSI since December 2023
Just to prove that news is just noise and there is no “move on good news” or “move on bad news”... on Thursday last week we heard that unemployment remained at 4.1% however with 64,100 jobs created, the participation rate increased slightly to a record 67.2 per cent. Normally this would be good news, but as this is the second consecutive strong rise in employment in Australia, the jumbo rate cuts of the US and NZ are considered irrelevant and that our rates will stay higher for longer and as inflation remains sticky. Hence the market pulled back from record highs. Though our European friends cut rates by 25 basis points, again adding to the frustration some may experience domestically.
Another major contributor to the market pulling back from all time highs is growing pessimism in China. Following the Golden Week celebrations which saw Iron Ore bounce, since then the China mirage is fading on account of lifting bond sales, rising tariffs against it from major trading partners, and a slowing property sector.
We also got those 3 qtr GDP from China, and actually their industrial output in September grew 5.4 per cent from a year earlier, up from a 4.5 per cent pace in August. The official data from the National Bureau of Statistics (NBS) on Friday beat expectations of a similar rise this month.
Most pleasing was retail sales over there rose 3.2 per cent in September which was more than the 2.5 per cent expected and the 2.1 per cent growth achieved in August. But property still makes up one-fifth of a very large pie so we ignore this specific sector at our own peril.
The net outcome of all this was China’s Q3 GDP grew 4.6pc, slightly above economists’ estimates but it may maintain pressure on policymakers to consider more stimulus measures. Though the sum was above expectations, it is important to note that it is still a drop from the 4.7 per cent experienced in the previous three months. I think the market latched onto this point on Friday, hence the broader sell down.
Again, boring old me I have nothing more to add. I mean look at the siz of the lists below. In fact we have never had as many stocks trade with 5% of their 52 week high ever, and these are just the ones with a market cap greater than $200M. For now I will keep my support level at 7547 after all, the market is up (just in case there was any doubt.). If it goes up again I will raise my “watch and act” level.
Member corner
In this section we will provide a detailed chart assessment, on a maximum of ten stocks weekly, on companies from those of you in the Gallery.
We welcome stock requests to be analysed from members. We will also be looking at the charts of some of the more actively researched stocks for the week. We will try to rotate through a selection so as to not make the charts stale, however we will likely not cover a stock within 2 months of when it was last discussed.
If you want to see what has been written about a stock recently, go to the discussion area.

We will not be making up suggestions. If there are no changes to the most viewed list and/or there are no suggestions from members, then no stocks will be covered.
To learn of the methods used to analyse companies in this section, refer to my Momentum Journey series that I articulate here in three parts.
They will help provide context on what I am writing about and the editorial angle of this report.
Also look at the market capitalisation and liquidity before making any decisions!
And again, if you have a stock you would like analysed from a momentum perspective, please write it into the comments section below or email us at support@stockopedia.com.au
ASX:RDX Redox Limited
StockRank 94
Momentum Rank 93
QM Rank 97
VM Rank 87
A$3.56
It was unsurprising that seeing it written about recently, many members went and had a look at Redox (ASX:RDX) and from a momentum perspective, this is the first time we cover it here.

Well you don’t need this article to say we are close to trading at all time highs on this one, which again is a positive when looking for a business to invest in. But as we say in the article, it is only fairly newly listed so I encourage you all to read it more closely to get a thorough understanding from a fundamental perspective on what it does.
From the chart perspective, it is important to note that RDX can be quite volatile. However a short-term level of support can be seen at $2,94 which coincides with the low in May this year. If you wanted to include the little dips in between you could say the range was $2.87 - $2,94. Assuming it stays above that level, the stock is fine. Given it has created a series of higher highs in the meantime as well. Is also a positive.
ASX:SUL Super Retail Limited
StockRank 98
Momentum Rank 98
QM Rank 97
VM Rank 96
A$17.19
A stock that is in the NAPS portfolio for 2024 but is being included here for the first time since April earlier this year is Super Retail (ASX:SUL). Members can read that commentary here. Briefly it appeared in the most viewed stock list on Friday morning.

ASX:SUL 1 year Daily chart
I mentioned at the time that I wouldn’t look at it again until it crossed back above $16.10 and that $13.53 would be a good level of support for those considering a position at that time. Well it actually fell lower than that with the price eventually getting to $12.06 on an intra day low.
But that intraday low was actually a higher low when compared to the one back in June 2023, therefore technically the stock was still in an uptrend.

ASX:SUL 2 year Daily chart
So the fact that the price had got some ~25% form the re-entry price, it would be fair to assume that re-entry price would also come down as well. Even to that $13.53 mark where a breach above that would be a positive sign.
The share price since has gone from strength to strength, and from current levels, if you consider a position in them now,beyond your parachute stop, look at the gap created post their report in August as a short term measure. For investors their higher low would also be a good level, but you would be acknowledging some significant drawdown if it got down there.
ASX:WEB Web Travel Limited
StockRank 57
Momentum Rank 5
QM Rank 47
VM Rank 34
A$4.20
Not having been looked at since April 2024, the company was a different beast as it also had WJL Webjet attached to it. So all previous comments onWeb Travel (ASX:WEB) are null and void.

ASX:WEB 1 year Daily chart
The only thing that is important now is news and sentiment post the demerger of the two businesses. To that end WEB the first gap was created post demerger, the second larger gap was created when the company provided an update saying that margins would be less for this year than previous.
This is a stock in a clear downtrend. The mixed result from Flight Centre Travel Group further confirmed that on Friday. No matter how you look at it, whether you held them pre-demerger or bought them afterwards, this stock is in a downtrend. Personally I would want to see more history as a listed entity before committing to this one. For the record, WJL is still trading above the first day it closed (only just) but again I would want to see more price history here.
It is difficult to say where a floor in in a stock creating new all time loans and has only traded for a short time. That said, I would look to the recent gaps as flags in the short-term turf.
Stocks in the Shine Zone
To learn about the Shine Zone and how to use it, you can read it here.
The rules for inclusion in this list are based on those I like to see in a stock before considering a trade in it:
QM Rank above 80
Price is above the 2.5x ATR
50d MA is above the 200d MA
Price is greater than the 200d MA
Market cap greater than $200M
This is a very important point: the “Shine Zone” are rules for possible buying. They are not for holding and/or selling. If a stock falls out of the shine zone, use support levels to set your stops, or instigate a parachute stop if necessary. With markets moving sideways, one expects frequent changes in these lists.
If you feel there is a stock that should be included but is missing please let us know. This is a manual process and occasionally one gets through the cracks
Also look at the market capitalisation and liquidity before making any decisions!
Data is at 19 October and is sorted by the stock code.
Changes from last week
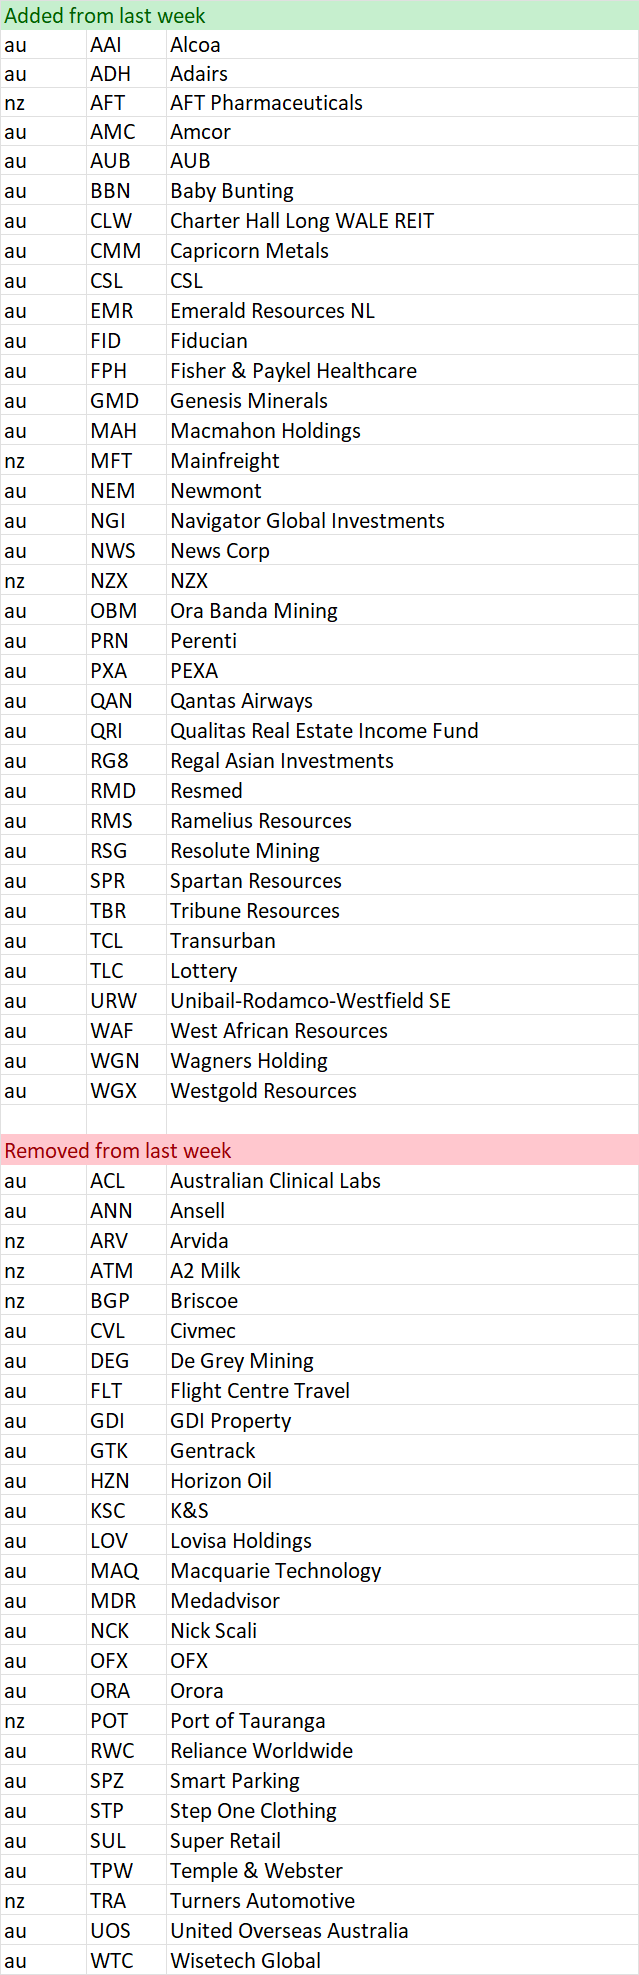
Shine Zone list as at 19 October

__________________________________
Momentum Movers
I have actually published an article discussing my thinking with these tables. You can read about it here.
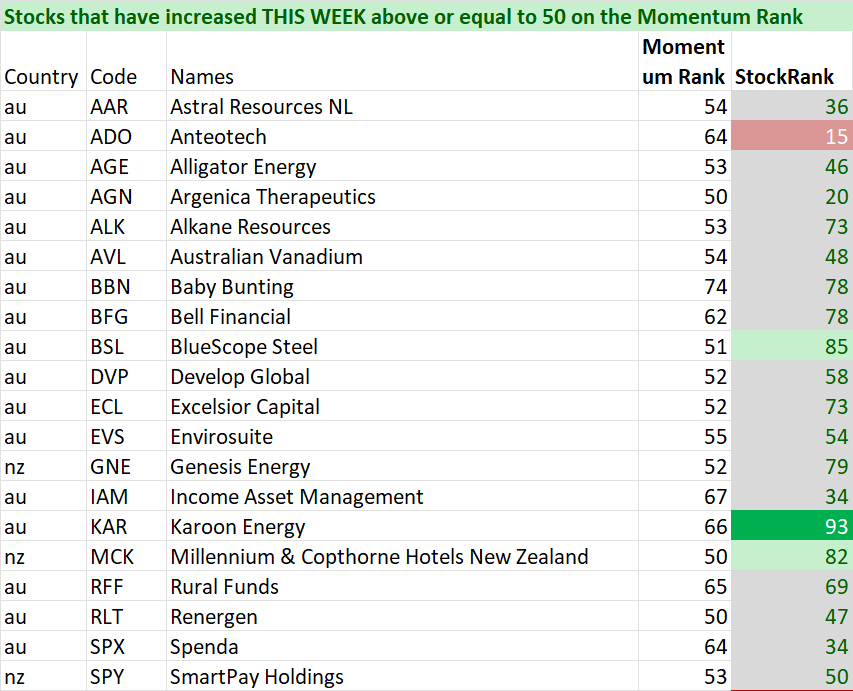
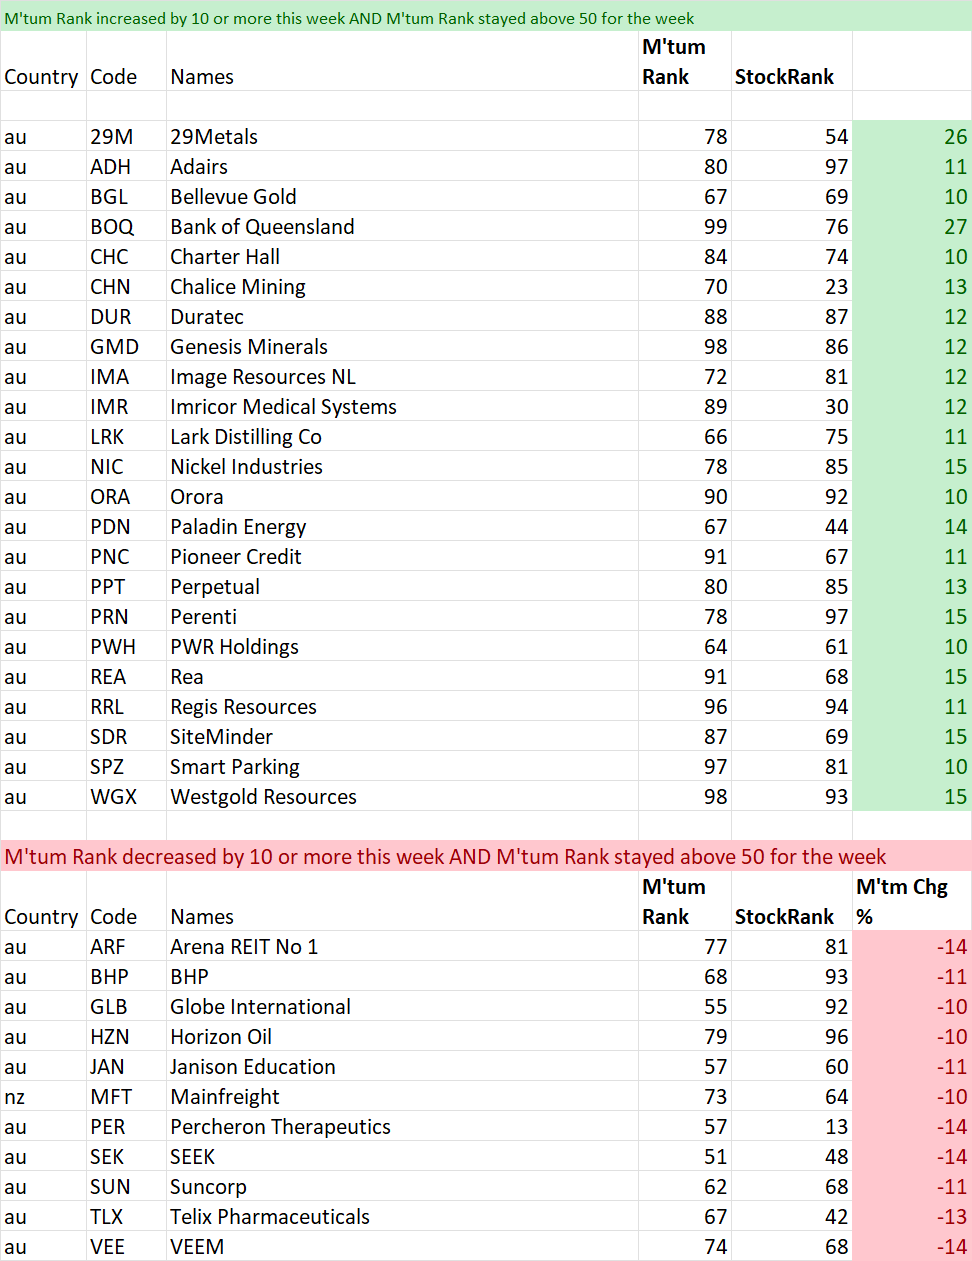
In summary, there is a school of thought that the change in something is just as important as the absolute number itself. Momentum is our most volatile ranking. This section is intended to bring to readers attention the big moves from a Momentum Perspective. As with other lists this is not designed to be a list of stocks that are replicated. Rather it can be a starting point of investigation for further consideration. Initially it will record weekly changes. This will include a monthly change when enough time has elapsed. This section is divided into two lists.
First is a list of stocks that have just crossed above 50 from a Momentum perspective. By definition, these will be stocks that have improved over the past week and month and may warrant further investigation. As a bare minimum a look at liquidity and market cap.
The second list measures all stocks that are currently ranked above 50, have remained above 50 during the time periods analysed (ie not just added or removed) AND whether they have improved or worsened by more than 10 points on the Momentum Rank.
With all filters a minimum market cap of $50 Mil has been included to help ensure investability from a small perspective. Be sure to check liquidity relative to your preferences.
Note: Some of the changes are due to the market cap now rising above $50M. Be sure to double check.
Data is on 19 October and is sorted by their code.
And remember, past performance is no guarantee of future performance.
Weekly Tables (the past week)
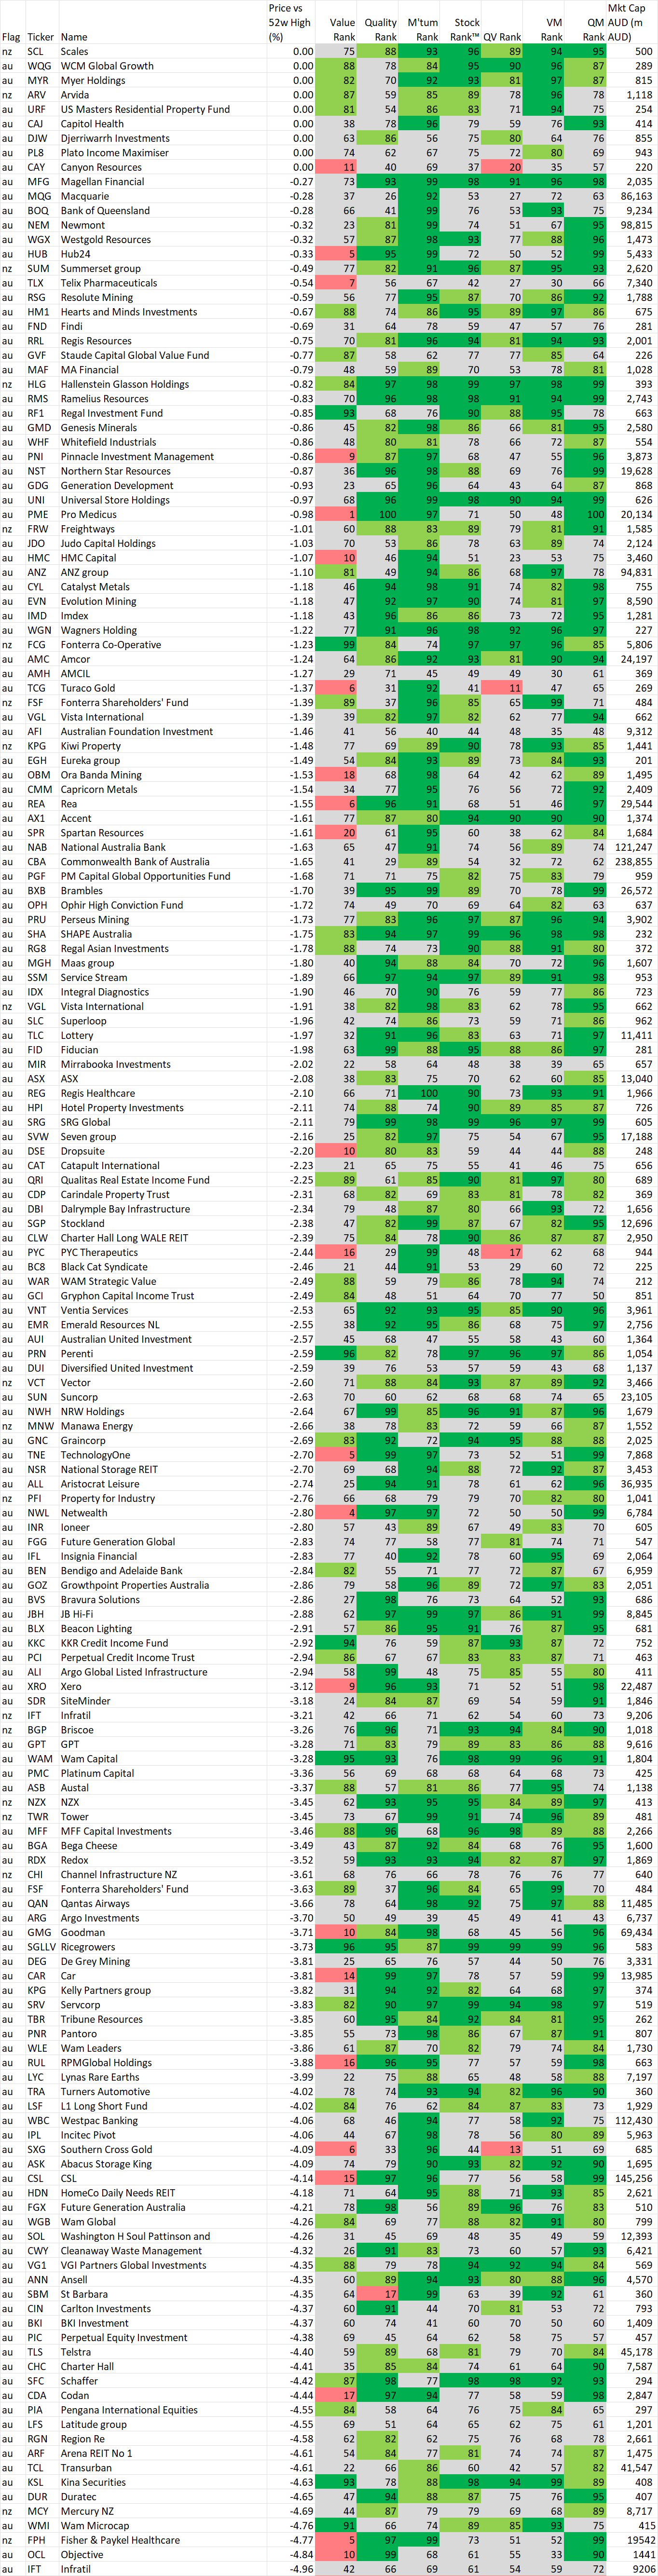
52 week high screen
In this section we identify stocks within 5% of their 52 week intraday high based on the idea, supported by academic studies, that stocks close to their 52 week highs tend to outperform. Weekly changes to the list will also be noted.
If you wish to recreate this screen in the screener select "Price vs 52 high" greater than -5% and Mkt Cap greater than $200M
A stock coming onto the list is NOT an automatic buy, just as a stock that leaves the list is NOT an automatic sell. As with the shine list, assess every chart on its merits. However movements on this list may alert you to interesting charts so be sure to look at Stockopedia and the chart first.
Data is at 19 October and is sorted by the stocks closest to their 52 week intraday high.
Also look at the market capitalisation and liquidity before making any decisions!
And remember, past performance is no guarantee of future performance.
Changes from last week
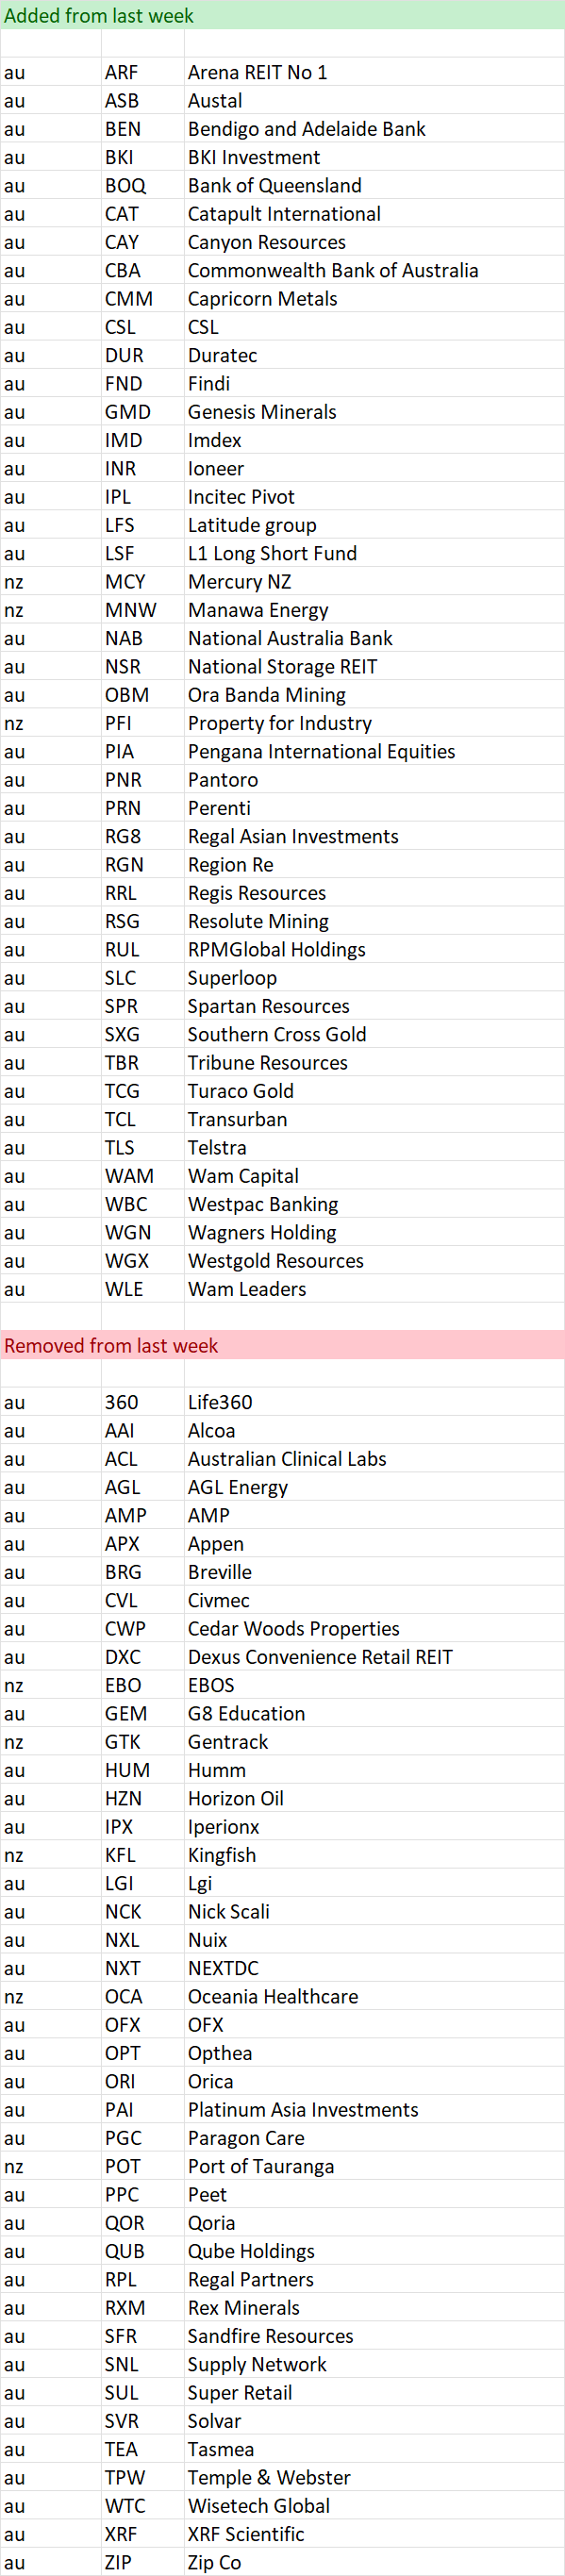
Stocks within 5% of their 52 week high as at 19 October
Important Information: Stockopedia Ltd ABN 39 757 874 670 UK business registration number 0637267 (“Stockopedia”) is an Authorised Representative of Daylight Financial Group Pty Ltd ABN 77 633 984 773 (“DFGPL”) which is the holder of an Australian Financial Services Licence (AFS Licence No. 521404).
Information in this commentary is current as at date prepared unless otherwise stated. However, please bear in mind that investments can go up or down in value, and that past performance is not a reliable indicator of future performance. For more Important Information please refer to the Disclaimer section of this website.
This communication may contain general financial product advice. It has been prepared without taking into account your personal circumstances, and you should therefore consider its appropriateness in light of your objectives, financial circumstances and needs before acting on it.
If our advice relates to the acquisition or possible acquisition of a particular financial product, you should obtain a copy of and consider the Product Disclosure Statement (PDS) before making any decision.
The author holds direct interests in RDX, SUL and companies listed in the data tables . This position can and will change at any time without notice.
Disclaimer
This is not financial advice. Our content is intended to be used and must be used for information and education purposes only. Please read our disclaimer and terms and conditions to understand our obligations.
No comments yet
No one has commented here yet! Why not be the first one?