Momentum Monday 22nd April 2024

Welcome to Momentum Monday for this shortened trading week..
OK... So it feels like things are getting real. We might be still trading at near all time highs, but the bearish sentiment and commentary is growing, as is the the price of Gold and its coverage. Is this the beginning of the end? Unfortunately I will have to defer to the charts for that. But the good news is we provide this coverage weekly so we will share it once sentiment has officially changed..
Interesting links
Weekend Watchlist with Shares for Beginners this week is a Stock with lots of lessons. It is HSN Hansen Technologies. Listen here to the replay
Our “Empower Others” referral program will e undertaking a change. For now we maintain the current system, be sure to Learn more here if you are interested in current plan
For any external commentary we make to the broader market, follow us on Social Media Facebook Linkedin Instagram or X (formerly Twitter)
This week’s content is as follows:
Broader market sentiment
Member corner
Stocks in the “Shine Zone” (including changes)
Buses pulling out of the station (volume + price movers)
52 week high screen (including changes)
A reminder that you don’t have to read all this contribution. Simply scroll to the area of interest.
Broader Market Sentiment
We look at the direction of both the US and ASX markets to gain an understanding of the broader sentiment at the minute. It is important to stress here that I DO NOT use this to time my entry or exit out of stocks. I prefer to use the individual charts of stocks to do that. However I find it useful in helping us determine how aggressive/cautious traders should be in their trading. In short the more positive the broader market is the more risks you can take and vice versa.
US / S&P500
I am of the train of charting education where three consecutive down bars is a worry. We have just seen that in the US where the S&P500 has just experienced its third consecutive down week. Down 3% for the week.

S&P500 Weekly chart
The other thing to note is that as each week progressed, the size of the fall got larger. Therefore you would be nuts to not watch it from here, though I re-emphasise, it is still in a broader short term uptrend.
The horizontal dotted line you can see on the chart is where I have structural support. If you are squinting, that is 4734 which is based on the previous all-time high seen at the end of 2021.
4117.4 is the higher low from October 2023 (solid horizontal line) and investors will be hoping we at the very least hold that level.
There has been plenty of media coverage recently on the conflict in the middle east and what it means for the currency, commodities and the market. In my view, learned opinions are great to read, but pale in significance to looking at money flow. For example I even read this morning (Saturday) that somehow the concerns of conflict have washed over the tech sector as Nvidia fell 10% on Friday and dragged the NASDAQ Composite down with it - I mean, if I wasn’t so vested in these things, I would just laugh! I mean the price of oil fell last week!
This correction was more related to semiconductor stocks taking a hit on Friday as well as big tech stocks reporting next week with some better position sizing being done (though expect the results to be strong). Further the idea that rates ill be higher for longer hurts cash hungry businesses. Long story short, after such a great run, tech stocks need to take a breather.
But given the importance of the sector to the broader market, looking at the Nasdaq Composite we can see we are at a pretty important juncture. Acknowledging that it tends to be more volatile than the NASDAQ100, and the broader market, it has effectively risen back to levels last seen at the end of 2021. Therefore the index is hitting resistance

NASDAQ Composite Weekly chart
It's obvious what it does from here will be paramount to the direction of the broader market and next week will tell us a lot more. The pleasing thing was that it created an all time high recently. The worrying thing was that this was the longest losing streak in the index in more than a year. It is the worst week in 5 months for the S&P500. And the market is zagging.
Therefore more relevant to recent sell-off I think is profit taking and the fact that the Federal Reserve in the US is changing its tone on the back of stubborn inflation and robust employment numbers. Many market watchers have put behind them the possibility of three rate cuts this calendar year and therefore have turned less optimistic.
And no one is really talking about President Biden’s decision of tripling tariffs on Chinese steel and aluminium imports and what the fallout of that move may be. While still too early to tell, everyone from our Treasury, to the US government and the consumer both here and in the US will be watching.
While this is easily dismissed and considered more a political move than anything else given the size of the US Steel industry and that Chinese Steel accounts for only 1% of America’s supply, with Aluminum about 3.6%.
President Biden has said this is not the start of a trade war… but watching from the sidelines it does look like Protectionism that I read about at University - and we were told that was akin to saying the unspeakable word. Again I am not making any decisions based on this, but I will be watching.
My comment last week that a zag was due in the index rang true, On a whole we are still inequities globally - but we can’t dismiss anything.
AUS S&P/ASX200
It felt a lot worse than it actually was last week. No doubt because two Fridays ago was also a down day. The S&P/ASX200 falling 2.8% over the five trading days

S&P/ASX200 Weekly chart
There are some things to look at on the chart. But first let’s talk about the reasons from a sentiment perspective we are here.
Stronger than expected employment numbers add weight to the idea discussed last week that higher rates may hang around a little longer than anticipated. While to be fair there has been no “three rate cut” like statement - one suspects stubborn inflation is not going to disappear any time soon and therefore this does not create the environment for easing inflation. Though it is important to note that inflation is cumulative. Therefore even if the rate of inflation eases, the price of everything won’t come down. This is normal behaviour. Just ask those, like me, who lament the days of the 20c big bag of lollies. (I wasn’t born pre-Decimal Currency days so I can’t quote them)
The AUD continues to get weaker. Again not great if you are an importer or travelling overseas. But not particularly good in a stubborn inflation environment. If currency doesn’t help keep prices down now where the cost of doing business is going up at a rate of knots, then you are in strife. That said, the US dollar weakened slightly on Friday as reports of attacks on Iran by Israel reignited fears of the high tensions in the Middle East spilling into a wider conflict. Then I read they are not that interested in fighting back. Who or what do I believe? We shall see how this plays out on our market. Though I take a lot of heart from the recovery in the second part of the day. We will see what happens internationally.
We are starting to see quite a few quarterly activities statements coming through. The focus has been quite clear. For producers we know the price of commodities are less than a year ago so managing costs has been a focus. Whereas those who are not price takers have been focusing on cash flow - and by extension expenses as at the end of the day, the more cash they have the better.
But now to the chart and I was hoping beyond hope that we could keep the price away from the multi year sideways channel we had seen. Unfortunately the close at 7567.3 took us back into the channel which is disappointing, but if I am looking for positives a small one may be that it is still above the short term level of support of 7547 that I set my myself a few weeks back
Back then I said I really wouldn’t look much at the broader market sentiment till then so I will remain focused on that, irrespective of the pain it causes me. Clutching at straws I could move that down to 7421.2 which we saw in the middle of January.
One thing for sure is that I hope the October lows are behind us - but I’ve learnt when it comes to trading, “Never say Never”. As we highlighted a few weeks ago, the size of each respective table below was reducing and again it has occurred this week as you can see there were more removals than additions. While for now it doesn't mean much, again I hasten to add that we would expect this once markets have a pullback. In this instance it was a precurser to this small reduction we've seen.
I see the weekly RSI stays just above 50 for the moment, though unfortunately the negative crossover of the MACD indicator has occurred and therefore a sign that it won’t be as easy to make money in the near term.
I am not changing my view on the markets at the minute, my mind goes back to everything that happens during times when things get rough geopolitically. So I am not panicking yet and hope I won’t have to. If I drink my own kool aid and block out the noise I have said ad nauseum that markets zig and zag, therefore I knew a zag was coming. Doesn’t make it easier though.
I’m hoping like the next guy the market goes up next week. No problems if it doesn’t as we’ll be ready there too.
Member corner
In this section we will provide a detailed chart assessment, on a maximum of ten stocks weekly, on companies from those of you in the Gallery.
We welcome stock requests to be analysed from members. We will also be looking at the charts of some of the more actively researched stocks for the week. We will try to rotate through a selection so as to not make the charts stale, however we will likely not cover a stock within 2 months of when it was last discussed.
If you want to see what has been written about a stock recently, go to the discussion area.

We will not be making up suggestions. If there are no changes to the most viewed list and/or there are no suggestions from members, then no stocks will be covered.
To learn of the methods used to analyse companies in this section, refer to my Momentum Journey series that I articulate here in three parts.
They will help provide context on what I am writing about and the editorial angle of this report.
Also look at the market capitalisation and liquidity before making any decisions!
And again, if you have a stock you would like analysed from a momentum perspective, please write it into the comments section below or email us at support@stockopedia.com.au
IF NO ONE ASKS… HOW AM I SUPPOSED TO KNOW?!?
ASX: WOW - Woolworths Limited
StockRank 70
Momentum Rank 72
QM Rank 82
VM Rank 59
A$31.40
After another senate grilling it was no surprise to see Woolworths (ASX:WOW) front of mind for investors this week

ASX:WOW 1 year Daily chart
We last covered WOW from a Momentum perspective inFebruary 2023. At the time we mentioned that people “gotta eat” and that logically the trade made sense. But I also said that a pullback would be acceptable “provided it stays above $33.10,
Since then the rising cost of living pressures, a very public blow up from senior management and now Government Scrutiny has seen that price passed on the downside and things look a little different than back then.
In fact the stock is only a little over a dollar away from my next key level to watch is $30.17. To think that coincides with a low around COVID time seems staggering.
The fact of the matter is, the break that saw the price rise to $40.28 in June 23 was actually a false break. Since then a series of short term lower lows has seen price retrace to levels not seen in November 2022. While my logic brain says this is crazy and I have WOW on my watchlist for a recovery, news on government intervention is littly to play havoc with the price in the near term. Therefore while it is cheap and may seem like an opportunity, I am not sure that the volatility is done just yet.
I mean looking at the intra day low at the peak of the COVID fear I see $28.365, but it actually closed up that day.

Therefore long term investors may be shaking their head if they don’t have to see the stock for 10 years, whereas short term investors may try to be greedy and wait for price to retrace a little lower and hopefully gain some clarity from the Government as to what it will do.
If however, for the downtrend to continue, the gap up to $35.87 is filled and fails, then the downward move resumes. Long story short, despite the obvious outcome for long term investors, shorter term ones know there is more to watch.
ASX: WDS - Woodside Energy Limited
StockRank 88
Momentum Rank 77
QM Rank 82
VM Rank 88
A$29.40
Despite my overly dismissive view of the business, Woodside Energy (ASX:WDS) was again amongst the most watched stocks by our members.

ASX:WDS 1 year Daily chart
When I discussed it recently in February I said “Long term structural support remains at $20.” From a charting point of view, I see no change in that perspective at this stage.
Using WDS as a proxy for oil price moves makes sense. However, to me, looking at the price of oil and how it has moved recently makes no sense. But the emerging reports of Israel striking Iran may do much to propr up the price in the near term. But again I throw my hands up in the air and I become beholden to the chart.
The reality is the price is lower than where it was when it was last commented on. It remains an avoid,and unlike other price takers in Iron Ore, Copper, Tin and Steel recently (let’s not forget Gold) who have seen a bounce this week, oil has done the opposite. Therefore so has WDS’ share price.
Hopefully we can look at it again soon.
ASX:SNL - Supply Networks Limited
StockRank 81
Momentum Rank 93
QM Rank 98
VM Rank 62
A$19.70
A member lamented about not selling out of S32 earlier and delaying their purchase of Supply Network (ASX:SNL) . In that time both have gone up significantly and just like S32, this is the first time I talk about SNL from a momentum perspective.

Before I look at the chart, I just want to say. In the eyes of a chartist, Stock A going up 5% is exactly the same as Stock B going up 5%. They have gone up the same amount. So who cares if you hold one, the other or both? Theoretically your performance is the same. So rear view mirror investing considering past trades is nothing more than “Traders Regret” and seriously, all we can control are the cards presented in front of us at any time, and that is what we have to make a decision.
If you are like me you want to avoid the big swings down and hold more that swing up. When trading, I don’t care what the stock does etc because in theory, it should all be baked into the current price and therefore its sentiment that moves us from Over enthusiasm to Over despair. As was quoted by Eugene Farma “Momentum is the great market anomaly”
How investors profit from the disconnect is varied. It is not for me to say who is better or worse. Rather find the way you wish to play and stick with it. If you are using squiggly lines (as discussed earlier and is the premise of this weekly contribution) then a stock either heads northeast, stays on the horizon or heads southeast. (BTW Northeast is the better of the three)
So now to SNL and no one can deny their high quality , My only issue has been liquidity where the stock doesn’t trade enough for me to get interested. But it is a regular in the Shine Zone and as no one wants to sell it, so it keeps going up. Especially as there has been minimal capital raised over the last five years.
If only the charts of any stock I bought looked like this. It looks even better over a longer time period! It's now close to all time highs and with minimal volatility. Part of that is due to the large amount held by related holders and the other part due to a lack of liquidity. So yes, it's a good business. And for as long as the price stays above $14.11 the chart agrees as well.
If that drawdown is too great from you at current prices, look for short term structural support at $17.57. As for the upside, being at all time highs its blue sky.
ASX:MAD - Madar
StockRank 66
Momentum Rank 71
QM Rank 88
VM Rank 45
A$6.60
A member has asked about Mader (ASX:MAD) and it’s not the first time it has been talked about in this forum. In fact we last covered MAD from a momentum perspective back last month (Please read the discussions section for more detail)

ASX:MAD 1 year Daily chart
The rule is I normally don’t cover stocks within two months of one another and MAD is an example why. Please read my previous coverage on them as it hasn’t changed. I have only brought them up here so for those who miss reading the blurb at the top where we highlight this point.
The daily activity on Thursday is hopefully the moment we have been waiting for. We shall see.
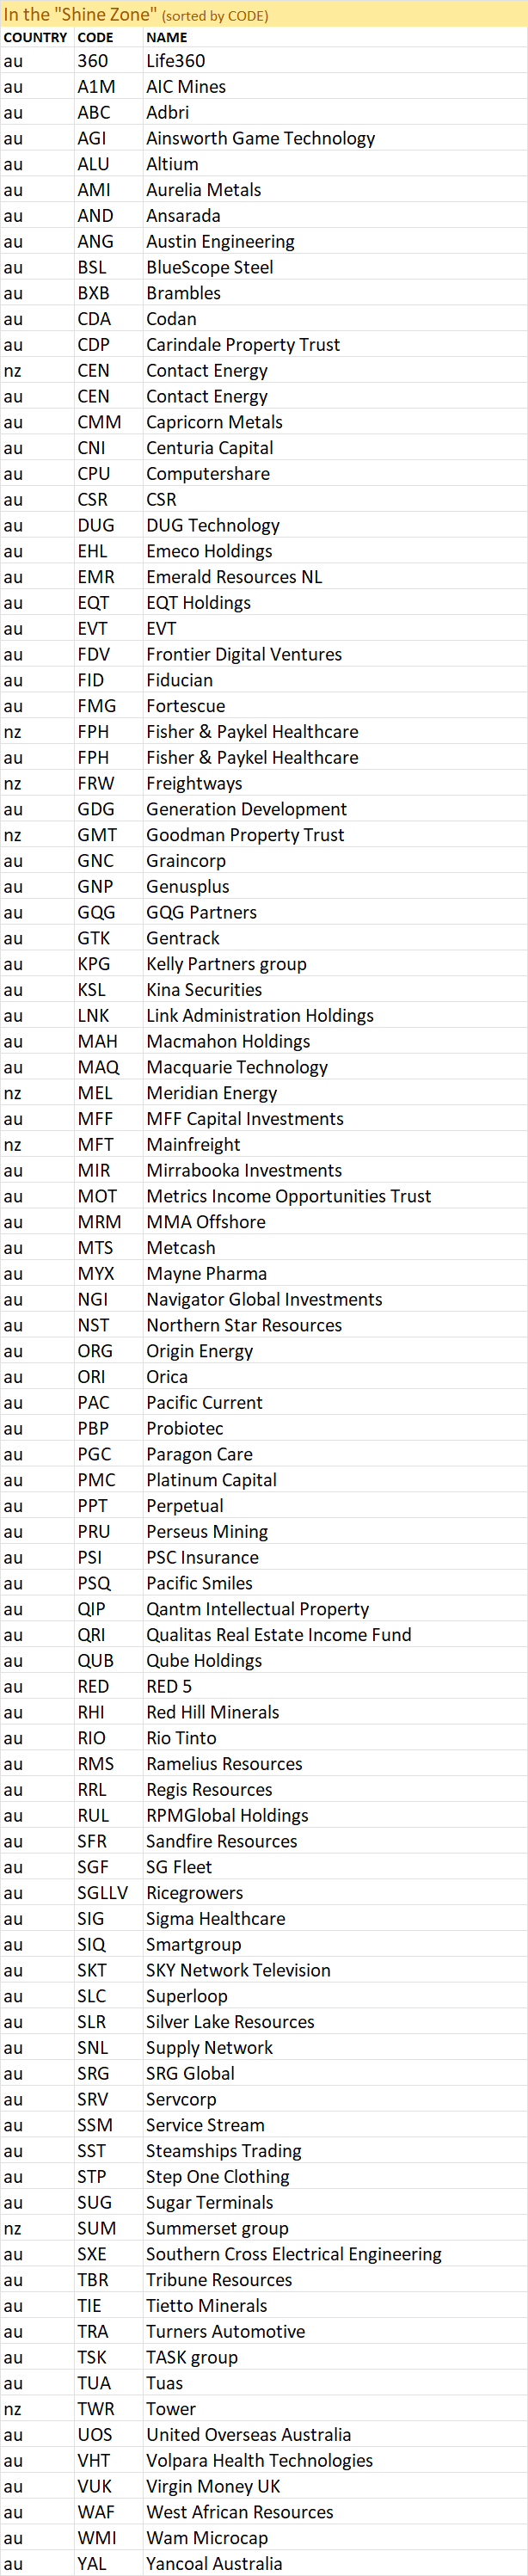
Stocks in the Shine Zone
To learn about the Shine Zone and how to use it, you can read it here.
The rules for inclusion in this list are based on those I like to see in a stock before considering a trade in it:
QM Rank above 80
Price is above the 2.5x ATR
50d MA is above the 200d MA
Price is greater than the 200d MA
Market cap greater than $200M
This is a very important point: the “Shine Zone” are rules for possible buying. They are not for holding and/or selling. If a stock falls out of the shine zone, use support levels to set your stops, or instigate a parachute stop if necessary. With markets moving sideways, one expects frequent changes in these lists.
If you feel there is a stock that should be included but is missing please let us know. This is a manual process and occasionally one gets through the cracks
Also look at the market capitalisation and liquidity before making any decisions!
Data is at 20 April and is sorted by the stock code.
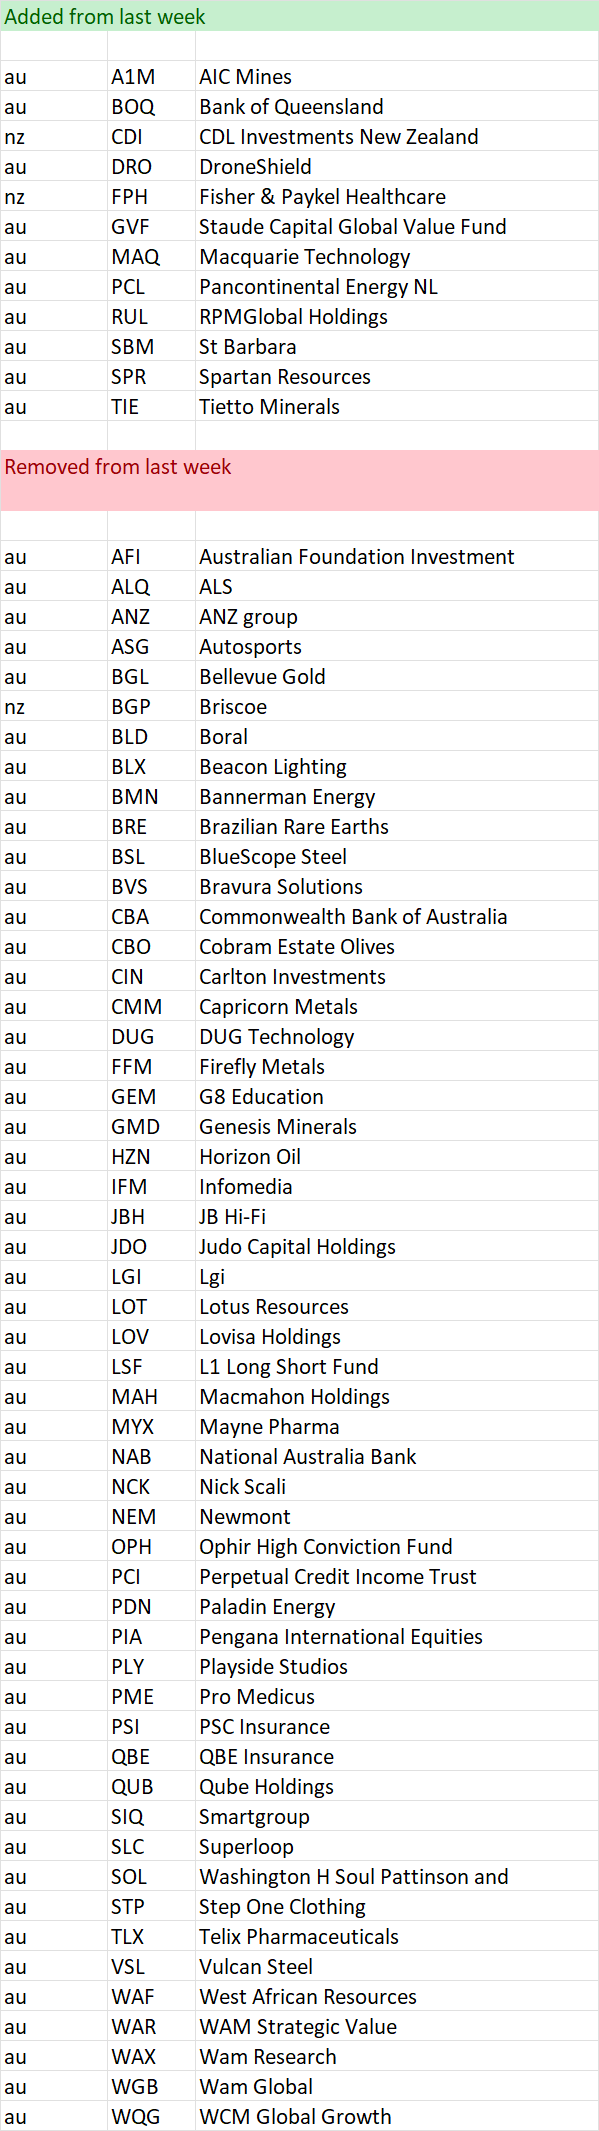
Changes from last week
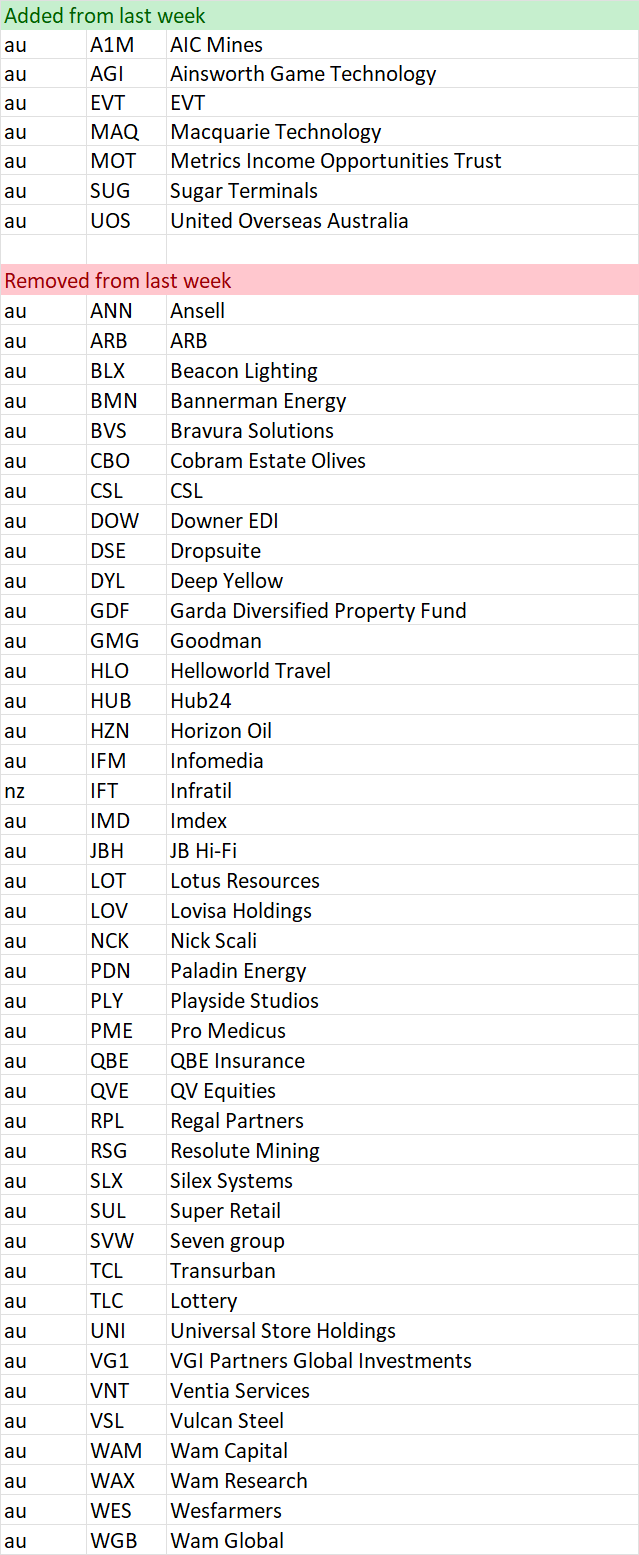
Shine Zone list as at 20 April
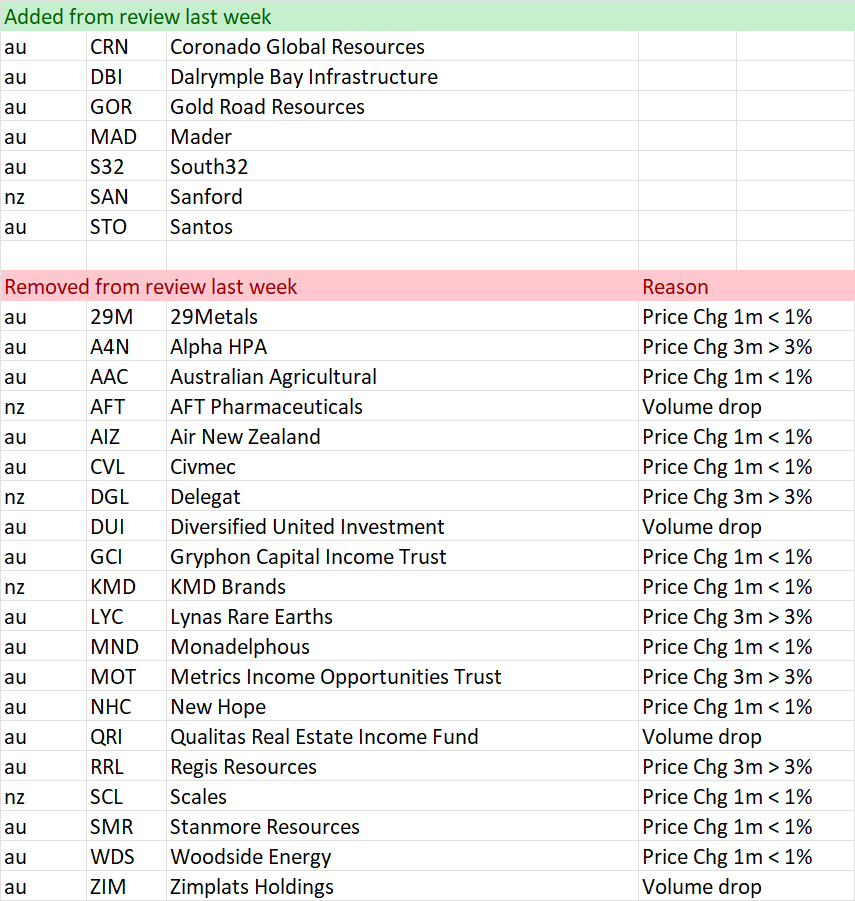
“Bus pulling out of the station”
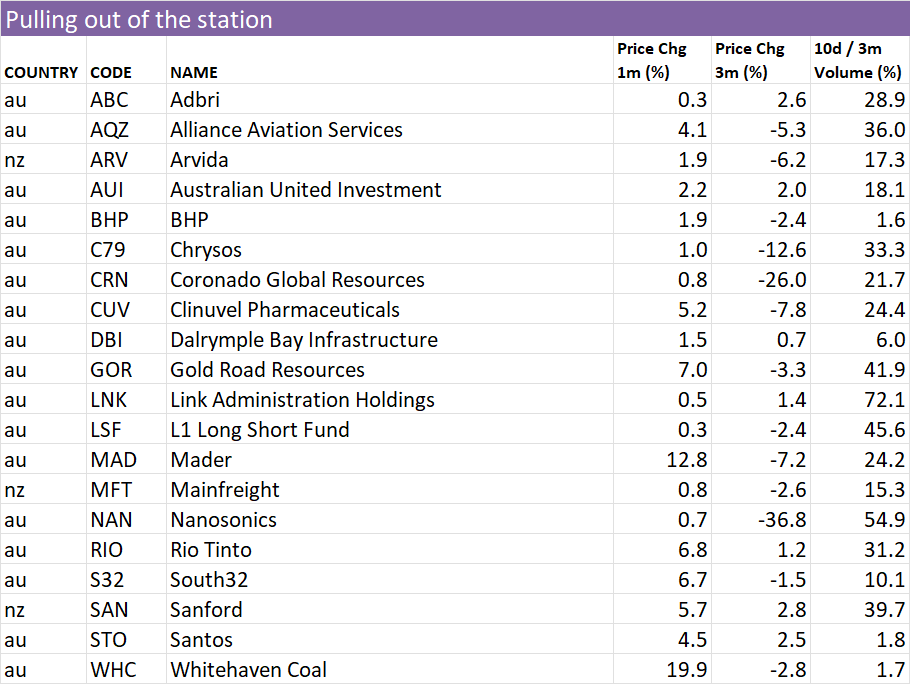
To learn more about this screen read the following article on the objective of the screen
Here is a shortcut in understanding the reasons why a stock is removed:
Volume drop = Bus might be moving, but no one is on it
Price 1 mth < 0% = Bus has been cancelled
Price 3mths >= 3% = Bus has pulled out of the station
Also look at the market capitalisation and liquidity before making any decisions!
Data is at 20 April and is sorted by the stock code.
Changes from last week
“Pulling out of the station” on 20 April
52 week high screen
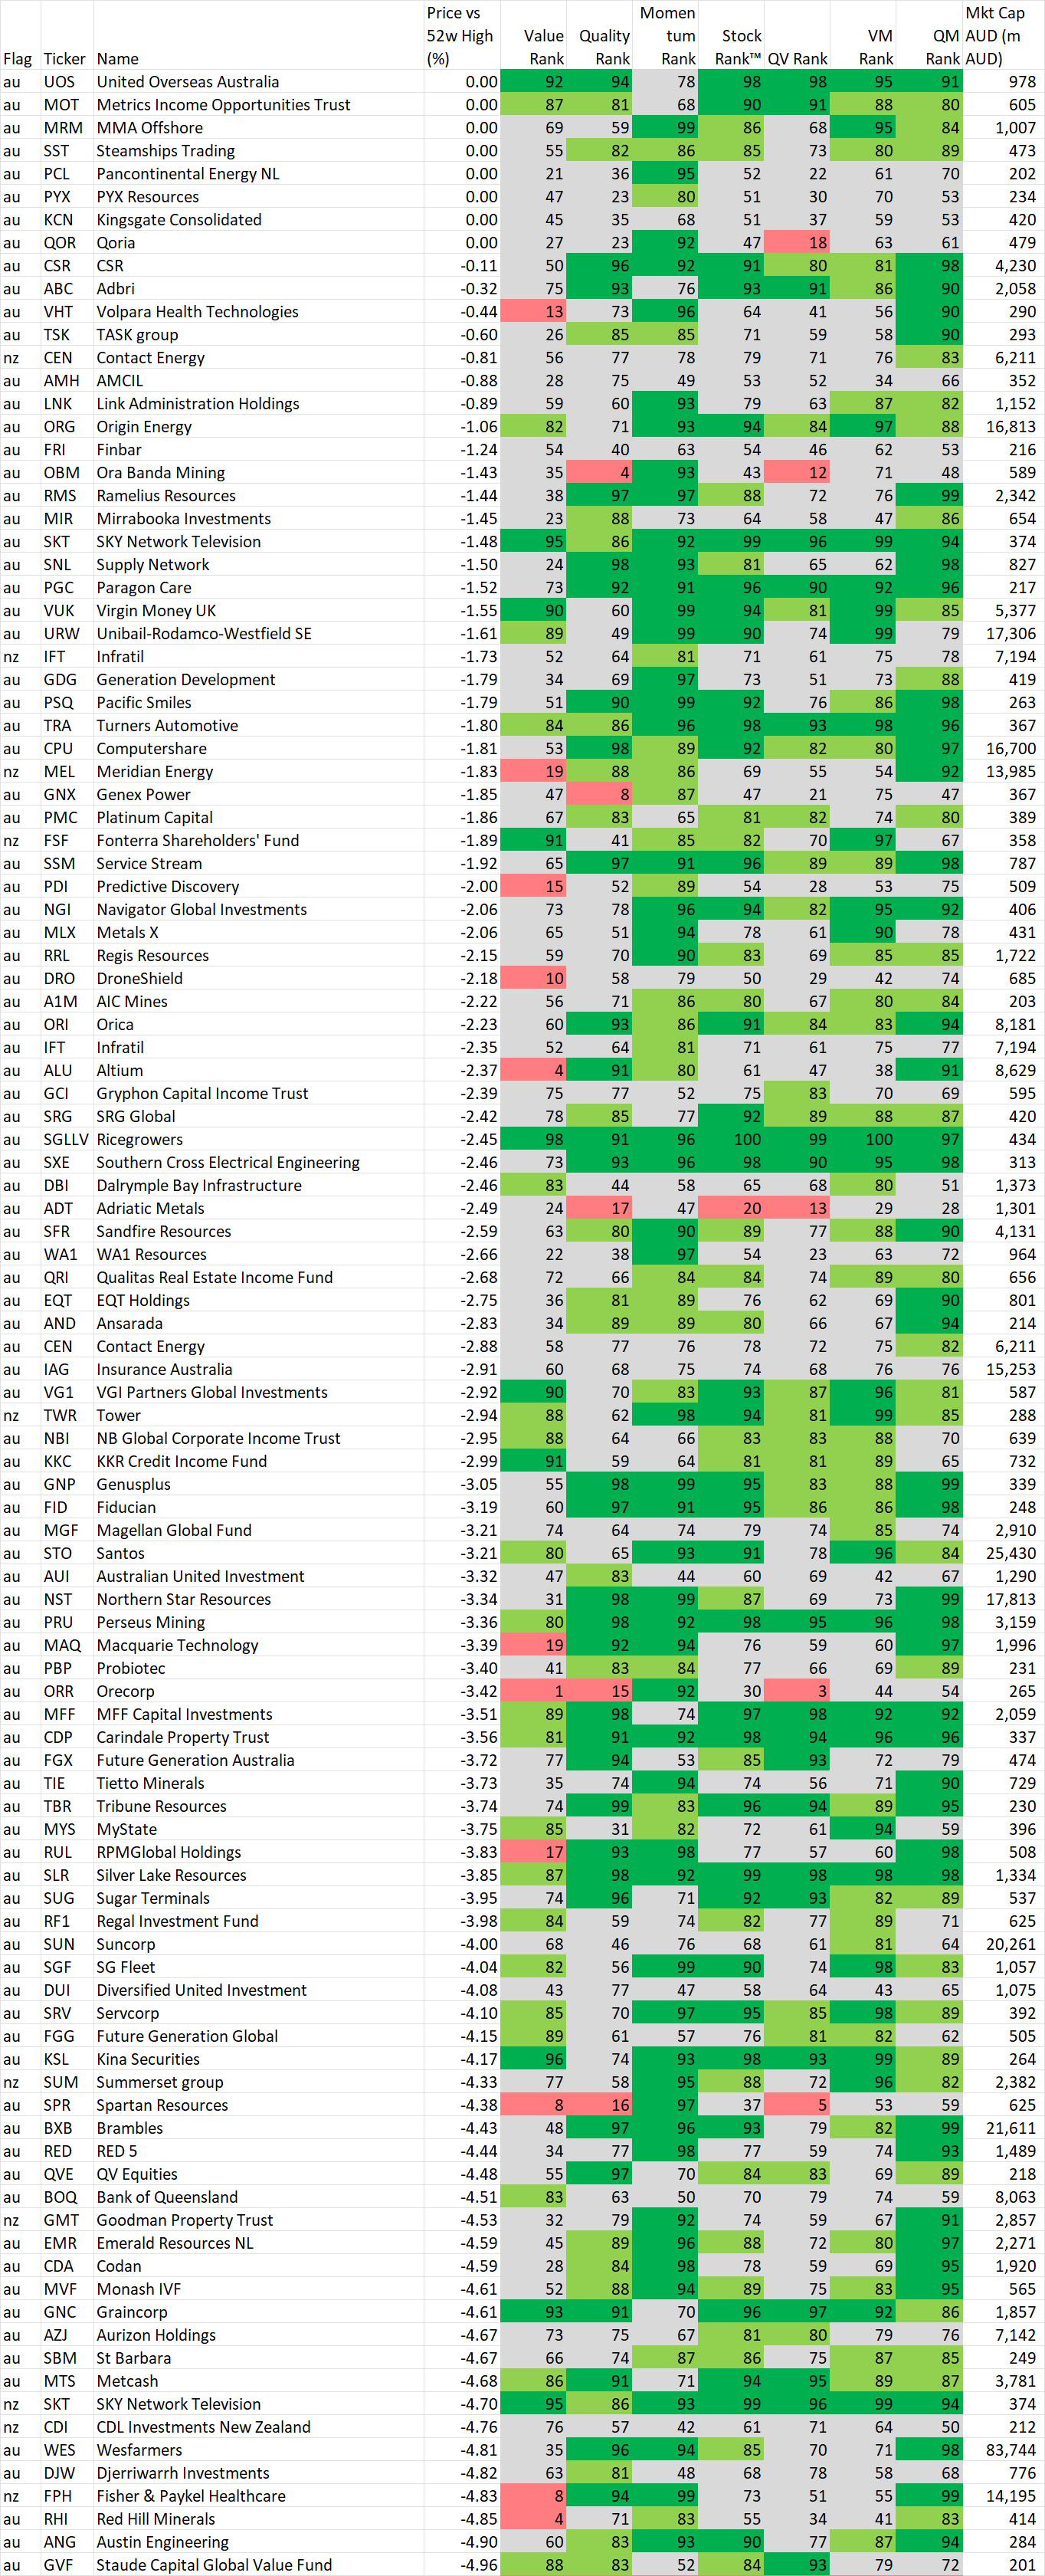
In this section we identify stocks within 5% of their 52 week intraday high based on the idea, supported by academic studies, that stocks close to their 52 week highs tend to outperform. Weekly changes to the list will also be noted.
If you wish to recreate this screen in the screener select "Price vs 52 high" greater than -5% and Mkt Cap greater than $200M
A stock coming onto the list is NOT an automatic buy, just as a stock that leaves the list is NOT an automatic sell. As with the shine list, assess every chart on its merits. However movements on this list may alert you to interesting charts so be sure to look at Stockopedia and the chart first.
Data is at 20 April and is sorted by the stocks closest to their 52 week intraday high.
Also look at the market capitalisation and liquidity before making any decisions!
And remember, past performance is no guarantee of future performance.
Changes from last week
Stocks within 5% of their 52 week high as at 20 April
Important Information: Stockopedia Ltd ABN 39 757 874 670 UK business registration number 0637267 (“Stockopedia”) is an Authorised Representative of Daylight Financial Group Pty Ltd ABN 77 633 984 773 (“DFGPL”) which is the holder of an Australian Financial Services Licence (AFS Licence No. 521404).
Information in this commentary is current as at date prepared unless otherwise stated. However, please bear in mind that investments can go up or down in value, and that past performance is not a reliable indicator of future performance. For more Important Information please refer to the Disclaimer section of this website.
This communication may contain general financial product advice. It has been prepared without taking into account your personal circumstances, and you should therefore consider its appropriateness in light of your objectives, financial circumstances and needs before acting on it.
If our advice relates to the acquisition or possible acquisition of a particular financial product, you should obtain a copy of and consider the Product Disclosure Statement (PDS) before making any decision.
The author holds interests in companies listed in the data tables . This position can and will change at any time without notice.
Disclaimer
This is not financial advice. Our content is intended to be used and must be used for information and education purposes only. Please read our disclaimer and terms and conditions to understand our obligations.
1 comment
Back in January you noted that for Duratec (ASX:DUR) (I hold) “everything changes if it goes below $1.09”.
Well we are now back at $1.00 and yet I have not seen anything bad about the company which has a cash rich balance sheet, strongly growing sales (if slightly behind previous estimates) and a well covered dividend. But nothing seems to arrest a continuing downward shift in the stock price. It would be interesting to hear what the local image problem is based on.