Momentum Monday 24th April

Our offices will be closed as a mark of respect for ANZAC Day. We will resume business as usual on Wednesday.
I want to start with a point of clarification. Following a number of discussions with members recently, there are many that perceive that now I am a 100% technical trader. This assumption is INCORRECT. Just like Stockopedia caters for different investment styles, so too do I manage different portions of my portfolio in different ways.
I write Momentum Monday to satisfy the needs and demands of our members who are more Momentum focused. The majority of our other articles during the week, including those from the global team, cover many other different styles.
It’s important to clarify that we are not dogmatic in our approach. Stockopedia is a very powerful tool in the hands of investors that wish to remain fully informed. We are transparent, honest and most of all committed to providing the tools you need to be successful - no matter how you like to invest.
That is why we are growing our footprint amongst serious DIY investors here in Australia. If you feel that there is someone who may be interested in learning a little more about us, then feel free to send them this link https://why.stockopedia.com/az-newsletter-signup/ where they can sign up for our FREE fortnightly newsletter.
Note: There is no need for you to sign up, because you receive all the full copy of our content LIVE as we publish it. The newsletter only includes summaries of some of the topics talked about.
As always our Momentum Monday is broken into three sections:
Broader market sentiment
Stocks of Interest
52 week high screen
You don’t have to read all of it. We have broken up this report into three distinct sections so you can go to the topic you prefer.
As an aside, we will be taking a review of this regular contribution (Don’t worry…. We won’t make it longer)
If you have any feedback please feel free to write it within the comments section below (Don’t worry, with my upbringing and diet, my shoulders are broad enough to cope.) While I can’t promise all suggestions will be included, they will be considered seriously. So if you prefer to see something else from a Momentum perspective, tell us. (I can’t read minds….yet)
Broader Market Sentiment
JUST A REMINDER: I do not use the market charts to make decisions as to when to buy or sell stocks. I will always use a stock’s individual chart to do that. However, I do look at the market charts to get a sense as to how aggressive/cautious I can be when trading/investing individual stocks.
S&P500
I wish to more to report with S&P500, but a flat week means not much has changed with all relevant levels still in play.
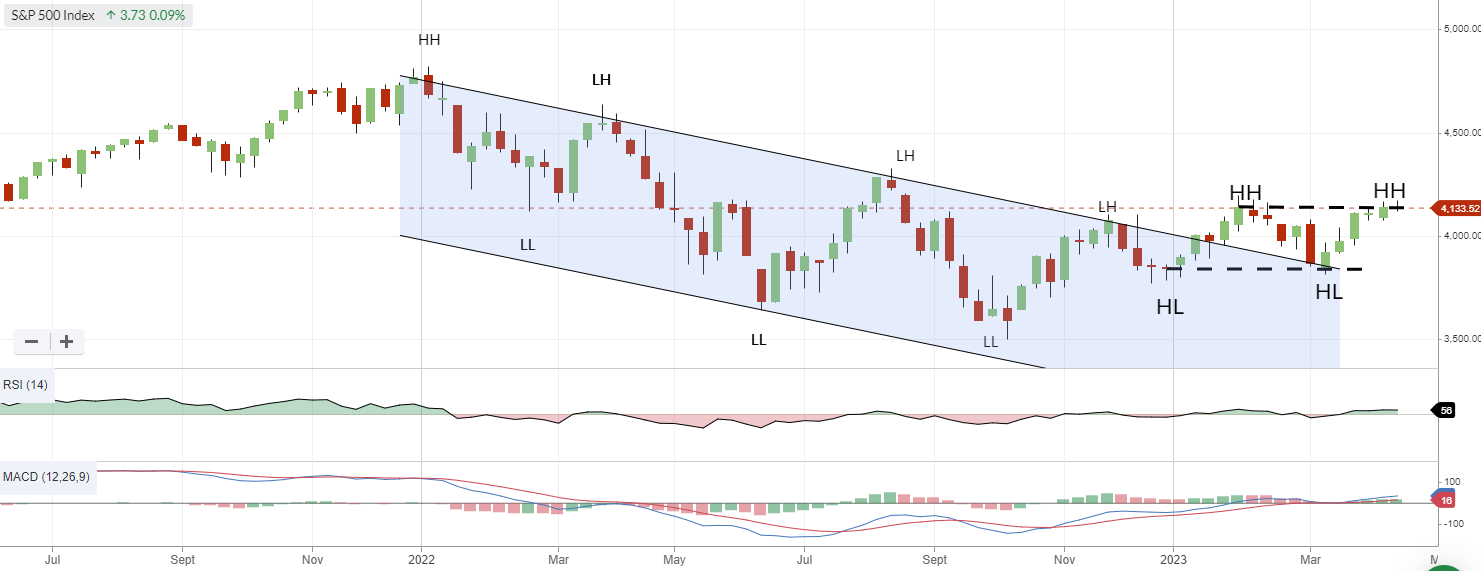
S&P500 Weekly chart
Last week we touched on the 4180 level I would like to see broken. Closing the week at 4133.5 down 0.1% for the week, we still wait before we change the dial on any bullishness. But with the RSI above 50 and MACD in positive territory the coming week provides enough catalysts for some clearer direction in the from Earnings Seasons which has commenced in earnest. This coming week sees the likes of Google, Amazon and Microsoft reporting so expect to see them impact sentiment.
Thus far there have been good signs from Homebuilders, HealthCare and Airlines. Fingers crossed that moment continues into the next week and re-shapes the sentiment of the previous year.
ASX200
It was a down week after three positive ones and the narrative really hasn’t changed.
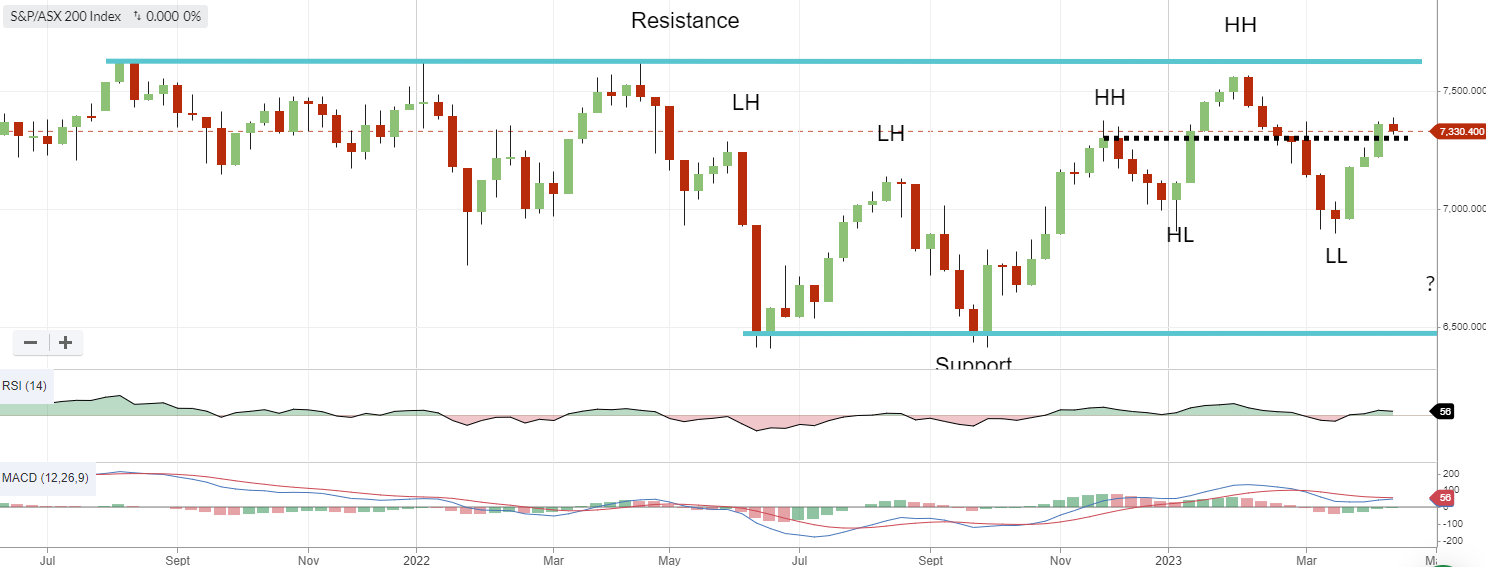
S&P/ASX200 Weekly chart
We are still relatively close to the levels of Nov 22 and we continue to watch what happens next as the market appears stable. The RSI is above 50 and the MACD is positive. Can it make a push for new all-time highs, or are we destined to remain in a sideways motion for some time yet? This is an emerging Head and Shoulders reversal pattern, or will it be a retest of all-time highs?
I am not sure. Though I continue to invest for now and while every urge is telling us to be wary, I am going to participate in markets from a Momentum perspective for those charts that remain solid. A look at the 52 week high list below are a sample of some.
From an education perspective, there were two large events this week that received much media coverage and many would normally expect would have impacted sentiment.
The new RBA undermining the past implying it has been deficient
NWS reaching a massive settlement, having to pay A$1.2B to dominion for the misdemeanors of its Fox Network
In regards to point one, the largest shake up to our Central Bank in the last 40 years, being made, by inference, that it was due to the shortcomings of the RBA. Despite this lack of confidence in the team that hold the keys to the printing press, the market finished flat that day.
In the case of the later reports, surfacing that Fox had struck a settlement with Dominion over its claims that the voting machines we rigged (which they weren’t) leant may to decry the value of NewsCorp and its 92 yearold Chairman Rupert Murdoch - yet the stock finished flat in Austral, and actually rose in US trade.
These are examples of why while I notice such events, I don’t trade based on them as the price will tell me how to interpret them. For example, CoreLogic released stats that showed house prices in Sydney and Melbourne rose +0.9% and 0.1% respectively in April. This after official cash rates have risen from 0.1% in April 2022 to 3.6% in April 2023 . Assuming pull pass on of rates, that is a 3,500% increase in the cost of buying a home per annum… yet the prices of houses have GONE UP! Obviously the shortage of available housing and builders going broke has an impact… but predictions are a bit of a mugs game.
Then you have Friday where we learnt of BHP’s underwhelming result, plus news that stock piles of Iron Ore are building at Chinese ports, plus PMI figures which showed a continued expansion in business activity meaning a rate rise is coming. Those events were attributed to the negative close of the market? Were they the real reason? I don’t know. All I know is more people wanted to sell that day than buy. And while the narrative may be convenient and may have contributed to some selling… Let's just say I would rather trade the effect, and write about the cause. I am digressing again!
______
Stocks of Interest
Any requests?
If there is any company you would like to see written about you are most welcome to include it in the comments section below and we will attend to it in the coming weeks.
Tip: if you look at the list on the right hand side you will see the stocks mentioned within this week's contribution.
Author note: In line with the approach I am using with Stockopedia, I will focus the majority of my attention to stocks with a QM rating above 80 and market cap above $500M. For those who may be new to this report please read the last instalment of my momentum journey. I will discuss where their charts presently sit to provide context for potential and current investors. You can revisit the series of articles by clicking on the links at the start of this article.
These stocks are considered purely for the purposes of education - THIS IS NOT A TIP SHEET. Be sure to read all relevant commentary to understand the context from which a chart is presented. It’s not always positive!
ASX:BOQ Bank of Queensland. QM Rank 53 A$6.04
This is not a stock that meets the QM rank criteria of 80+ that is normally required to be included, however Bank of Queensland (ASX:BOQ) is topical because of the sector it is in, the fact it delivered a recent result, and its a good reminder of support levels and how important they are from a Momentum perspective,
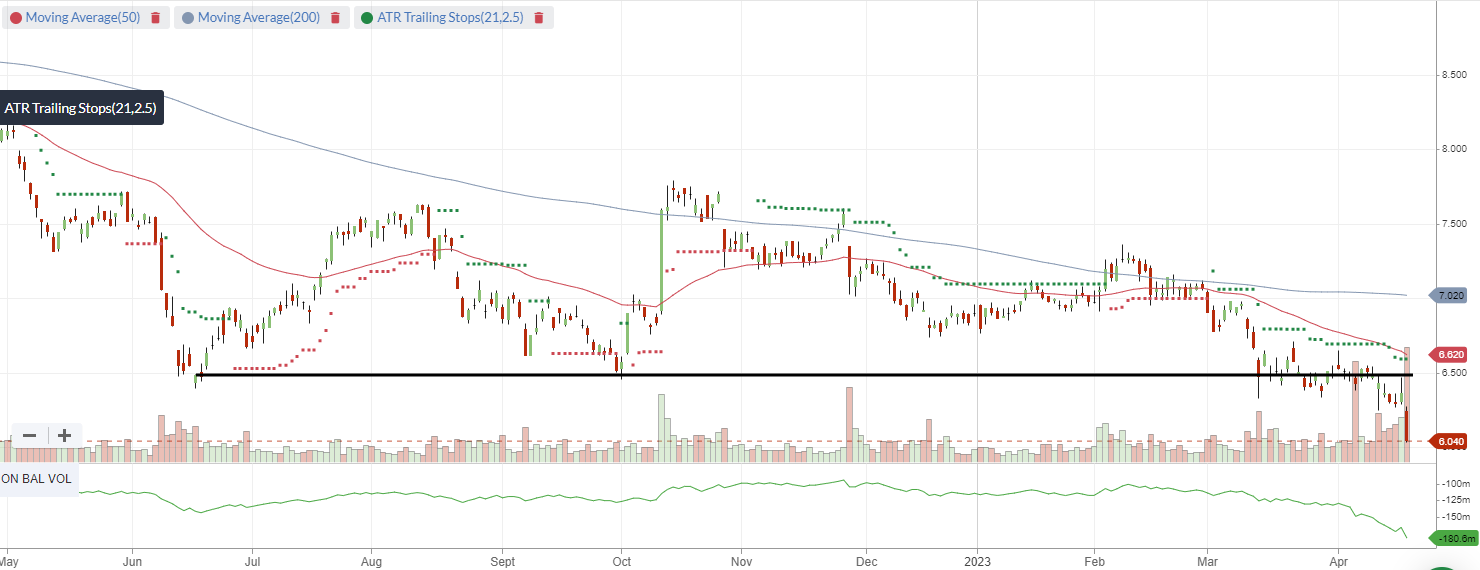
ASX:BOQ 1 year Daily chart
BOQ has been in a long term downtrend extending beyond the previous 12 months. Not only is price below the ATR, and also the 50 day and 200 day EMA, but it also broke a key level of support of $6.39 from June 2022.
While there may have been some that were encouraged by the bounce in the price in October 2022, the subsequent price moves offered investors lots of opportunities to get out prior to Friday. The price even broke below structural support last month.
There is a lot of work for BOQ to do before we see price return to positive momentum.
ASX:RRL Regis Resources. QM Rank 96 A$2.14
As previously discussed a number of Gold stocks have presented with good looking charts, though one which had a disappointing week was Regis Resources (ASX:RRL)
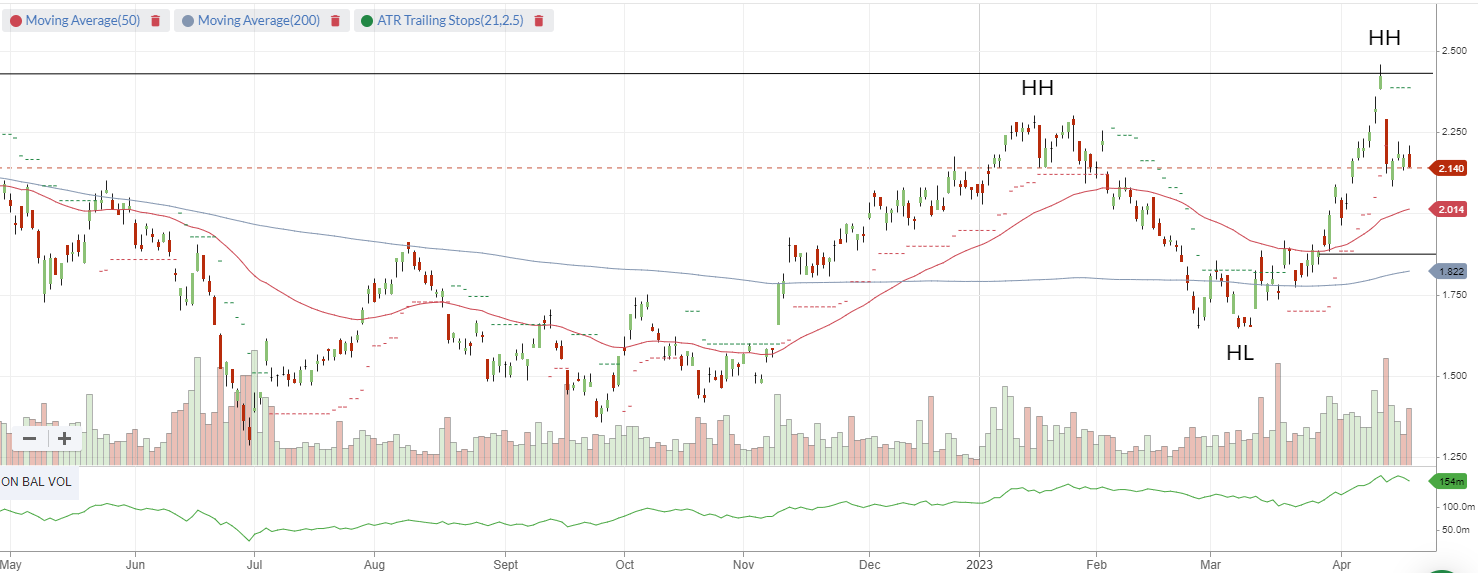
ASX:RRL 1 year Daily chart
The company has been in a long term downtrend and while their quarterly update obviously disappointed, there are some interesting things on the chart to observe. For example, the push on the 14 April took us back to the minor peak in April 2022, creating a clear line of resistance as price was unable to break through it. Further, the pull back still sees it above its moving averages, OBV remains strong and we have not created a lower low as of yet. So the short term recovery remains.
While the price has fallen below the 2.5x ATR, for those who remain bullish on Gold, this may be a set up that we are waiting for. A run followed by a pullback and hopefully a run again. I say hope because if the gap at $1.895 is filled and it fails to hold that could be an appropriate stop loss level.
For those who want a little more comfort a rise above $2.43 would break resistance and see the price back above ATR 2.5x. Then wait for a mild pullback and then consider. Of course much of this will be dependent on what gold price movements do from here.
Which leads into another point, while gold prices will be important in directing sentiment, do not mistake investing in gold stocks as being pure gold price plays. Gold miners have operations to conduct, costs to pay and risks to manage. They are more leveraged to the gold price because of it (ie they tend to go up more when the gold price is rising, but they fall more when the gold price goes the other way.) RRL is a case in point this week with their production downgrading seeing a big fall on the day.
ASX:ATA Atturra. QM Rank 98 A$0.93
Falling outside my usual screens as Market Capitalisation is less than $500 Million, a member has asked for an assessment on Atturra (ASX:ATA)
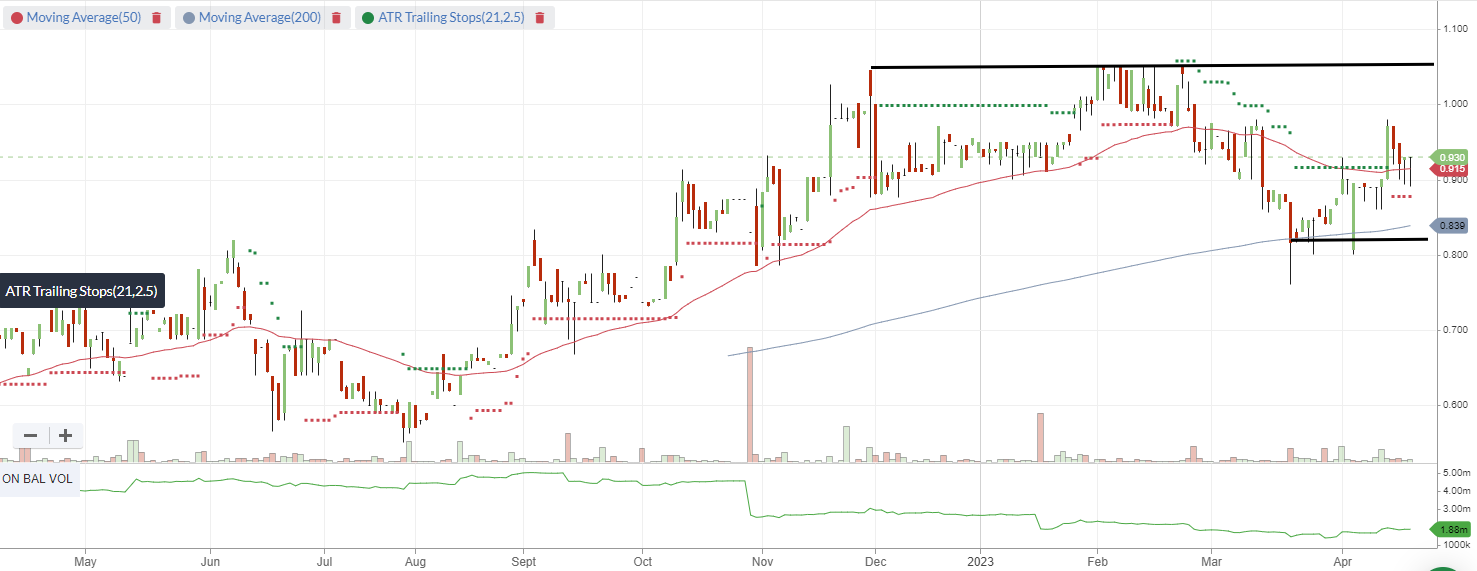
ASX:ATA 1 year Daily chart
The IT services stock is relatively newly listed and has gone in the right direction since the IPO delivering solid updates, including a recent small upgrade on prospectus targets.
From a price perspective it's all time high of $1.05 appears to be a very important level as it was tested and failed a number of times. Personally would like to see a break above that level before considering.
Support is the low close of March at $0.815. A break below that level would be the stop loss at current levels.
Investors will note that the daily bars for ATA can seem quite large. This is symptomatic of a stock not heavily traded (low volume) with quite large spreads in price. Traders need to consider this when looking to establish a position, as getting in and out at a fair price will be difficult if sentiment shifts one way or another.
ASX:TPC TPC Consolidated. QM Rank 89 A$2.60
To that end another stock requested by a member was TPC Consolidated (ASX:TPC) however as the stock doesn’t trade barely at all it really is not appropriate for a Momentum Monday article. Rather it needs to be assessed on other metrics for a stock where a multi-year holding would be required.
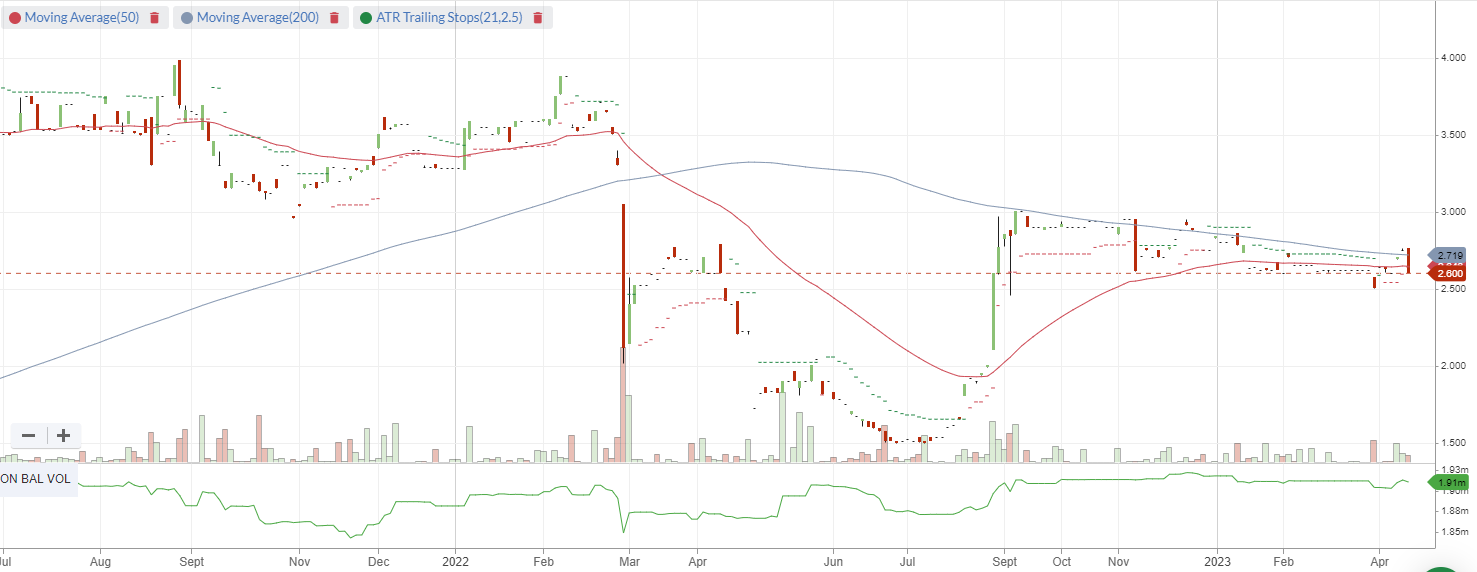
ASX:TPC 1 year Daily chart
ASX:EQT EQT Holdings QM 80 rank A$27.00
Keeping with the theme of illiquid stocks, one that has scraped into the filter this week on account of the recent recovery in price is EQT Holdings (ASX:EQT). While not shooting the lights out on either Quality or Momentum, combined they were sufficient for an 80 score.
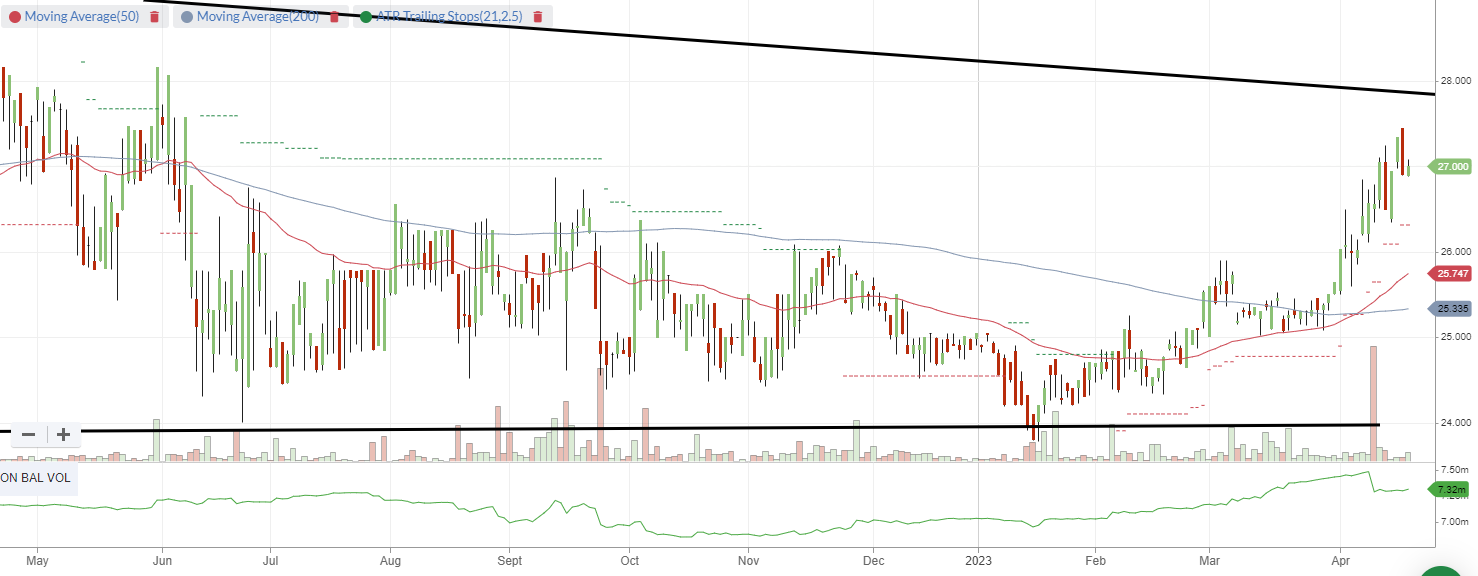
ASX:EQT 1 year Daily chart
The company has been in a sideways move (with a slight downward bias) for the last few years, however over the past 12 months, the price has stabilised. It appears to have found a floor just below $24, and the recent recovery see’s the price just below a downward trend line which can be drawn from the peak of November 2019. While a break above the trend line “does not guarantee” a change in trend, it does provide some comfort that the worst of the selling may be over.
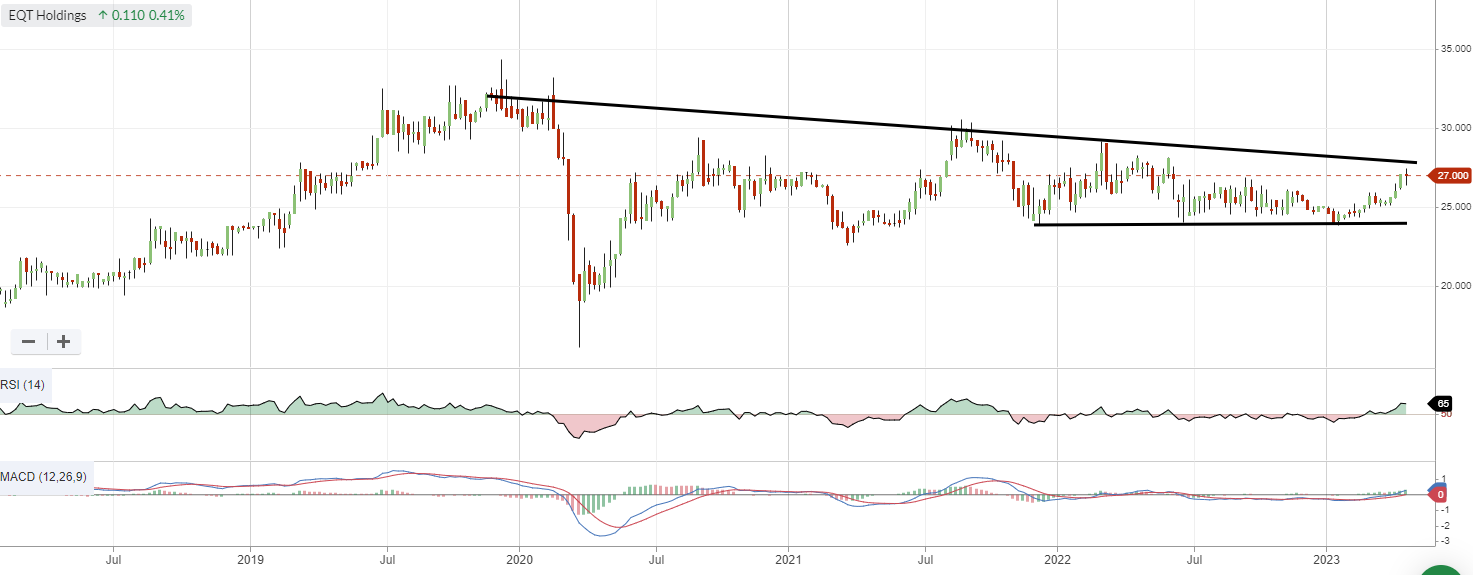
ASX:EQT 5 year Weekly chart
But again, traders will notice the big bars EQT exhibits which again implies low levels of trade and big spreads. Again with stocks like these they don’t lend them self to trading short-term. From a long-term trade perspective there is still more work to do though the early signs are encouraging for those looking to invest a parcel inline with liquidity. (Though I would like to see a break above $27.82 first.)
ASX:WHC Whitehaven Coal. QM Rank 85 A$7.38
A stock last discussed in February, and one that I have watched keenly is Whitehaven Coal (ASX:WHC)
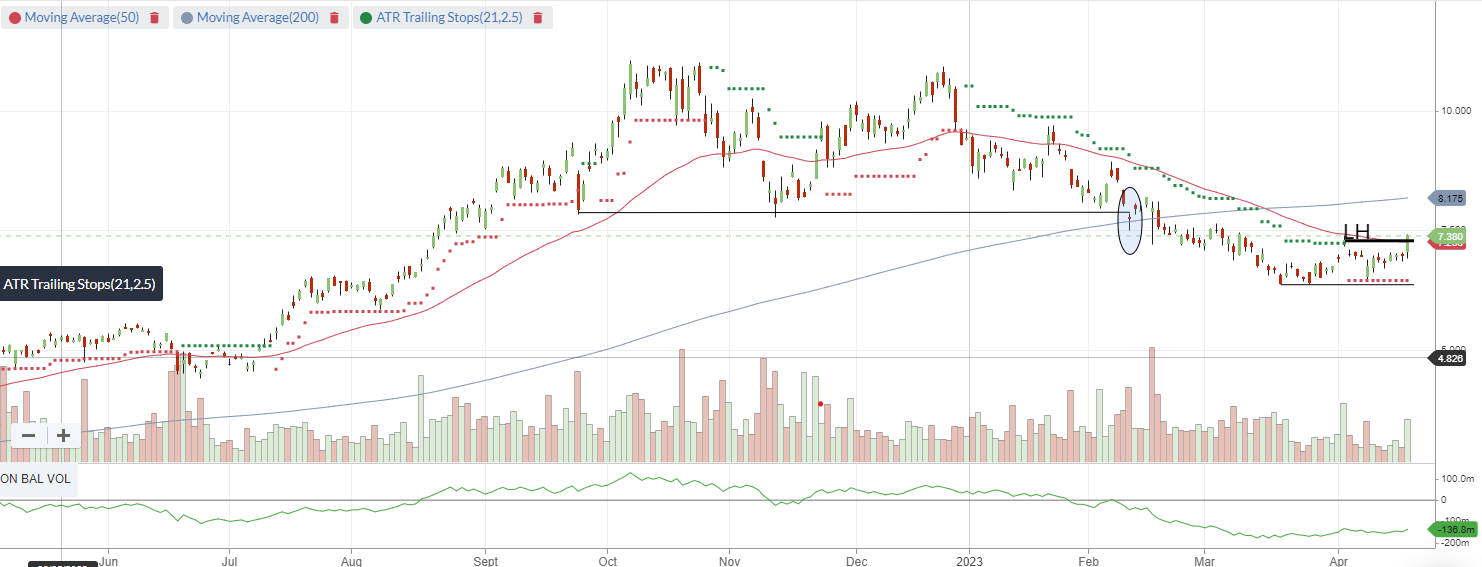
ASX:WHC 1 year Daily chart
I mentioned at the time why I had sold it, but I was keen to re-enter at some point and it looks close to that point now.
After reaching a low of $6.35 the price has since recovered and on Friday crossed above the short term lower high of $7.28.
I will likely be back in if I get the chance to buy a little cheaper (ideally around $7.28). That will bring me closer to a potential stop loss which is obviously $6.35 (at that entry point, price would have to fall 15% to breach it)
ASX:BSL BlueScope Steel. QM Rank 99 A$20.70
Two months ago we discussed BlueScope Steel (ASX:BSL) noting the bounce off support, closing the gap created at the time of the result, and since then we are glad to report a series of higher highs and high lows sees this stock in an entrenched short-term uptrend.
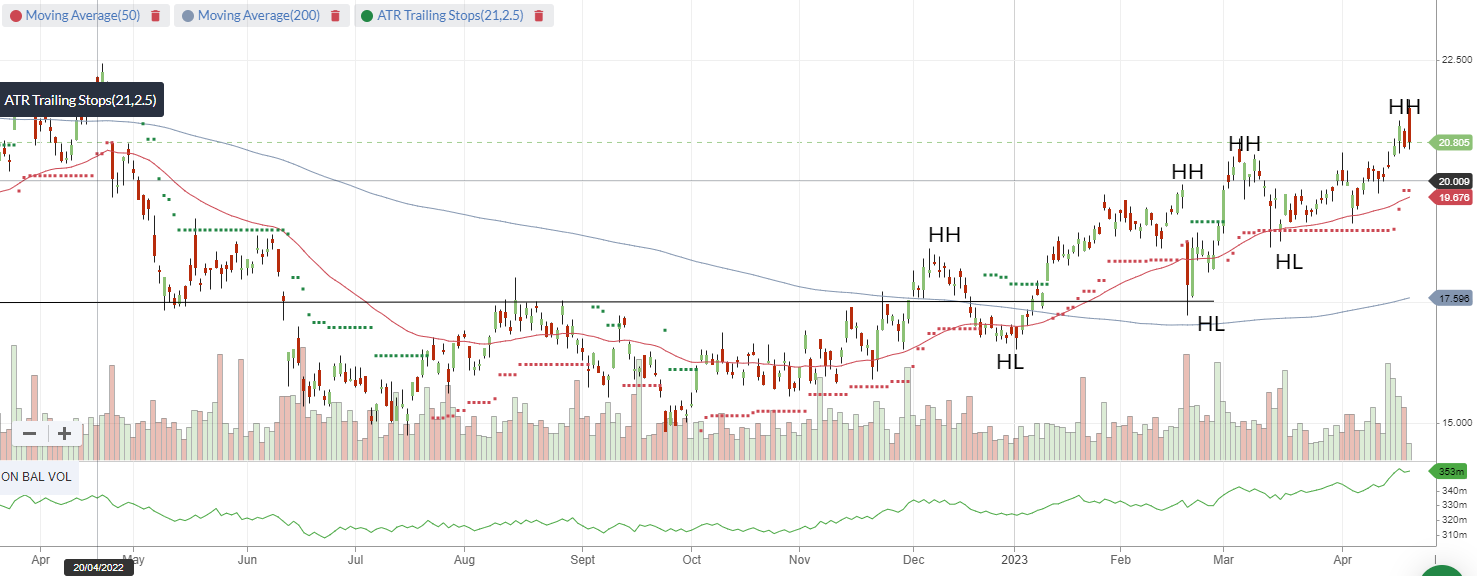
ASX:BSL 1 year Daily chart
As previously discussed, there is a bit of work to do still to get to the highs of $25.29 of August 2021, but the good news is that it is on the right trajectory with the stock hitting new 52 week highs, both 50 and 200 movings averages are going in the right direction, and price is above them. Further On-Balance Volume (OBV) in rising in line with price, and the price has been above the 2.5x ATR since last February.
Positive results from US Builders thus far this US Earnings season is helping sentiment, despite the challenging time local construction firms are having. Stp-loss would be at $19.20 for traders, $16.75 for true believers.
ASX:PME ProMedicus. QM Rank 99. A$62.80
A perennial high QM Ranking stock is Pro Medicus (ASX:PME) who we last discussed in January. Since then however, we are starting to see a stock run out of a little puff after trading at nose bleed levels for a decade (or more)
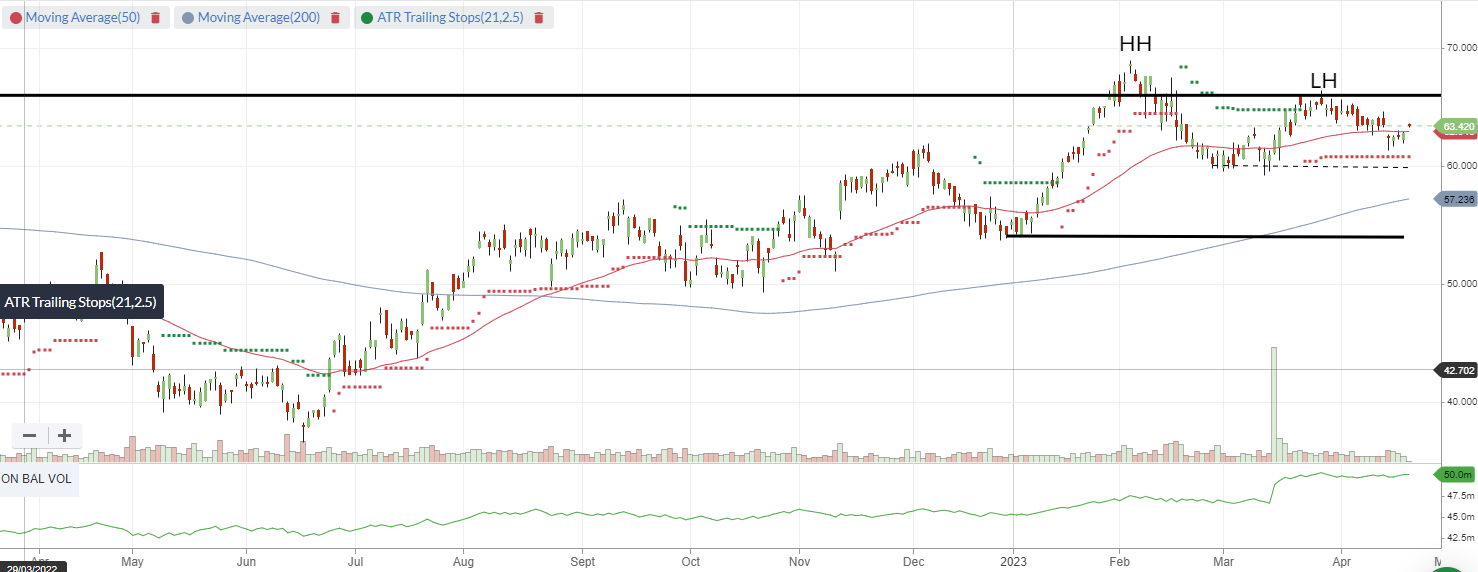
ASX:PME 1 year Daily Chart
The reality is, even if the price does pullback from these levels, it will likely remained over priced unless price cratered which I don’t believe will occur.
However, traders will be watching the $60 level closely. With recent investors into the stock perhaps giving it more space to $54.08. Either wy, it should be clear to readers in this column the potential for a downward pattern forming from here, especially as the most recent lower high coincides with the high of August 2021. Investors will hope the recent false break of February 2023, doesn’t prove to be the last gasp for a while. Personally from here, I would want to see price test all time highs again before considering an entry.
ASX:DSK Dusk. QM Rank 69 A$1.51
Chris wrote about Dusk (ASX:DSK) recently and for value investors it is a stock to looking into further. Read the Article here. From a Momentum perspective, what are we looking for?
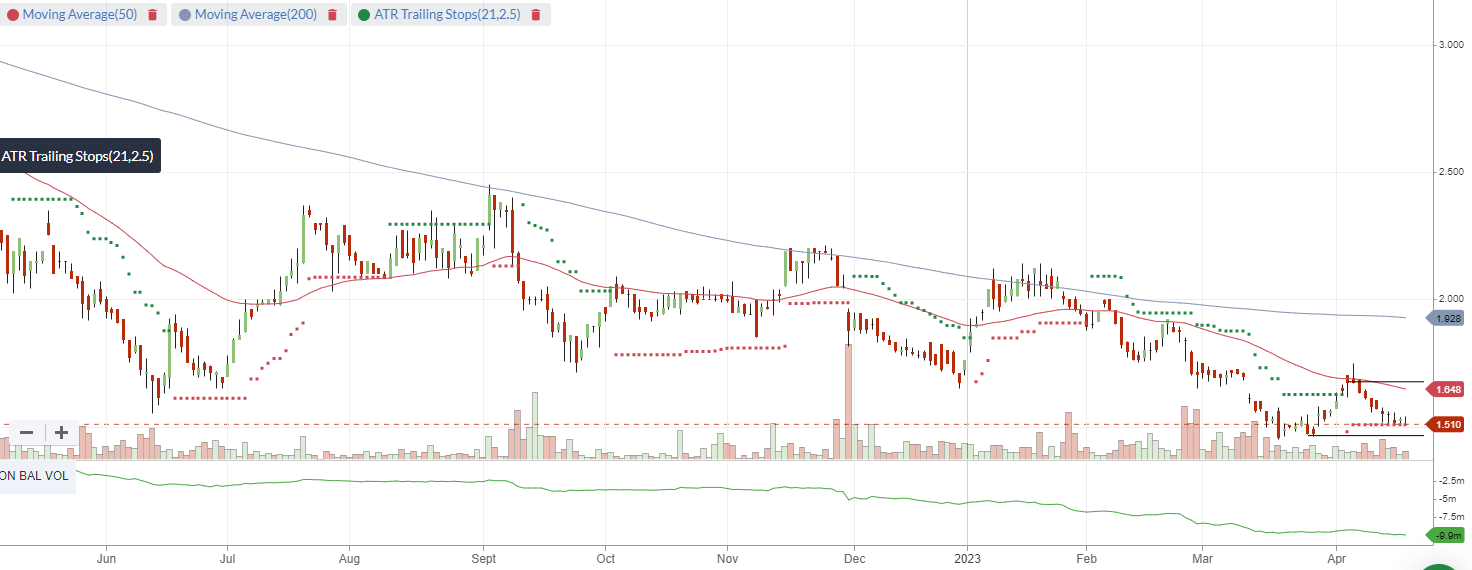
ASX:DSK 1 year Daily chart
$1.455 is the all-time low for this stock. That was last seen one month ago. From a traders perspective it needs to hold that level. That would be an appropriate stop loss level for investors using charts to time their entry and exit. “At least you won’t have to wait long to know if you are wrong.”
So when might we consider the stock? Personally I would like to see the price cross back above $1.67 as a bare minimum before considering. Even then, I would wait for the subsequent pullback and then a renewed run up. Price would need to be above the 2.5x ATR
That would still be a trade to watch closely as such pivot points from such long-term downtrends are rarely that clean, but breaking out of the series of lower highs and lower lows may be a sign that the selling of the last 2 years is abating.
ASX:ORA Orara. QM Rank 98 A$3.51
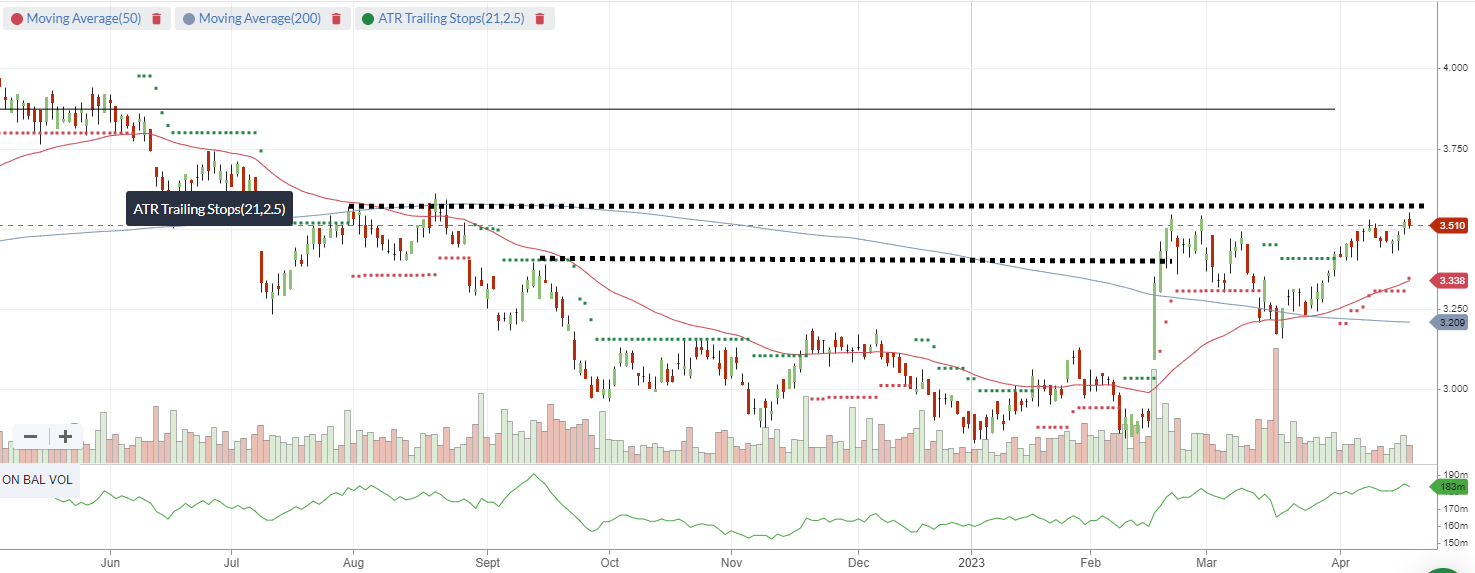
I last spoke of Orora (ASX:ORA) following the price spike in February. This is what was said, “So investors should be aware that any chopiness experience is expected and the stock will likely need a retrace before generating the strength for another push through to all time highs.”
So what have we seen since then?
ASX:ORA 1 year Daily chart
The stock has retraced, created a new higher low and is prepared for another tilt at the $3.59, meaning that it is setting up for a run to $4.
ASX:BAP Bapcorp QM Rank 90 A$6.68
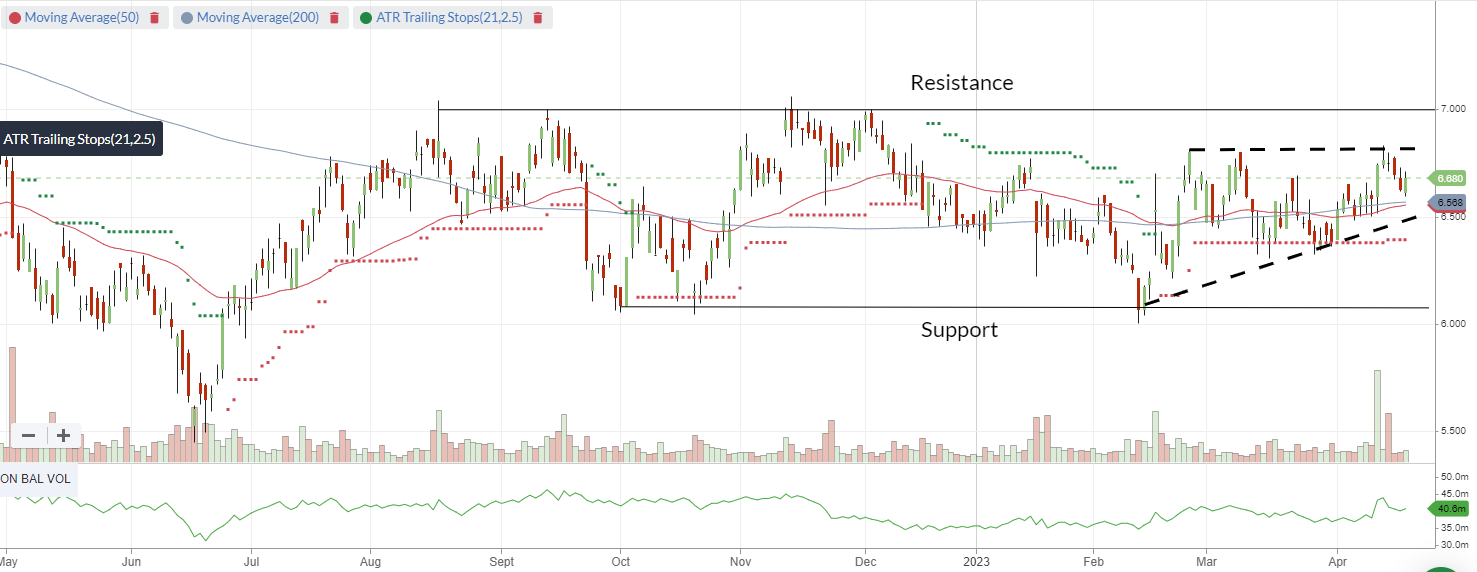
Autoparts and accessories retailer Bapcor (ASX:BAP) has seen its share price track sideways for the past six months. This following a post COVD run which saw them achieve all-time highs, to then a pull back in June 22 of around $5.50.
ASX:BAP 1 year Daily chart
Now the price is stuck in a range between $6.08 and $8 with both support and resistance lines now test a few times.
While it is too early to say which way the price will go, we can look for patterns within broader pattern for some idea as to what might happen next.
In the case of BAP one can see within the channel there is a rising triangle. While a break above or below won’t necessarily change the trajectory of the stock, a break above $6.50 (bearish) or $6.81 (bullish) will increase the probability of whether a cannell breakout will occur to the up or downside.
Whilst its too early to tell, the next moves in the very short term will govern whether it appears on our watchlist or not.
52 week high screen
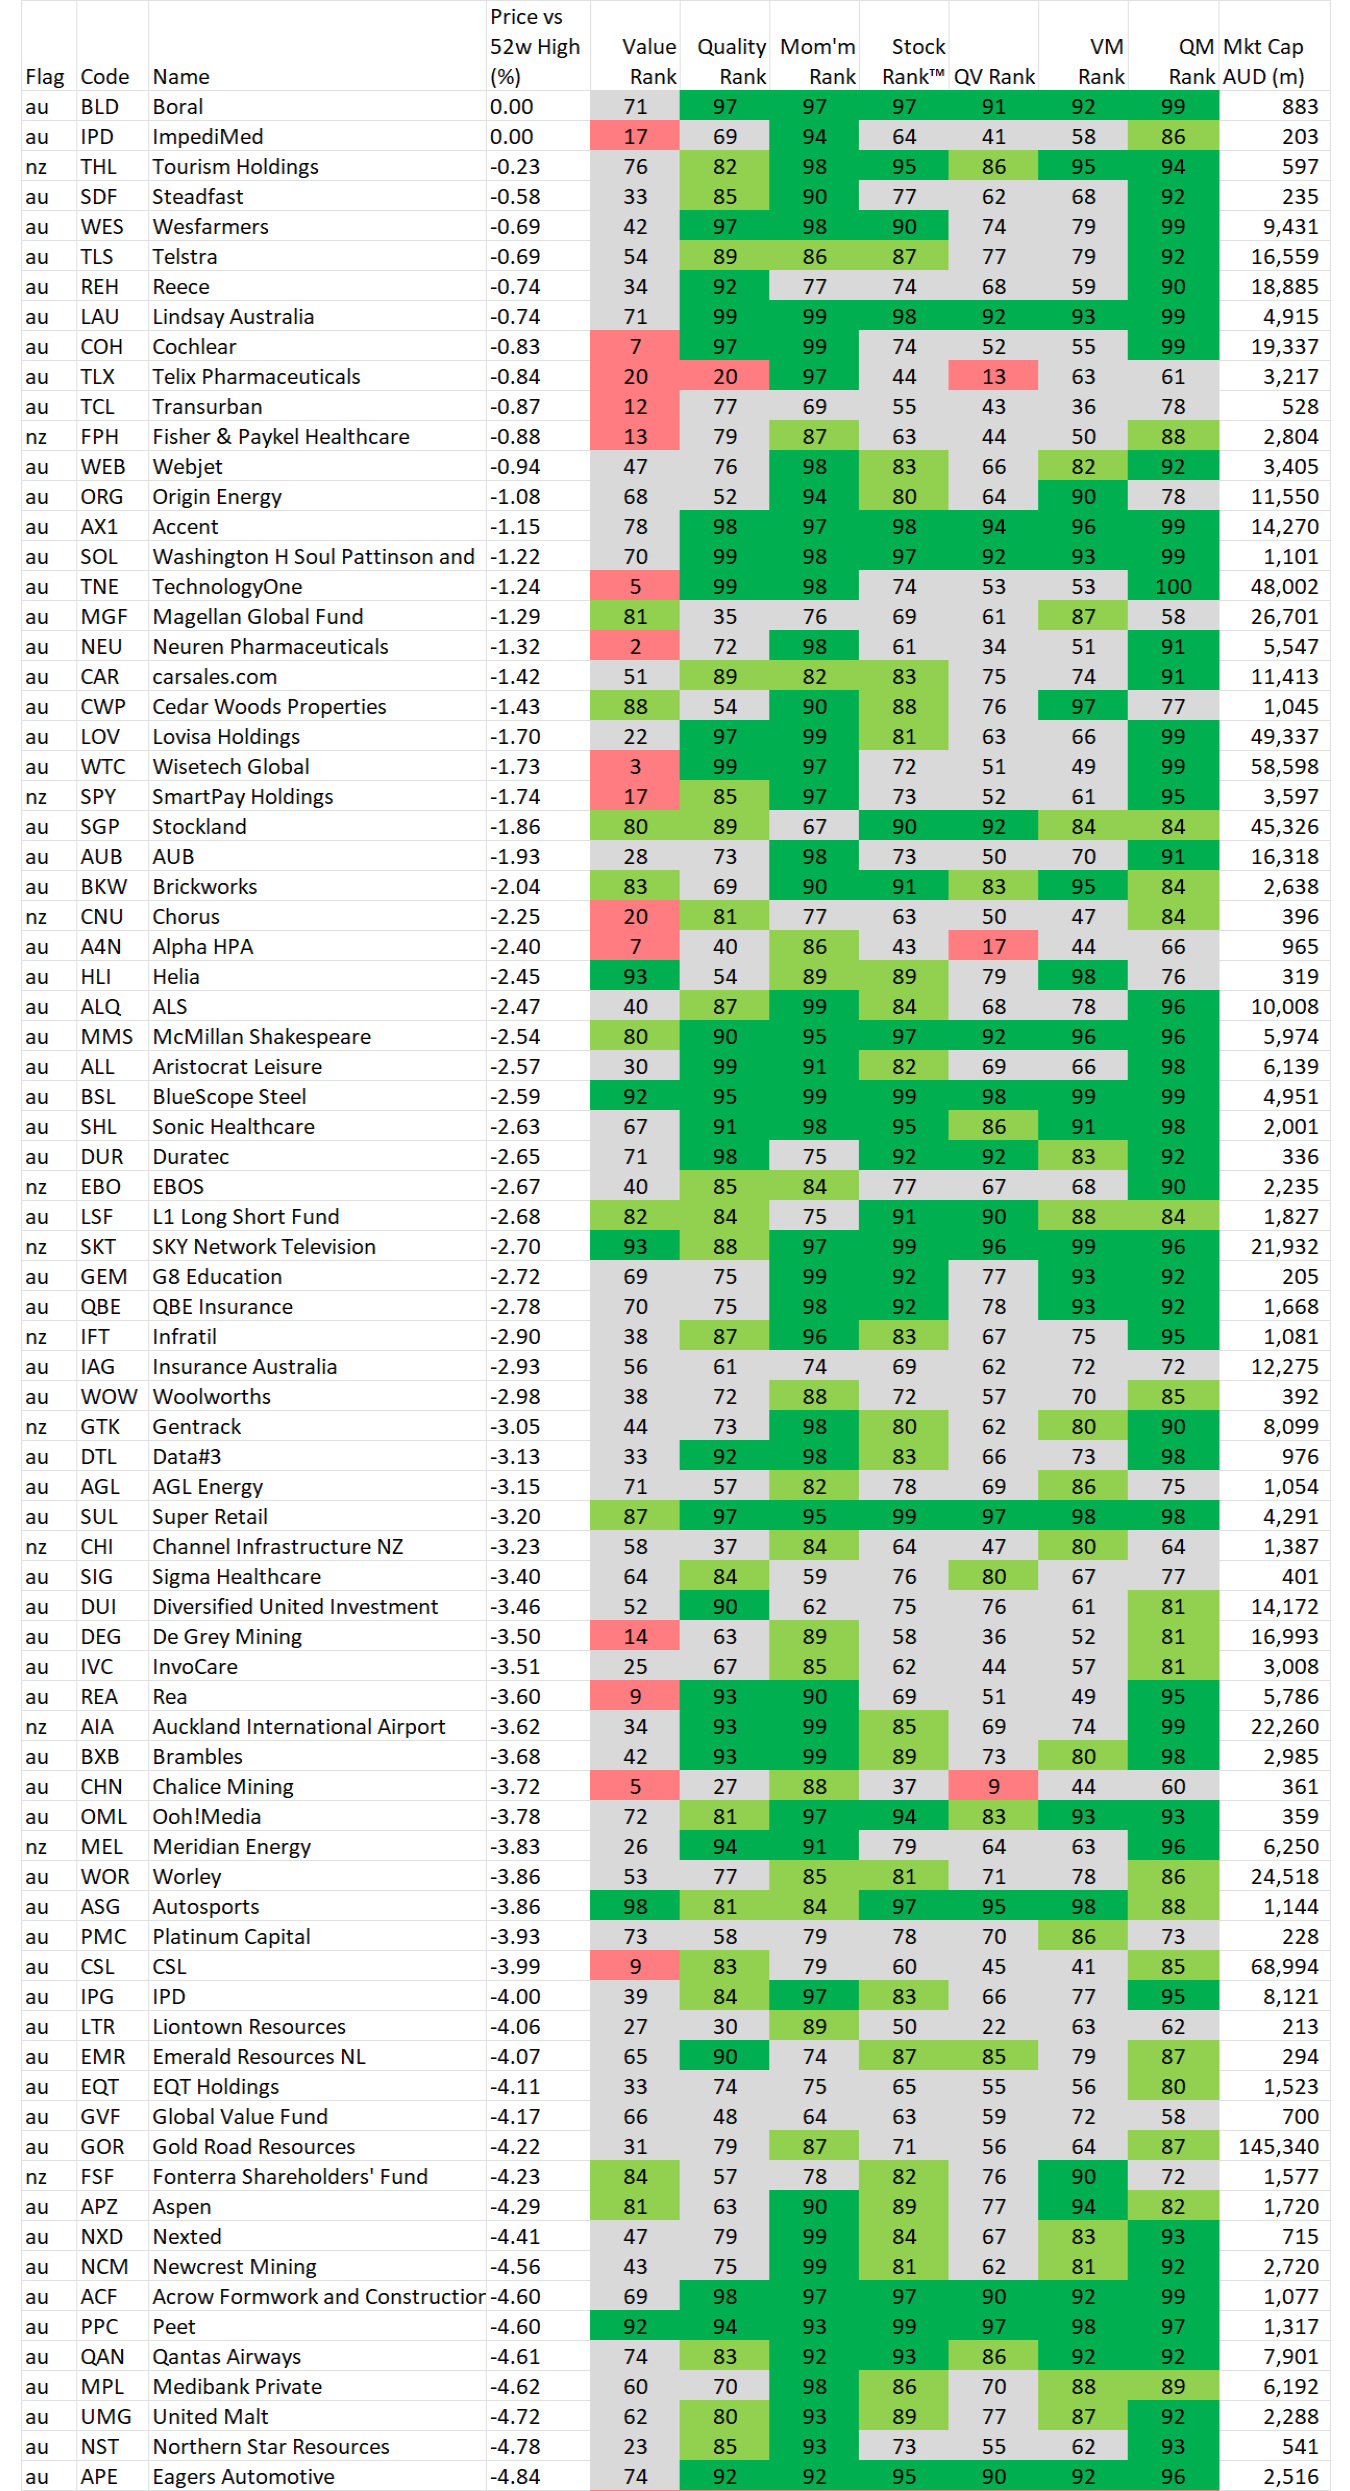
Academic Research has shown that stocks close to their 52 week highs tend to outperform.
To that end we attach the results of a screen run within Stockopedia showing every stock above 200 million market that is trading at least 5% from its 52 week high. (If you wish to recreate this criteria in the scanner select "Price vs 52 high" greater than -5%)
This has not considered liquidity of the stock nor does it consider its fundamental qualities. However we have included each factor score to help you.
Data is at 21 April and is sorted by the stocks closest to their 52 week high.
And remember, past performance is no guarantee of future performance.
Important Information: Stockopedia Ltd ABN 39 757 874 670 UK business registration number 0637267 (“Stockopedia”) is an Authorised Representative of Daylight Financial Group Pty Ltd ABN 77 633 984 773 (“DFGPL”) which is the holder of an Australian Financial Services Licence (AFS Licence No. 521404).
Information in this commentary is current as at date prepared unless otherwise stated. However, please bear in mind that investments can go up or down in value, and that past performance is not a reliable indicator of future performance. For more Important Information please refer to the Disclaimer section of this website.
This communication may contain general financial product advice. It has been prepared without taking into account your personal circumstances, and you should therefore consider its appropriateness in light of your objectives, financial circumstances and needs before acting on it.
If our advice relates to the acquisition or possible acquisition of a particular financial product, you should obtain a copy of and consider the Product Disclosure Statement (PDS) before making any decision.
The author holds interests in the following stocks mentioned in this article: BSL . This position can and will change at any time without notice.
Disclaimer
This is not financial advice. Our content is intended to be used and must be used for information and education purposes only. Please read our disclaimer and terms and conditions to understand our obligations.
5 comments
And please.... don't forget.... we are currently reviewing the format and content of Momentum Monday so if you have anything worthwhile please feel free to contribute (though all requests may not be implemented - they will be seriously considered.)
Hi I would be interested with your thoughts on BSL. Especially after the earnings upgrade
I included a comment on BSL from a momentum perspective in the article. If you want to see what stocks are discussed in the edition, simply look at the right hand side and you will see them there (sort in mkt cap order I believe.)
OK.... Not sure what happened but BSL didn't appear in todays first published edition (as with PME). It has been added now. Very sorry for the confusion.
Thanks Elio