Momentum Monday 24th June 2024

Welcome to Momentum Monday.
“You can’t fight City Hall.”
That idiom ran through my brain all week. I don’t think I need to explain why. The pop in an overpriced and hardly traded $3B IPO who sells sloppy Black Beans probably tells you more than I ever will.
Also I hope you all enjoyed the first instalment of the “Investing Mastermind Series” with Roger Montgomery as much as I did. A link to the recording is provided below.
On a final note, this will be the last edition with the “Bus Pulling out of the Station” scan on account of some inconsistent results. Please have a read below for more detail.
Interesting links
This week on Weekend Watchlist run in conjunction with Shares for Beginners, we cover stock with a bad history, though again it is ver different today than it was back then it is JHX - James Hardie. Listen here to the replay
Here is a replay to the most recent “Mastermind Investment Series” episode that we ran last Thursday with Roger Montgomery. Click here to access the replay
The next edition in the Mastermind series will be Alan Hull of Actvest. Book your place here
Our “Empower Others” referral program has been updated and it offers the biggest discount we have available anywhere (Even better than the EOFY offer). To Learn read more here if you are interested in sharing this tool with other like minded investors
For any external commentary we make to the broader market, follow us on Social Media Facebook Linkedin Instagram or X (formerly Twitter)
This week’s content is as follows:
Broader market sentiment
Member corner
Stocks in the “Shine Zone” (including changes)
Buses pulling out of the station (volume + price movers)
52 week high screen (including changes)
A reminder that you don’t have to read all this contribution. Simply scroll to the area of interest.
Broader Market Sentiment
We look at the direction of both the US and ASX markets to gain an understanding of the broader sentiment at the minute. It is important to stress here that I DO NOT use this to time my entry or exit out of stocks. I prefer to use the individual charts of stocks to do that. However I find it useful in helping us determine how aggressive/cautious traders should be in their trading. In short the more positive the broader market is the more risks you can take and vice versa.
US / S&P500
It was a shortened trading week in the US on account of the Juneteenth Public holiday on Wednesday, however that did little to suppress sentiment with the S&P500 recording another record and another positive week.

S&P500 Weekly chart
Rising 0.6% for the week, there was nothing extraordinary about the week for the broad index per say. The incessant discussion around “mine is bigger than yours” smells of a bull market to me and I can’t look away. However talk of the Magnificent Seven, has really been replaced by NVIDIA (the Magnificent One) where one could be excused of thinking it is on our market given the amount of coverage it gets. Anyway that stock took a breather and was a key reason why the NASDAQ was flat for the week, versus the others which rose.
But of course the more we go up, brings us one week closer to a correction. I am starting to read that while the broader S&P500 obviously has done well, on an equal weighted basis the return has not been as great. In fact I am now seeing regular comparisons between the two styles of ETF tracking. Attached below are two US Index funds traded in Australia on the ASX. One is IVV (common S&P500 ETF) and the other is QUS (equal weight S&P500 ETF).

IVV vs QUS 1 year Daily chart
It is clear that the common market cap weighted index has performed much better over the past twelve months.
In fact survivorship bias also sees IVV outperform QUS over a number of time periods, including since inception. By survivorship bias I am saying if the majority of your money is in stocks going up, rather than having a larger percentage in the ones that aren’t, then you should perform better.
The Bulls would argue this validates their view on the world. The Bears would also point to this as a sign of possible weakness for the market. In our view, if you accept the QUS regularly underperforms the IVV then what we are experiencing is totally normal. Sure the smaller companies in the S&P500 are underperforming the bigger ones, but this doesn't tell us much. Ultimately Microsoft was added to the S&P500 in 1994 and it didn’t come in as one of the bigger stocks. Therefore I would rather the performance before the stock became big, rather than the performance now.
Long story short, this is why the individual chart of a stock is far more important than the broader index, and a market cap model will always beat an equal weight model because of maths. Ultimately, it's just science stupid!
Any way back to Markets and despite the UK maintaining high rates, hope springs eternal that the US will have one soon. Though as confirmed by the Central Bank over there. It won’t be three, it will be just one. But I think this whole episode reminds us we should never say never and nothing really gets in the way of sentiment when things are running.
Though I read it has been 377 days since the last 2.05% correction on the index according to the fine people at Factset. The VIX is also at record lows.
Despite the continued run to new records, I maintain my level of 4734 before I would even consider a change in sentiment. That short term traders level of 4967 will likely remain for now until the index powers much higher. I must admit though given the index strength it is looking good as a level for me too.
I maintain sentiment is strong globally therefore I remain exposed to equities.
AUS S&P/ASX200
It ended up being a positive week here for the S&P/ASX200, though a diagnostic of the week will show the majority of the performance came on Tuesday

S&P/ASX200 Weekly chart
Which means it was derived following the solid performance in the US on Monday (their time)
For the record the S&P/ASX 200 rose on Friday to finish the week 0.9 per cent higher as gains among energy, healthcare and technology stocks offset falls for the miners. Lithium and Iron Ore continue to struggle and therefore so too the number of related businesses.
Despite the outperformance this week, I think it is fair to suggest our investor remains more sceptical than the US one. In some part because of our focus on mining stocks as a large part of our index, the small IT sector exposure and limited semiconductor business available to invest in and the fact that we are more sceptical. Looking at a one year chart of both the XJO and SPX I can see a real divergence from November last year and the outperformance has been significant.

SPXvs XJO 1 year Daily chart
Looking at our biggest it is not difficult to see why. Of the ASX20, WDS, TLS, the miners and the supermarkets have underperformed the index whereas everyone else has outperformed it with the best being Goodman Group, and that is most likely driven by its data centre strategy.
Anyway despite having no Magnificent 7 or a huge tech sector, I remain comfortable with where the market is at from a chart perspective for now.
This was further confirmed by the pop in GYG when it listed. To be frank for a company of that size there wasn't much stock available and no retail investor could get their hands on it. The rise was expected, especially when I read that 30% of all trade in the stock on the day it listed was through Superhero, a notoriously retail investor platform. As a fund manager the ONLY reason you go near it is if you were hugging the index. In my eye it's overvalued, full of falsehoods and illiquid relative to its size, so I will continue to give this a wide birth, until shares come out of escrow - or at least some sanity returns to price moves. Just be patient, however you can never say you will never hold a stock as a Momentum Investor, one day we may own it. The recovery on Friday from it is lows was impressive - but it's still too early for me.
In total though, I remain steadfast in my view on broader market sentiment until the index at least falls below 7547 in the short term.
Member corner
In this section we will provide a detailed chart assessment, on a maximum of ten stocks weekly, on companies from those of you in the Gallery.
We welcome stock requests to be analysed from members. We will also be looking at the charts of some of the more actively researched stocks for the week. We will try to rotate through a selection so as to not make the charts stale, however we will likely not cover a stock within 2 months of when it was last discussed.
If you want to see what has been written about a stock recently, go to the discussion area.

We will not be making up suggestions. If there are no changes to the most viewed list and/or there are no suggestions from members, then no stocks will be covered.
To learn of the methods used to analyse companies in this section, refer to my Momentum Journey series that I articulate here in three parts.
They will help provide context on what I am writing about and the editorial angle of this report.
Also look at the market capitalisation and liquidity before making any decisions!
And again, if you have a stock you would like analysed from a momentum perspective, please write it into the comments section below or email us at @stockopedia.com.au">support@stockopedia.com.au
IF NO ONE ASKS… HOW AM I SUPPOSED TO KNOW?!?
ASX: PLS - Pilbara Minerals
StockRank 65
Momentum Rank 30
QM Rank 58
VM Rank 52
A$3.11
A stock which historically has been talked about, though I note it hasn’t been discussed from a Momentum perspective since February last year is Pilbara Minerals (ASX:PLS)

Back then I talked about my long history holding the stock and I don’t apply these methods to my holding in it.
I also said that from a traders perspective, “its troubles are far from behind it.” I also said, I wouldn’t look at it until it crossed above $4.30, and herein lies and important lesson.
It did just that in March, then as you can see the price pulled back. It went up again but not as high as previous. Therefore it created a lower high. And then it broke support again. One cannot undersell the importance of patience when trading and PLS is highlighting it perfectly (in my view).
So what to do now? The stock is still in a downtrend. The confirmation of the series of lower highs and lower lows means as such. When can we look at it again? In my view once the price stops falling and rises back above $4.20 then a trader might wake up. Problem is the downside structural support sits at $2.10 which is a fair way from current prices.

ASX:PLS 5 year Weekly chart
The recent announcement where it will boost output from its Pilgangoora Hard Rock Lithium project per annum following some positive recent drilling was overshadowed I feel by a reduction by the reduction in long-term lithium price forecasts. However as a low cost producer this is still very profitable, and if anything, reminds the specky investor that it is hard to find and start up a mine, versus being in operation.
Though as I always keep reminding investors, “PLS is a premium producer and reseller of hard rock Lithium” basically it needs the cycle working for it. It is not currently doing that at the moment.
ASX: WDS Woodside Energy
StockRank 86
Momentum Rank 67
QM Rank 78
VM Rank 84
A$27.52
It has just ticked over two months since I last discussed Woodside Energy (ASX:WDS), and members are still interested in it. You read my past commentary here

ASX:WDS 1 year Daily chart
Undoubtably the oil price rebound of recent times should have helped with sentiment in the short term, but it didn’t. Over the longer term, it is still an avoid.
Going back a few months now I mentioned that I see structural support at $20. Again, I see nothing in the chart to change that view. In the most recent dip down we got to $26.93 and it could have another leg in that so again I don’t know why members are so fixated in this stock now. Especially when there are so many going in the right direction. It's actually quite easy to stay away from the underperformers and sticking with the outperformers at the minute. I don’t need to have studied technical analysis to know that this stock is going in the wrong direction.
Again, until the stock crosses above $39, I am just not looking at this business.
Stocks in the Shine Zone
To learn about the Shine Zone and how to use it, you can read it here.
The rules for inclusion in this list are based on those I like to see in a stock before considering a trade in it:
QM Rank above 80
Price is above the 2.5x ATR
50d MA is above the 200d MA
Price is greater than the 200d MA
Market cap greater than $200M
This is a very important point: the “Shine Zone” are rules for possible buying. They are not for holding and/or selling. If a stock falls out of the shine zone, use support levels to set your stops, or instigate a parachute stop if necessary. With markets moving sideways, one expects frequent changes in these lists.
If you feel there is a stock that should be included but is missing please let us know. This is a manual process and occasionally one gets through the cracks
Also look at the market capitalisation and liquidity before making any decisions!
Data is at 22 June and is sorted by the stock code.
Changes from last week
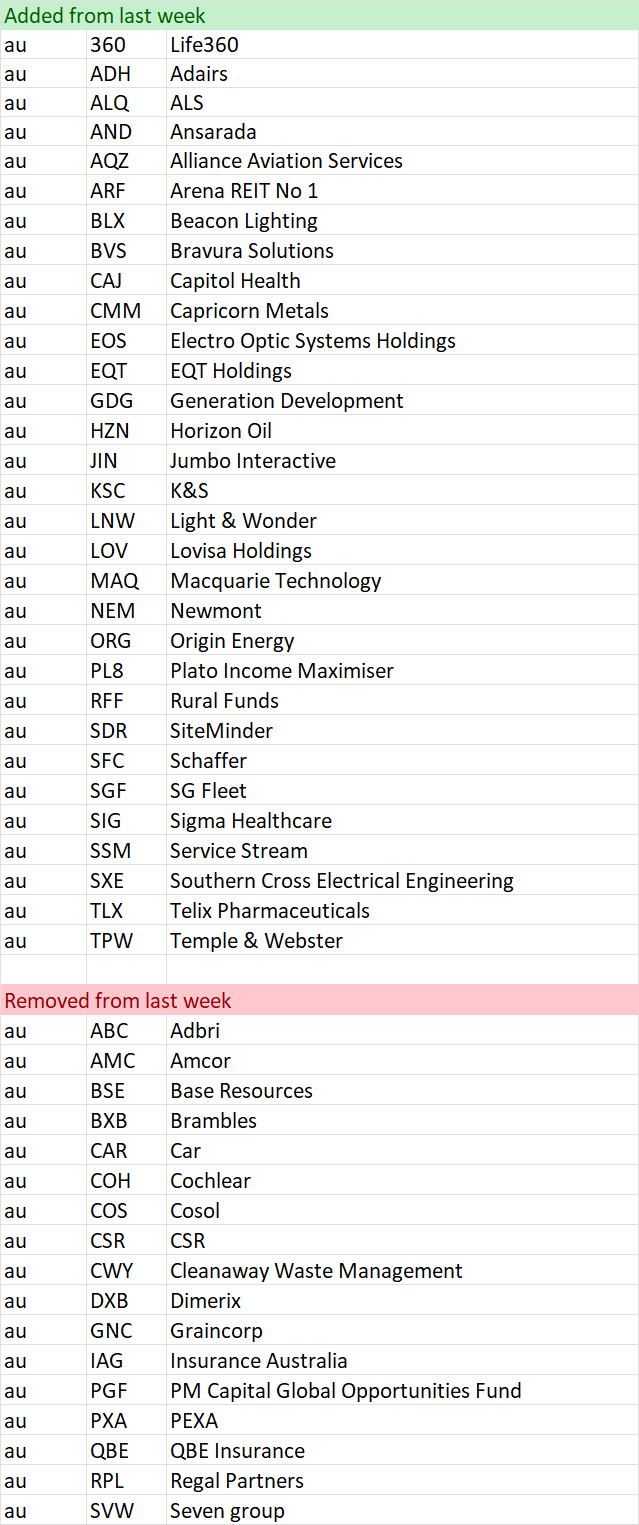
Shine Zone list as at 22 June

“Bus pulling out of the station”
NOTE: THIS WILL BE THE LAST TIME WE PUBLISH THIS SCREEN. UPON ANALYSIS OVER THE PAST FEW WEEKS, WE HAVE FOUND THAT THE SCREEN ADDS LITTLE VALUE IN TERMS OF PERFORMANCE. WHILE THIS MAY BE SYMPTOMATIC OF A BULL MARKET, GIVEN ITS LOW READERSHIP WE HAVE DECIDED TO NOT INCLUDE IT ANY LONGER. OF COURSE THE CRITERIA IS STILL AVAILABLE TO SCREEN ON. THEY LINK AND INFORMATION BELOW ARE STILL RELEVANT FOR THOSE THAT WISH TO RUN THE SCAN WITHIN THEIR OWN PROCESSES.
To learn more about this screen read the following article on the objective of the screen
Here is a shortcut in understanding the reasons why a stock is removed:
Volume drop = Bus might be moving, but no one is on it
Price 1 mth < 0% = Bus has been cancelled
Price 3mths >= 3% = Bus has pulled out of the station
Also look at the market capitalisation and liquidity before making any decisions!
Data is at June 22 and is sorted by the stock code.
Changes from last week
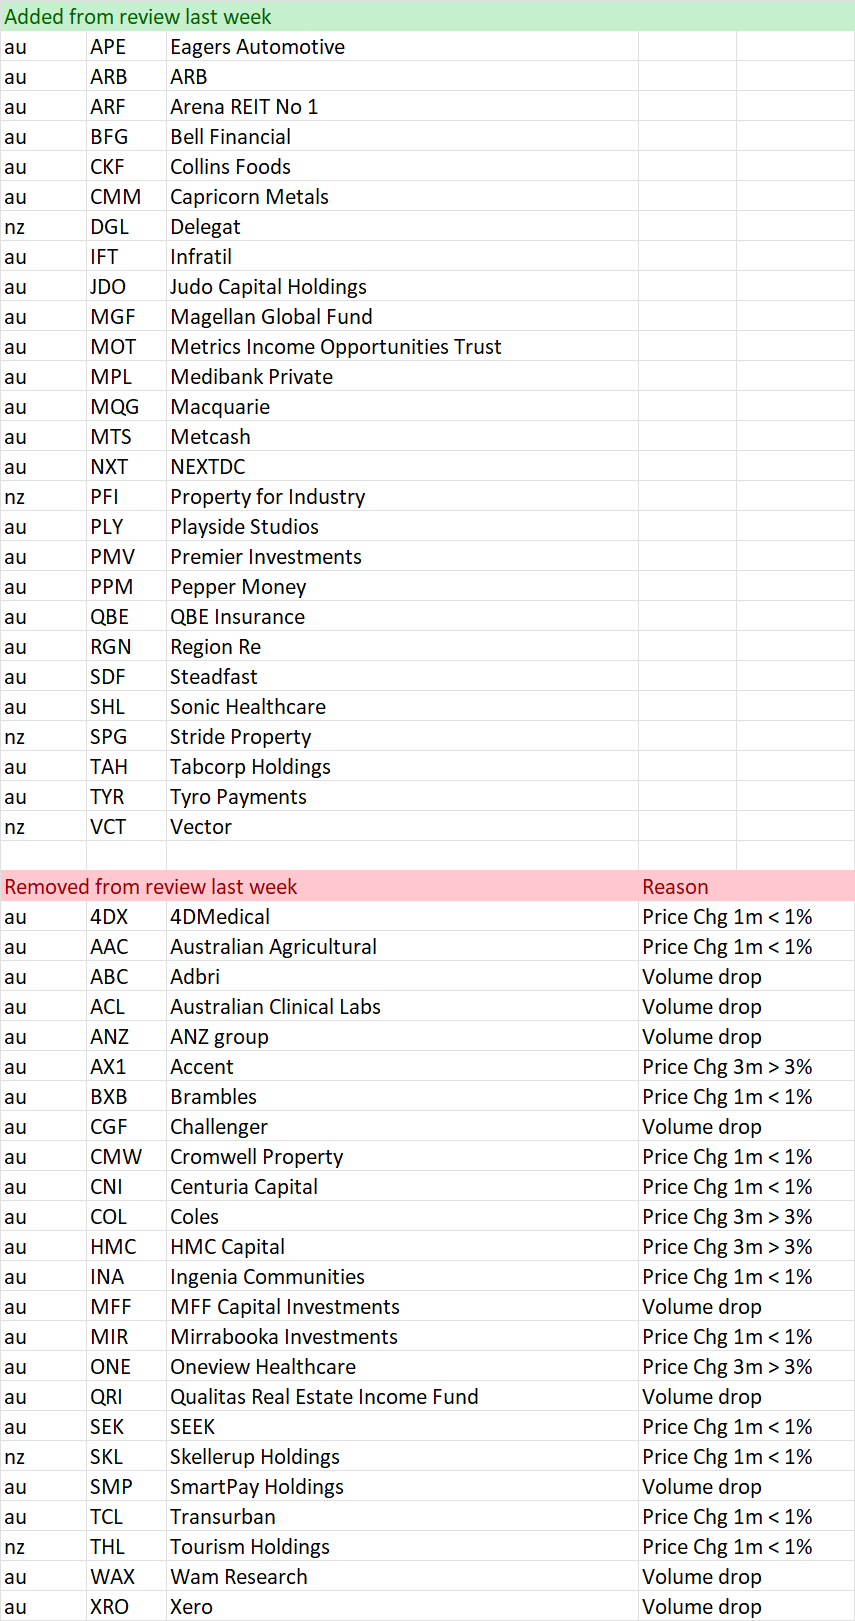
“Pulling out of the station” on 22 June
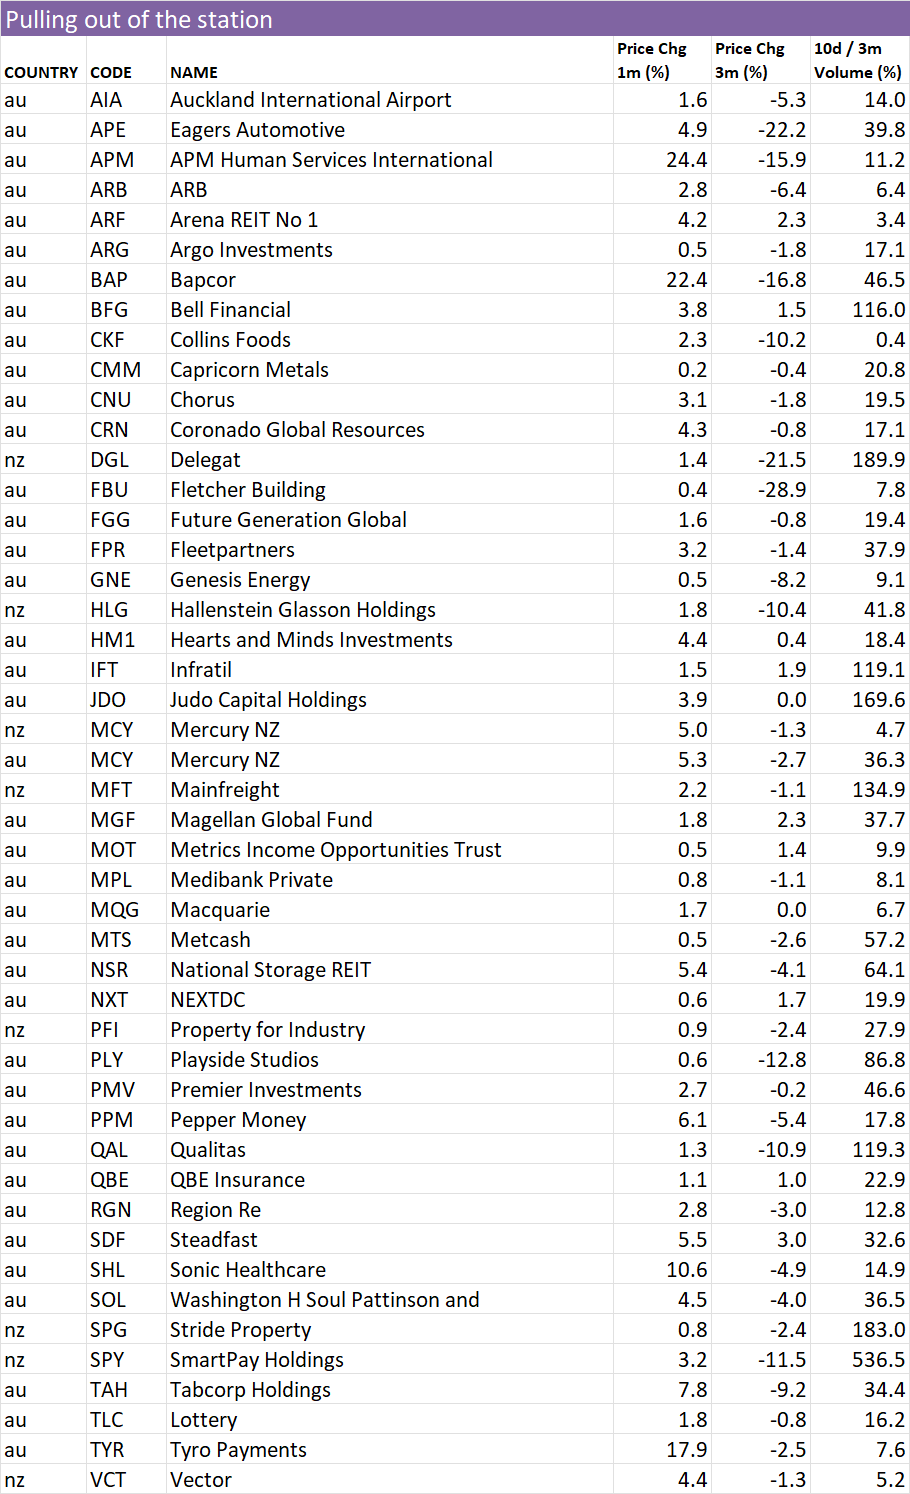
52 week high screen
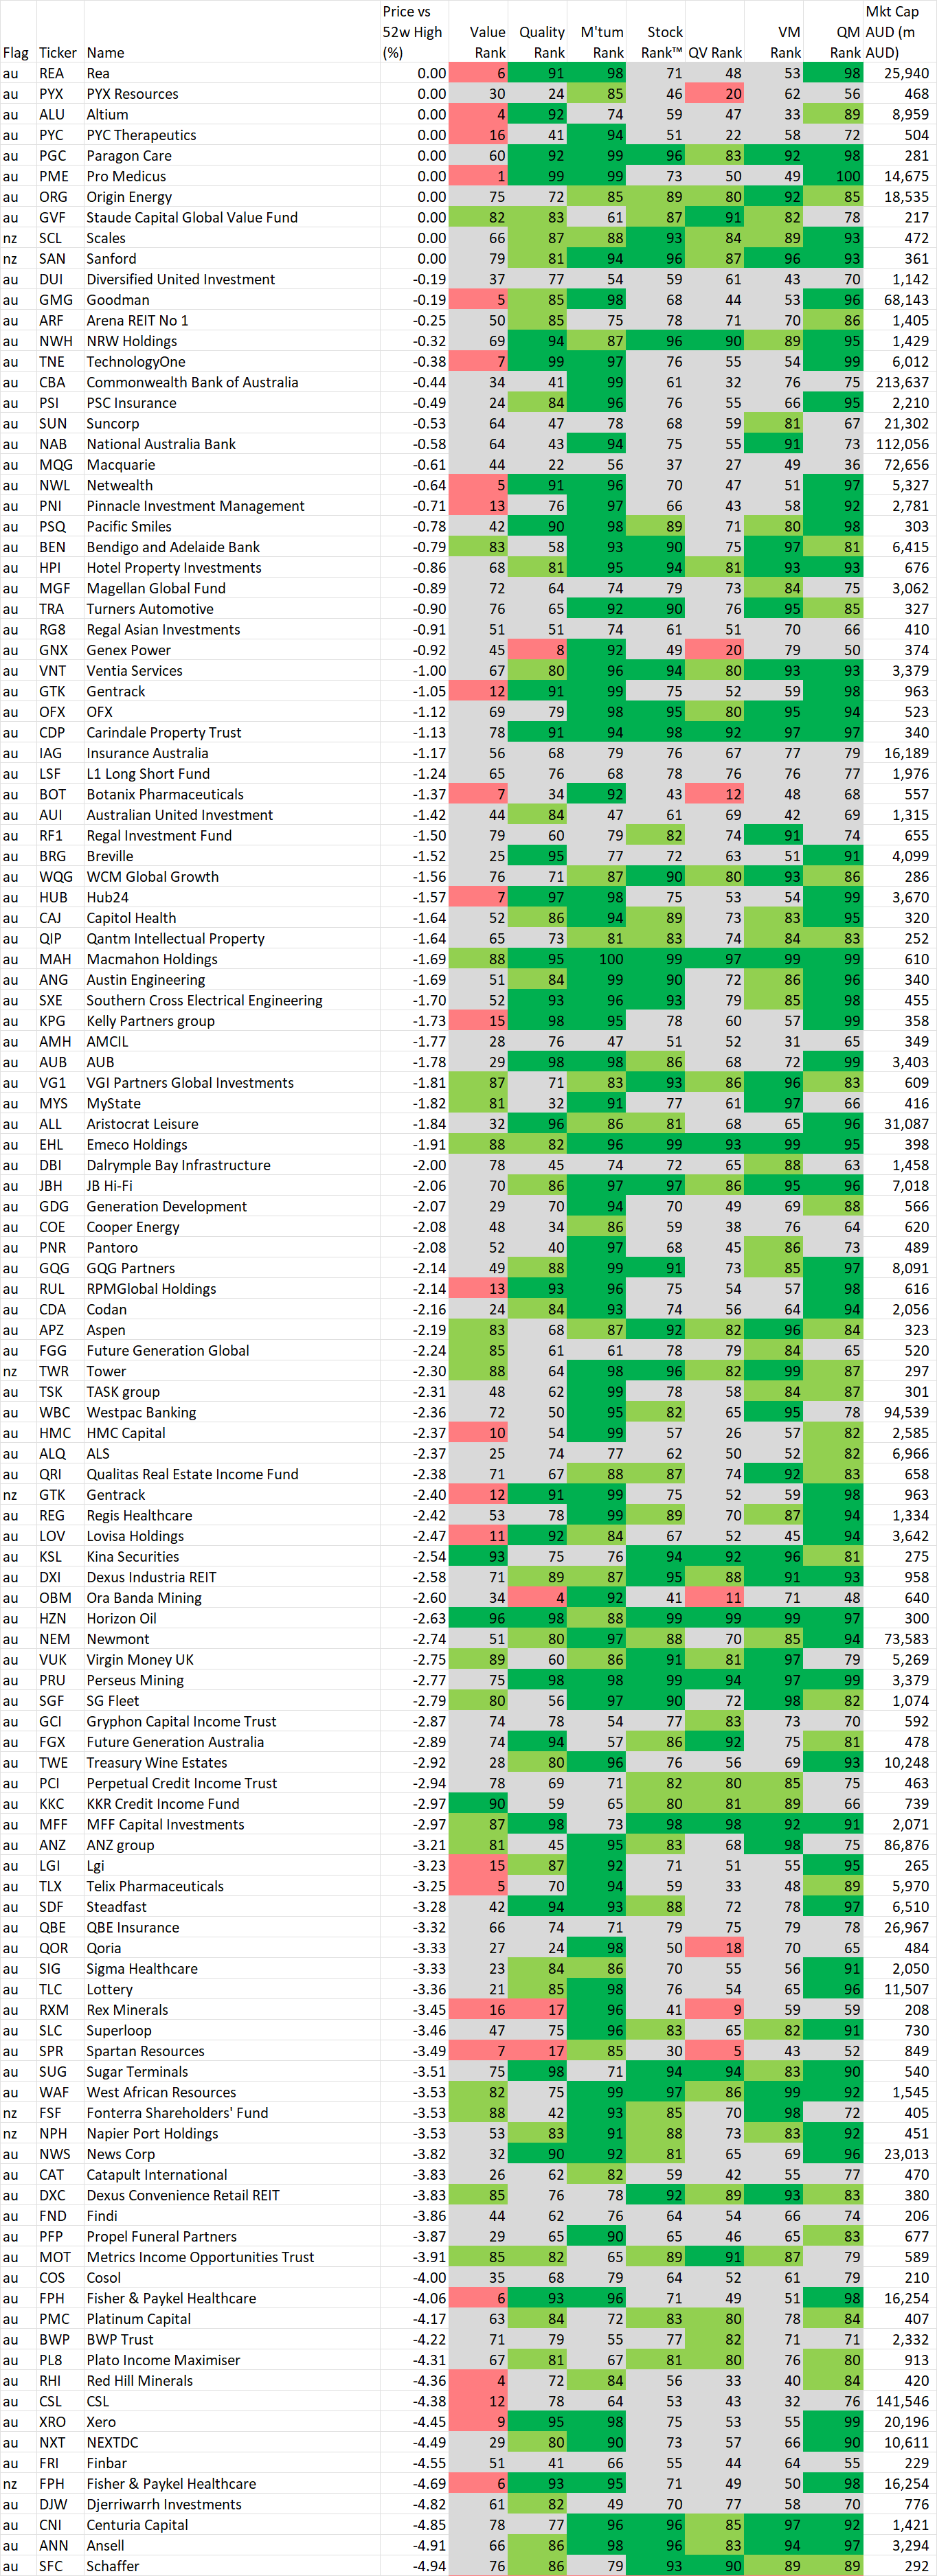
In this section we identify stocks within 5% of their 52 week intraday high based on the idea, supported by academic studies, that stocks close to their 52 week highs tend to outperform. Weekly changes to the list will also be noted.
If you wish to recreate this screen in the screener select "Price vs 52 high" greater than -5% and Mkt Cap greater than $200M
A stock coming onto the list is NOT an automatic buy, just as a stock that leaves the list is NOT an automatic sell. As with the shine list, assess every chart on its merits. However movements on this list may alert you to interesting charts so be sure to look at Stockopedia and the chart first.
Data is at 22 Jun and is sorted by the stocks closest to their 52 week intraday high.
Also look at the market capitalisation and liquidity before making any decisions!
And remember, past performance is no guarantee of future performance.
Changes from last week
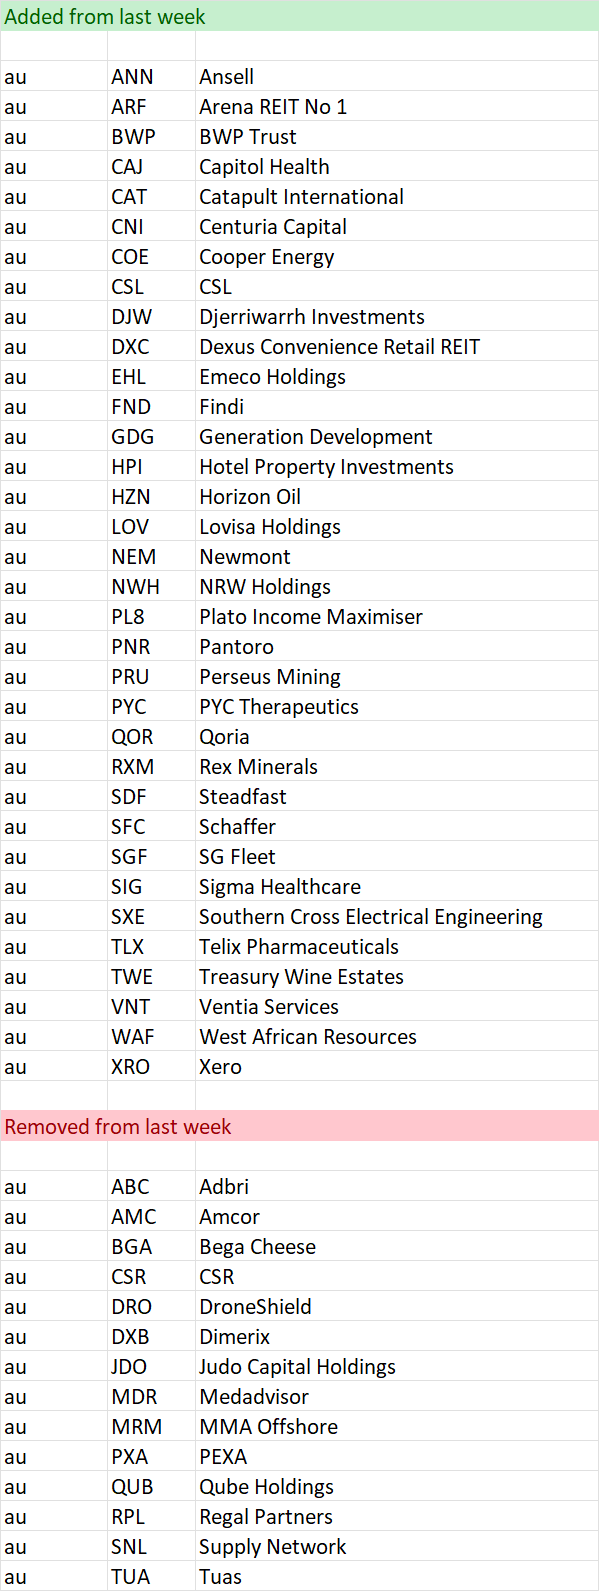
Stocks within 5% of their 52 week high as at 22 Jun
Important Information: Stockopedia Ltd ABN 39 757 874 670 UK business registration number 0637267 (“Stockopedia”) is an Authorised Representative of Daylight Financial Group Pty Ltd ABN 77 633 984 773 (“DFGPL”) which is the holder of an Australian Financial Services Licence (AFS Licence No. 521404).
Information in this commentary is current as at date prepared unless otherwise stated. However, please bear in mind that investments can go up or down in value, and that past performance is not a reliable indicator of future performance. For more Important Information please refer to the Disclaimer section of this website.
This communication may contain general financial product advice. It has been prepared without taking into account your personal circumstances, and you should therefore consider its appropriateness in light of your objectives, financial circumstances and needs before acting on it.
If our advice relates to the acquisition or possible acquisition of a particular financial product, you should obtain a copy of and consider the Product Disclosure Statement (PDS) before making any decision.
The author holds interests in PLS and in companies listed in the data tables . This position can and will change at any time without notice.
Disclaimer
This is not financial advice. Our content is intended to be used and must be used for information and education purposes only. Please read our disclaimer and terms and conditions to understand our obligations.
2 comments
Hi Elio and Chris, Enjoyed the recent webinar with Roger Montgomery and looking forward to next webinar with Alan Hull. IFT is raising capital to invest in data centers. I would much appreciate your view on the current raising. Regards, John
Will do. Certainly is a hot sector at the moment. Data Centres that is, And it is not a big discount (which usually is a good thing) despite over $1B being raised in total - though I see the retail offer is uncapped