Momentum Monday 25th March

Welcome to Momentum Monday.
Nope. No correction last week. Just new record highs. The only thing I ask everyone is to change your thinking. This is not luck. Nor is it by design. Just be in when it's heading north-east, out when it's heading south-east and the travails of the past two years where the market is going sideways are hopefully behind us. Never mistake a bull market for brains… but think less and make more money - as I constantly have to remind myself.
Also I was made aware to a rather intriguing message last week from a client wondering why their inbox wasn’t full of emails from us. In other words, why weren’t we spamming them?
‘Out of sight out of mind’ was their view, ‘less in more powerful’ is ours. We would be interested in your view. Either email us at support@stockopedia.com.au or write down your view in the box below.
Interesting links
Weekend Watchlist with Shares for Beginners this week is we talk of a Stock in the news, but you won’t hear about it from them. It’s Tuas (ASX:TUA). Listen here to the replay
“Empower Others” referral program Learn more here
For any external commentary we make to the broader market, follow us on Social Media Facebook Linkedin Instagram or X (formerly Twitter) For the moment we don’t spam you.
This week’s content is as follows:
Broader market sentiment
Member corner
Stocks in the “Shine Zone” (including changes)
Buses pulling out of the station (volume + price movers)
52 week high screen (including changes)
A reminder that you don’t have to read all this contribution. Simply scroll to the area of interest.
Broader Market Sentiment
We look at the direction of both the US and ASX markets to gain an understanding of the broader sentiment at the minute. It is important to stress here that I DO NOT use this to time my entry or exit out of stocks. I prefer to use the individual charts of stocks to do that. However I find it useful in helping us determine how aggressive/cautious traders should be in their trading. In short the more positive the broader market is the more risks you can take and vice versa.
US / S&P500
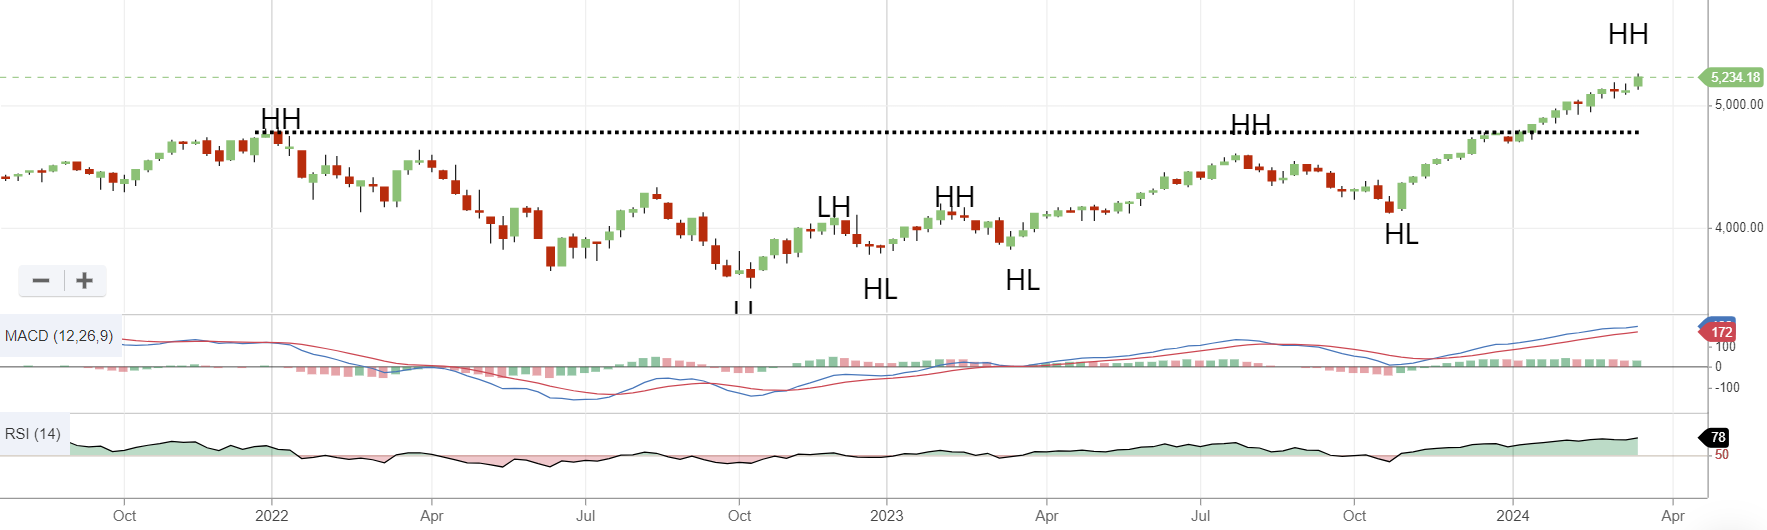
Though we closed down on Friday, it was another strong week for the US market. The Dow in fact is just shy of 40,000 points despite the pull back.
S&P500 Weekly chart
The 2.3% rise on the week was another strong one and green on screen has almost become the default position.
To me it was intriguing that the IPO of Reddit which jumped 48% on listing was enough to drown out Apple’s EU antitrust lawsuit, but the bulls are running hard despite the market trying to tell us something..
Much of the optimism for the week seemed from Chairman Powell say that three further rate cuts this calendar year were coming. We also heard the Bank of England keep rates steady, but with a less Hawkish tone, and Switzerland’s central bank unexpectedly cut rates by a quarter point overnight to 1.5% (ie much lower than ours) .
Basically, this inertia is driving markets at the minute. And it is heading up.
My logic brain tells me that the enthusiasm of any rate cuts is overdone given the current economic climate the world finds itself in. But what does little old me know? Other than we patiently wait for the pullback (which will come) to take some steam out of the rally. But that certainly did not happen this week.
I could talk about Cocoa’s rise this year, or Bitcoin experiencing a tough week, but why bother?
Back to the charts and I note with interest the weekly RSI figure at 78 which means it may be approaching the overbought level (some literature suggest 70 is more appropriate) so this adds weight to the idea that a pullback is due soon.
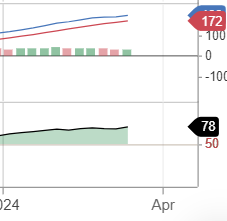
On the chart though we are heading north east. 4766 remains my stop level. Therefore equities still see a lot of my money at the minute.
AUS S&P/ASX200
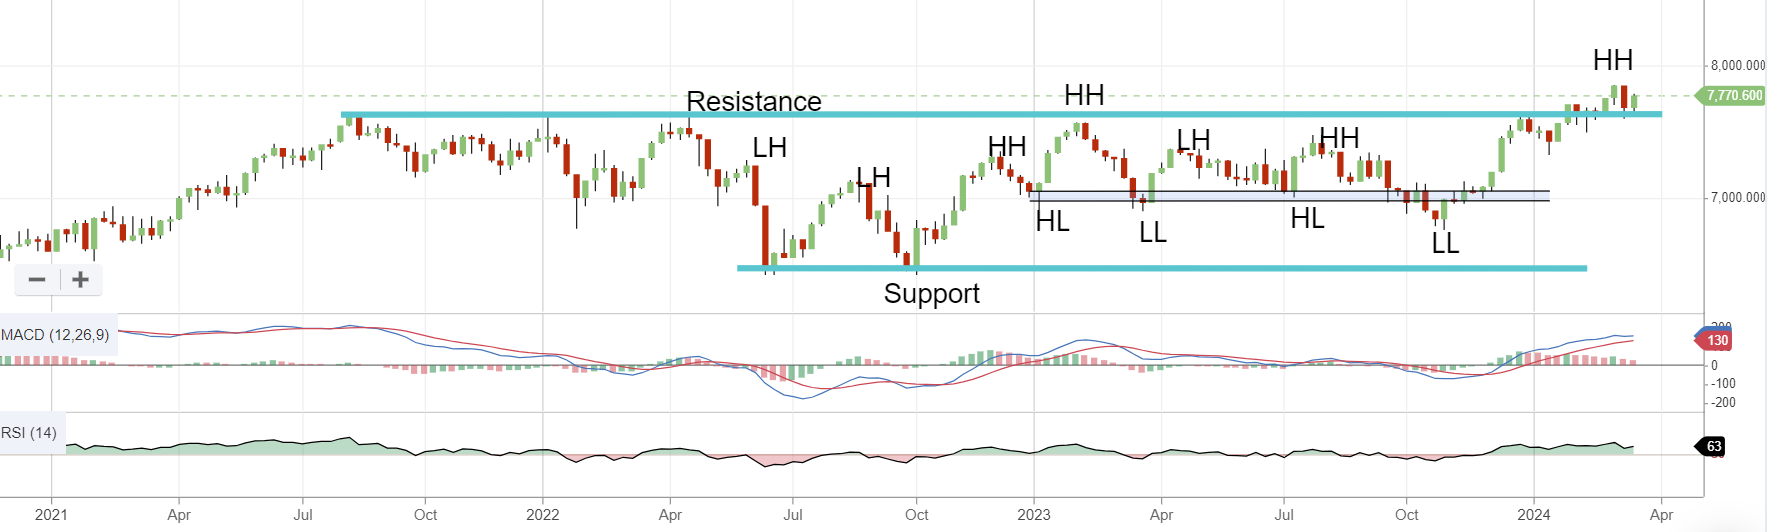
This was a positive week for the S&P/ASX200 after a tough week just past. Sometimes looking too deep into something will cross your eyes.
S&P/ASX200 Weekly chart
It really is a US story at the minute with mild inflation numbers over there having a more positive impact on the market than our ultra low Unemployment Levels. The old concepts of Full Employment have definitely been thrown on their head recently
This tracking of US Sentiment is rather typical of a market closer towards the end than the start of the bull run. Perennial optimists (like me) will be hoping that the Price Takers will find some love to drive our market even higher into the future.
But with Iron Ore futures falling below US$100 per tonne for the first time in ages, it doesn’t look great in the short term. I spoke of the scepticism being shown towards the Chinese 5% GDP Growth target last week, and this is no better reflected in the price of steel which has been dragging everything down with it. Actually the mind boggles that a broke Evergrande was able to access tens of billions of US dollars based on lies over the last two years, and yet investors are to blindly believe the Chinese Government whose aroma is all over the business?
Therefore it is unsurprising in my view to hear that China’s onshore and offshore yuan slipped to its weakest levels against the greenback since November 2023, with both metrics breaching the 7.2 level.
I have read reports that say China’s state banks were swapping dollars for yuan in a bid to arrest the slide. We’ll see if that gets more coverage next week.
Back to macro factors, and we learnt that New Zealand entered a technical recession following its second consecutive quarter drop in quarterly GDP (-0.1% in December 2023). This goes some way to explain why the S&P/NZX50 is down some 20% from the high back in early 2021. This news sent the currency initially lower as traders boosted bets on interest-rate cuts locally. This negative quarter was a surprise and is seens as a result of the Reserve Bank of New Zealand’s aggressive monetary policy tightening as it tries to bring inflation back under control. With rates currently at 5.5%, bets are rising there will be a cut later this year.
Perhaps next week there will be more to say ( I said that last week and look how that played out?) I remain happy that the index is above my short term stop for the index to 7547.I remain exposed to domestic equities and I remain relatively aggressive. If I was a trader I would be ‘buying the dips’.
Member corner
In this section we will provide a detailed chart assessment, on a maximum of ten stocks weekly, on companies from those of you in the Gallery.
We welcome stock requests to be analysed from members. We will also be looking at the charts of some of the more actively researched stocks for the week. We will try to rotate through a selection so as to not make the charts stale, however we will likely not cover a stock within 2 months of when it was last discussed.
If you want to see what has been written about a stock recently, go to the discussion area.

We will not be making up suggestions. If there are no changes to the most viewed list and/or there are no suggestions from members, then no stocks will be covered.
To learn of the methods used to analyse companies in this section, refer to my Momentum Journey series that I articulate here in three parts.
They will help provide context on what I am writing about and the editorial angle of this report.
Also look at the market capitalisation and liquidity before making any decisions!
And again, if you have a stock you would like analysed from a momentum perspective, please write it into the comments section below or email us at @stockopedia.com.au">support@stockopedia.com.au
IF NO ONE ASKS… HOW AM I SUPPOSED TO KNOW?!?
ASX: SLC - Superloop
StockRank 77
Momentum Rank 96
QM Rank 83
VM Rank 85
A$1.36
Given Aussie Broadband (ASX:ABB) made it to the list last week of most viewed stocks, it was not unsurprising to see Superloop (ASX:SLC) join its ranks in the middle of the past week.

As mentioned many times before, when such fundamental corporate action is taking place it makes it difficult to assess any chart as factors beyond the price impact its future movement (as was the case with ABB last week)
But looking at the price, the spike has created a new short term higher. In fact the price hasn’t been this high since 2021. Therefore we could be starting to see a reverse of the well entrenched downtrend that we have been seeing.

ASX:SLC 10 year Weekly chart
The other pleasing thing to note is the stock had been trading above its 2.5x ATR for some time, and the moving averages had converged for some time, indicating a potential basing pattern.
The price has popped, and of course usually “if we know about it, it’s probably already too late.” The risks are the two gaps we have seen and whether they get filled or not. For those not holding the stock the bottom of those ranges may be more appropriate entry levels. However, for those still holding, I am glad that some structure is starting to form after the pop. I see no need to immediately panic if the price stays above $1.16. But stocks at 52 week highs with more work to do to get back to higher levels, is just what I like to see. The movement over the next week or so will govern a lot of what I do next - but it is on my watchlist.
ASX:PDN - Paladin Energy
StockRank 69
Momentum Rank 98
QM Rank 82
VM Rank 77
A$1.385
Two months have just gone past for Paladin Energy (ASX:PDN) and I remind everyone of the last time I talked about it. Read the commentary here

ASX:PDN 1 year Daily chart
At the time I said, “While I think $0.92 is behind us at the minute, looking at $1.05 or a little higher may be appropriate”. Fast forward to today and the price did pull back to an eventual $1.11 after hitting a new higher high.
The problem with this scenario is that the $1.11 created a new short term lower low. In fact it is at the precipice at the minute where the price needs to break through the higher high price at $1.435 to keep the momentum going, otherwise it may be turning over now as a new lower high would be set (currently at $1.395).
If I was trading this stock, structural support remains at $1.05. I have spoken of my positive disposition, on this business, plus its volatility, a number of times in the past.
ASX:NHC - New Hope
StockRank 94
Momentum Rank 61
QM Rank 82
VM Rank 88
A$4.40
In the same piece that I spoke about PDN, I also spoke about New Hope (ASX:NHC)

ASX:NHC 1 year Daily chart
Back then I mentioned if I was to get any, I would wait for the $4.50- $4.58 range. Well we are are here (even a little lower), though I still wouldn’t buy them on a Momentum basis as the stock fails a number of my metrics eg ATR, Moving Averages etc
The fact it has now created new lows (lower than the June 2023 support level), structurally I see the next area of general interest at $3.60 - $3.80 as the stock is in a downtrend.
As a price taker though, this could all change if coal prices change. However given the current China outlook it will have to be a surprise. Especially given the company only reported last week. (Note you can see that latest half year result in Stockopedia.)
Stocks in the Shine Zone
To learn about the Shine Zone and how to use it, you can read it here.
The rules for inclusion in this list are based on those I like to see in a stock before considering a trade in it:
QM Rank above 80
Price is above the 2.5x ATR
50d MA is above the 200d MA
Price is greater than the 200d MA
Market cap greater than $200M
This is a very important point: the “Shine Zone” are rules for possible buying. They are not for holding and/or selling. If a stock falls out of the shine zone, use support levels to set your stops, or instigate a parachute stop if necessary. With markets moving sideways, one expects frequent changes in these lists.
If you feel there is a stock that should be included but is missing please let us know. This is a manual process and occasionally one gets through the cracks
Also look at the market capitalisation and liquidity before making any decisions!
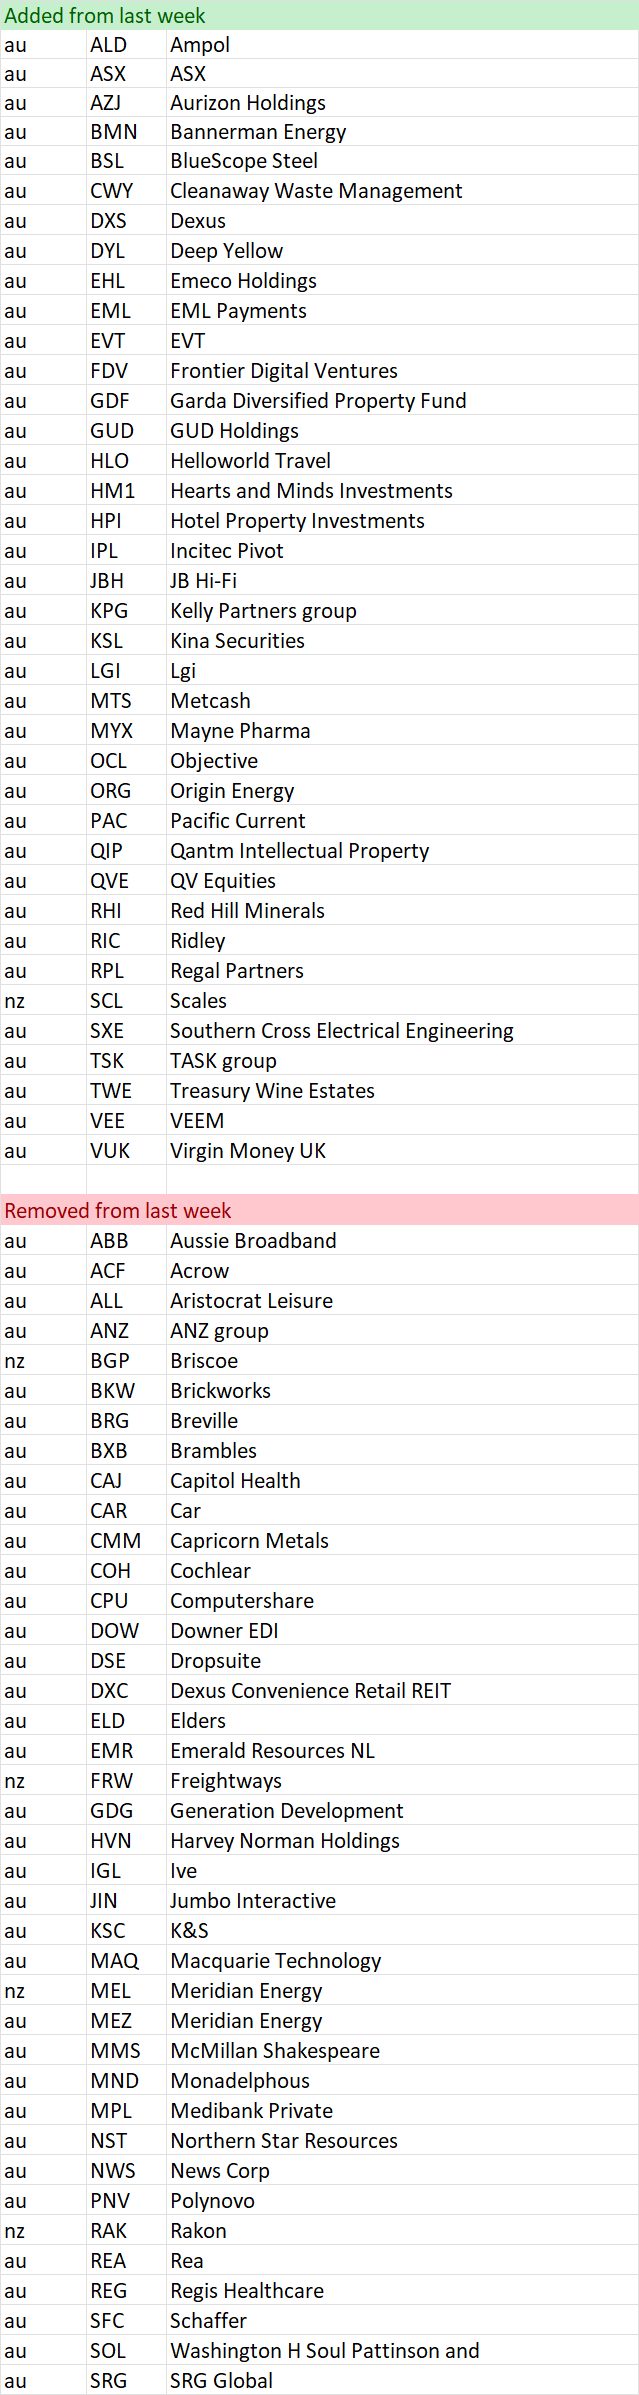
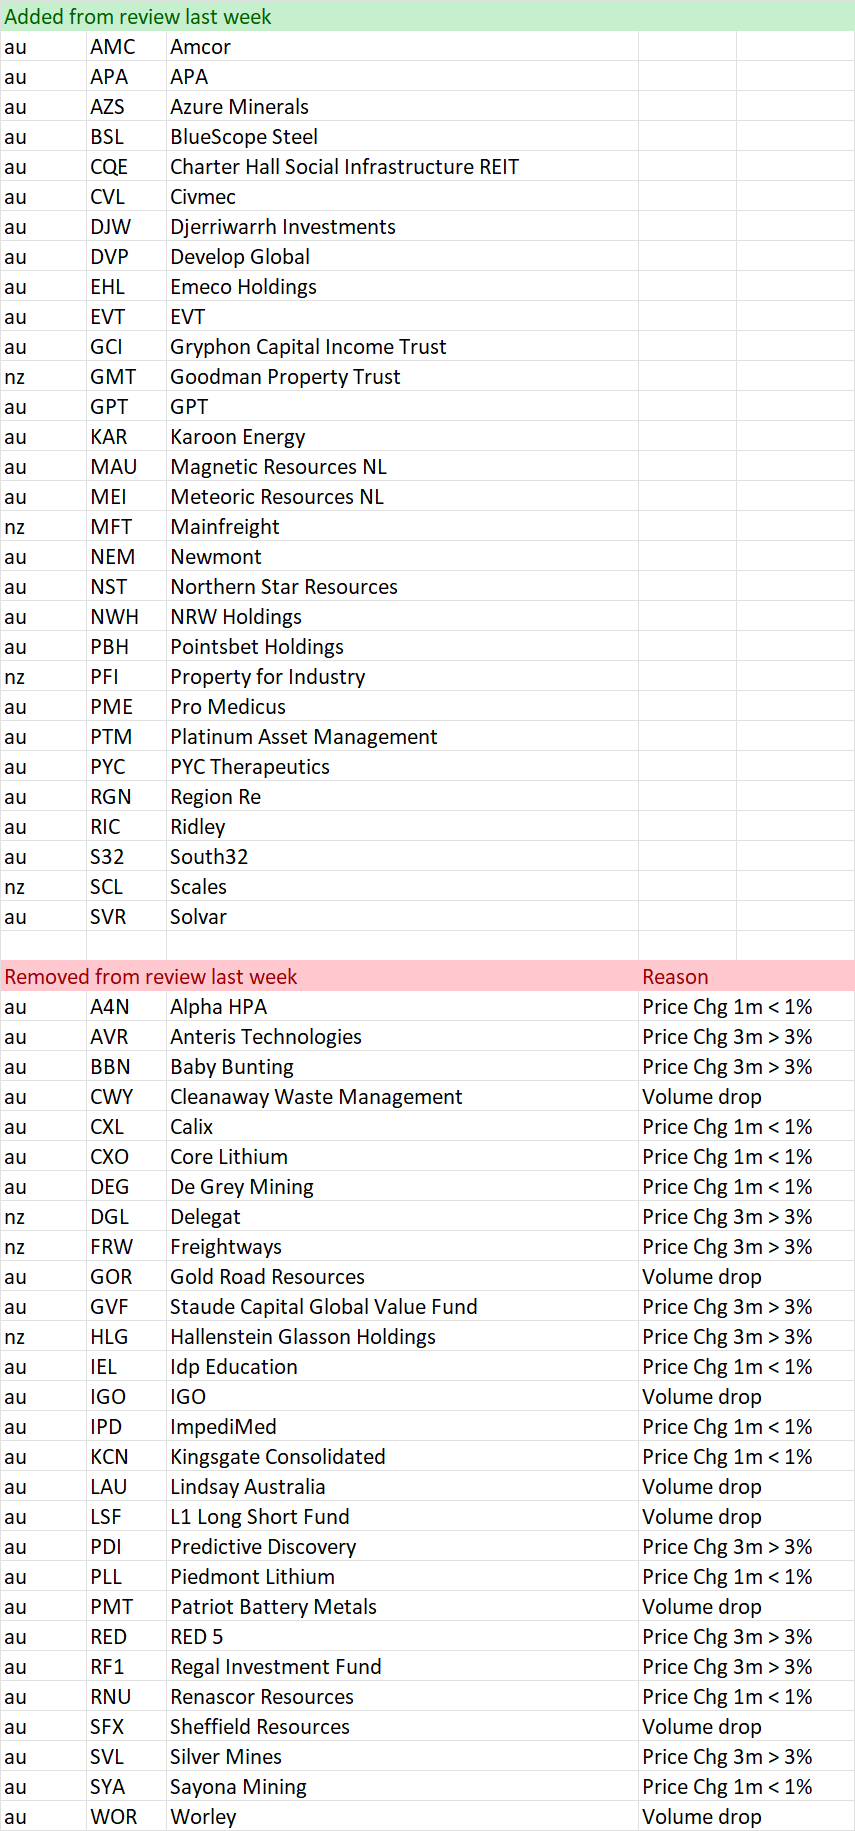
Data is at 23 March and is sorted by the stock code.
Changes from last week
Shine Zone list as at 23 March

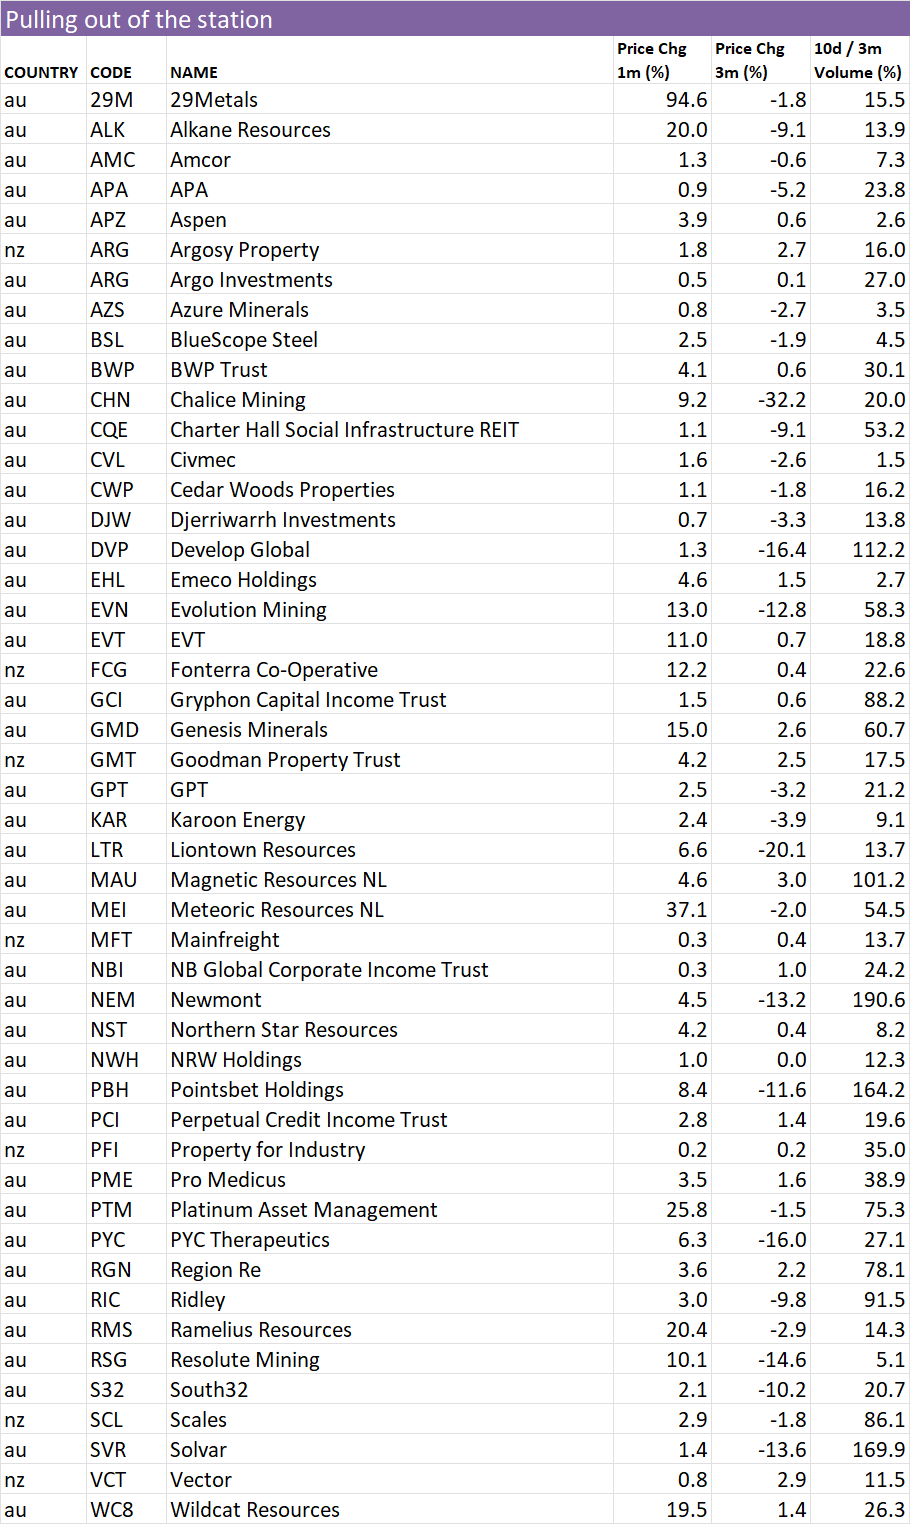
“Bus pulling out of the station”
To learn more about this screen read the following article on the objective of the screen
Here is a shortcut in understanding the reasons why a stock is removed:
Volume drop = Bus might be moving, but no one is on it
Price 1 mth < 0% = Bus has been cancelled
Price 3mths >= 3% = Bus has pulled out of the station
Also look at the market capitalisation and liquidity before making any decisions!
Data is at 23 March and is sorted by the stock code.
Changes from last week
“Pulling out of the station” on 23 March
52 week high screen
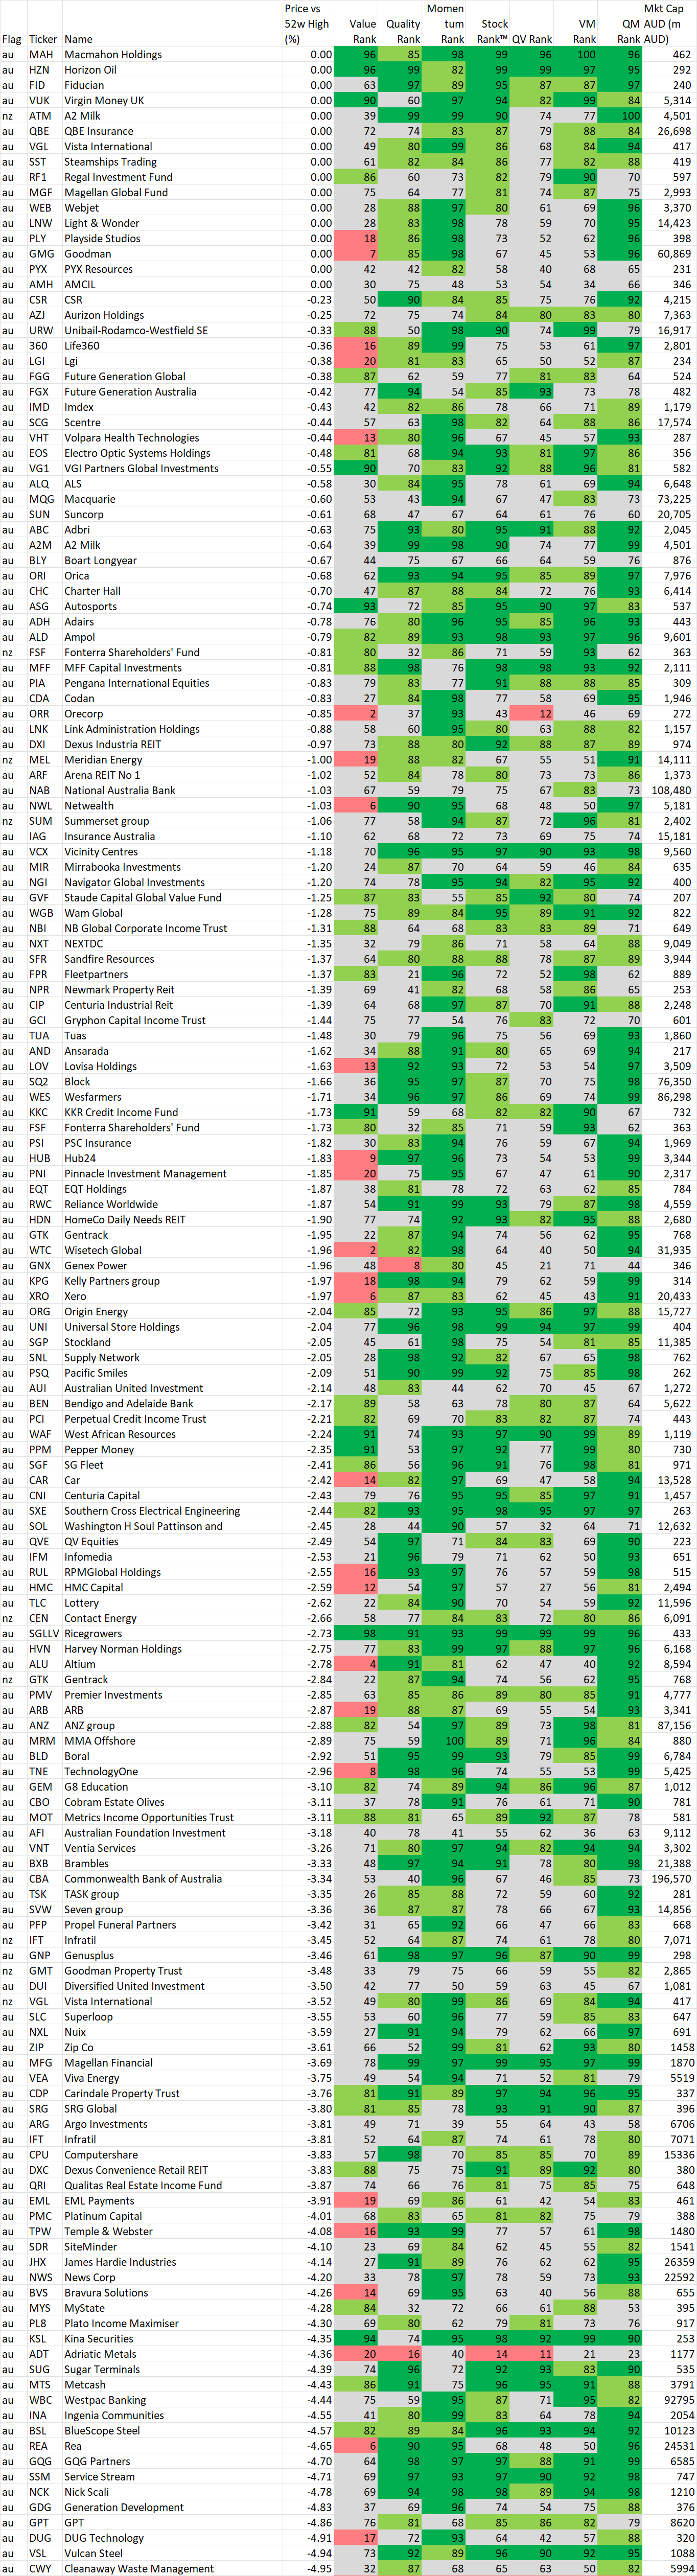
In this section we identify stocks within 5% of their 52 week intraday high based on the idea, supported by academic studies, that stocks close to their 52 week highs tend to outperform. Weekly changes to the list will also be noted.
If you wish to recreate this screen in the screener select "Price vs 52 high" greater than -5% and Mkt Cap greater than $200M
A stock coming onto the list is NOT an automatic buy, just as a stock that leaves the list is NOT an automatic sell. As with the shine list, assess every chart on its merits. However movements on this list may alert you to interesting charts so be sure to look at Stockopedia and the chart first.
Data is at 23 March and is sorted by the stocks closest to their 52 week intraday high.
Also look at the market capitalisation and liquidity before making any decisions!
And remember, past performance is no guarantee of future performance.
Changes from last week
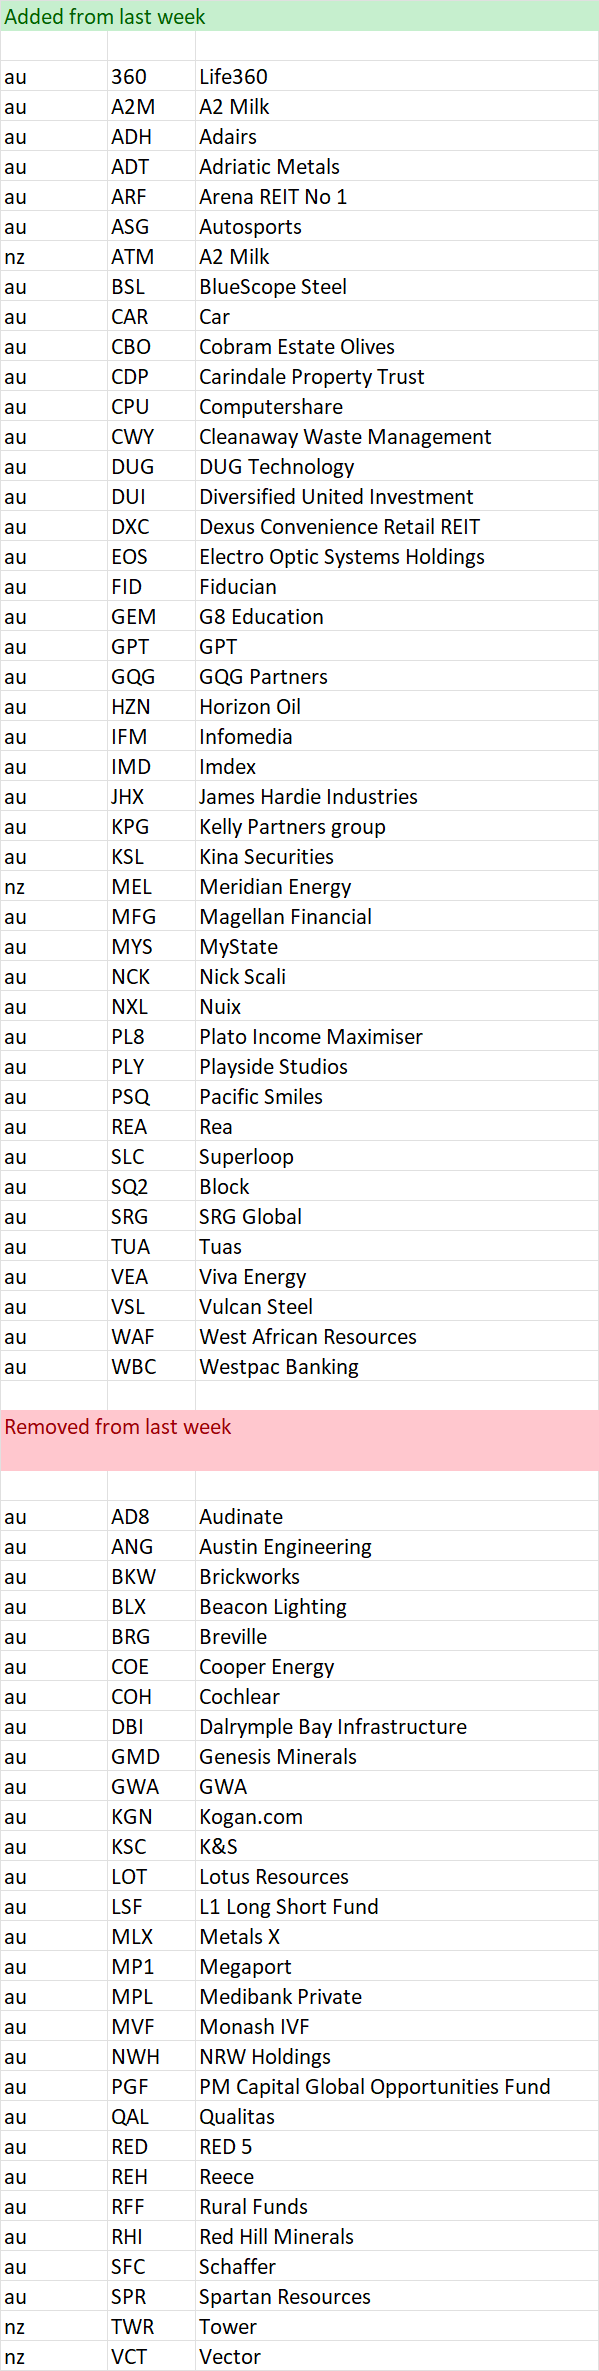
Stocks within 5% of their 52 week high as at 23 March
_____________
Important Information: Stockopedia Ltd ABN 39 757 874 670 UK business registration number 0637267 (“Stockopedia”) is an Authorised Representative of Daylight Financial Group Pty Ltd ABN 77 633 984 773 (“DFGPL”) which is the holder of an Australian Financial Services Licence (AFS Licence No. 521404).
Information in this commentary is current as at date prepared unless otherwise stated. However, please bear in mind that investments can go up or down in value, and that past performance is not a reliable indicator of future performance. For more Important Information please refer to the Disclaimer section of this website.
This communication may contain general financial product advice. It has been prepared without taking into account your personal circumstances, and you should therefore consider its appropriateness in light of your objectives, financial circumstances and needs before acting on it.
If our advice relates to the acquisition or possible acquisition of a particular financial product, you should obtain a copy of and consider the Product Disclosure Statement (PDS) before making any decision.
The author holds interests in companies in PDN and stocks listed in the data tables . This position can and will change at any time without notice.
Disclaimer
This is not financial advice. Our content is intended to be used and must be used for information and education purposes only. Please read our disclaimer and terms and conditions to understand our obligations.
3 comments
Thanks for your comments on NHC where my patience is being tested. I had hoped that fitness in their smaller met coal market would offset the thermal coal problems. Wrong!
On a happier note my MMA Offshore (ASX:MRM) are benefitting from the takeover bid but I feel that we are giving away too much medium term upside. The price has been rising well over the last couple of months and my cynicism inevitably whether there might have been some news leakage. I wondered whether Australia is more proactive in going after this sort of question, it surely cannot be as completely useless as the FCA in the UK, where paying salaries to the staff seem to be merely an act of generosity.
Its painful to see many great Aussie business gobbled up any offshore entity once they are successful. Though I am a happy 'risk taker' with MMA from the early days. Just remember that takeover valuations are often about pricing the future cashflows of the existing business to today's value. One could argue that this reduces risk and that they wouldn't achieve more than that if it wasn't for the acquisition. That is the comfort of seeing a great story like this taken off the bourse (and still holding a NHC - a good business but as a Price Taker, it is hard at the moment.)
Less is more powerful, Elio. You guys do an outstanding job