Momentum Monday 26 June

Welcome to Momentum Monday, and the last week before the end of financial year.
This week was a reminder to all of us that the minute we think markets and life in general are predictable we can receive a curveball from left field that no one saw coming. Therefore if you are a Momentum Investor, never have preconceptions of anything, just trade what is presented in front of you.
Just a reminder of our market wrap that we make available on our social channels. Here are the links to the respective pages:
Facebook: https://www.facebook.com/StockopediaANZ/
Twitter: https://twitter.com/Elio_DAmato
Taken from my afternoon report on ABC Radio Melbourne, they are short punchy grabs for the day just gone. Nothing overly insightful, just a wrap on the big market news items, sprinkled with a bit of humour at times. The recording will appear regularly within your feed at about 4:45pm - 5:00pm each day.
The content for this week's edition is:
Broader market sentiment
Member corner
Stocks in the “Shine Zone” (including changes)
52 week high screen (including changes)
A reminder that you don’t have to read all this contribution. Simply scroll to the area of interest. If you have any suggestions for us, please be sure to include them in the comments below (but I reckon it is pretty good now!).
Broader Market Sentiment
We look at the direction of both the US and ASX markets to gain an understanding of the broader sentiment at the minute. While this analysis is not to time specific entry into or exit out of stocks, they are useful in helping us determine how aggressive/cautious traders should be in their trading.
US S&P500
As mentioned for the last two weeks, each positive week brings us closer to the next down week... and so it was for the US with the S&P500 seeing first negative week since early May, 5 weeks ago.

S&P500 Weekly chart
In a shortened trading week for the US, the index fell about 1.5% with the major reason attributed being Chairman Powell's hawkish interest rate comments despite leaving rates on hold a fortnight ago.
This week's performance however doesn't change any of the narrative from last week. 4056 is our very short term support level and the upside target remains 4543.
The comments from Chairman Powell did have an impact on the Regional Banking sector as the continued QT (quantitative tightening) ie the Fed reducing the size of its balance sheet, creates immediate liquidity tightening in the sector, impacting their ability to access capital.

PCQ:KRE SPDR Kbw Regional Banking (Etf) 2 year weekly chart
With 40% of the economy's lending and 30% of bank held assets, the sector is being continually watched following the collapse of SVB, Signature Bank and First Republic. The broad ETF that covers the sector is down 50% since the peak at the start of 2022. This is very unusual behavior for a broad based ETF based on "Banks". The talk from Chairman Powell is that the sector is ripe for further regulation, especially the big players, but with over 40% of deposits held within regional banks not insured, runs on stocks (not to mention deposits) will not be unusual.
As an aside the rapid escalation and subsequent de-escalation of Russian civil instability will unlikely have an impact on the market. Though Russian leaders haven't had the best track record in history following questions to their leadership. The big hope for markets is that many of the supply and inflationary issues caused by the conflict in the Ukraine may soon be seen to be abating. If this perception grows it will help short term sentiment.
S&P/ASX200
For the last few weeks we have said that doing less is more at the minute with the Australian market, no better evidenced by the past week where the market gave back all of last week's gains and then some.

ASX:XJO Weekly chart
This was quite unfortunate as the market started the week positively enough, but amid global and local recession fears, fell in the later half to a point where June is likely to be our second down month in a row.
Short-term support remains at 6995, and the bottom support of 6474 will hopefully not be tested. Fingers crossed CPI dosen't disappoint. Especially after the strong jobs report last week, any motivation to lift rates by more than 25 basis points will not be welcomed.
One thing I noted with interest last week was the significant amount of companies no longer trading near their 52 week highs. While not a sell signal, it tells you the market is very wary to lock in gains for those stocks that have done well. You can see the current list below and compare it to last week’s Momentum Momentum report to get a sense of the magnitude of change.
For our Aussie market next week will be the final week of the financial year. It is significant for a range of reasons, including that for fund managers, many leagues tables and performance hurdles are met at this time of year. Often there can be strange price moves this week as fund managers engage in window dressing to help their own performance. Try not to get caught up in it though.
But as it stands at the moment, barring any disasters, FY23 will be positive, because July 1 started at the bottom end of the channel we have been stuck in for some time and now we are towards the upper end.
So while the nightly news services will point to gains for the year, those of us with money down know that the market has been going sideways, and by extension, it has been tough for momentum investors. More on that next week.
Also be aware if you are holding ETFs or property and investment trusts, many of these investments will be going ex-dividend next week before or on 30 June. So if you notice any price volatility, be sure to check if your stock has gone ex-div.
Member corner
In this section we will provide a detailed chart assessment, on a maximum of ten stocks weekly, on companies from those of you in the Gallery.
If no one asks for a stock to be analysed, this section will remain blank.
Also please note, that while we may receive a number more queries than ten per week, we retain the right to save a stock for another week, or ignore it all together.
The analysis will be akin to what was covered under the “Stocks of Interest” within the previous Momentum Monday reports and is highlighted in the Shine Zone area below.
If you have a stock you would like analysed from a momentum perspective, please write it into the comments section below or email us at @stockopedia.com.au">support@stockopedia.com.au
ASX:AVH Avita Medical
StockRank 56
Momentum Rank 97
QM Rank 75
VM Rank 66
A$4.82
AVITA Medical (ASX:AVH) is a regenerative tissue company that takes a tissue-sample, which is less than 20% of what's normally taken for a skin graft. Then, they disaggregate the cells, put them in a buffering solution (spray on) that enables accelerated healing where applied.

The FDA approval you speak of was for the Vitiligo product which is a skin condition where patches of skin become pale or white. The technology when applied helps with repigmentation.
This broadens the potential of the product as it is 5x potential patient target of the current offerings. So they still need to be able to sell it, but the potential has seen the price finally pick itself off the canvas after a very aggressive sell down over the past three years.
From a short term trading perspective it looks exciting as the tailwind of positive news may help it along. A break above $4.99 resistance will likely see price go for a gallop. I really I would like to see the recent gap filled between $4.29 - $4.75 so I think there is better buying in the mid $4.30’s The next upside target would be $5.80. Beyond that, and the stock has a lot of work ahead of it. Updates on actual sales will be the catalyst to help the stock get back to 2020 levels.
ASX:PNV Polynovo
StockRank 44
Momentum Rank 56
QM Rank 59
VM Rank 34
A$1.405
Polynovo (ASX:PNV) dermal repair membrane for the treatment of a range of skin ailments. Basically it is a synthetic scaffold that forms the building framework in order to regenerate the dermis.

I will state at this point that I hold PNV from a fundamental perspective. I like it ahead of competitors because it is synthetic, has a potential great number of uses and is cheaper than many other competing products. There has also been rising use among practitioners for use for other skin conditions which has broadened its appeal and you mentioned the record sales period just announced.
But it is clear the market disagrees with me as the price of PNV has suffered. Despite the strong sales growth, the market has taken the sword to it since Feb on negative cash flow and the rising rate cycle (which decreases the valuation on such businesses).
The new Novasorb MTX product which has just received the ok from the FDA offers potential new growth avenues. Geographically it is looking for further expansion into the US, especially on the issues that a competitor Integra is facing and excitingly it is looking into India.
But focusing on Momentum, and since the start of 2023 it has been tough. The price and 50 day MA are both below their 200 day MA. PNV must hold $1.27.
Upside targets can be quite high, though that will need to be supported by profitability or a possible takeover. If it can return to a positive trajectory, I see little in the way of resistance to $2.65. But it needs quite a bit to go right for it.
If I wasn’t holding it, I would wait until the price crossed above the 200 day moving average at least if I wanted to potentially benefit from some big targets ahead. I mentioned I owned it. I have done so for a very long time, and I have recouped my original investment so I am playing with other people's money (this is the idea that you recoup your original investment and leave your profits on the market. I find it helps reduce stress in stocks that I believe in, but exhibit extreme volatility like PNV - otherwise from $4 in 2021, I would be very stressed.)
ASX:4DX 4D medical
StockRank 41
Momentum Rank 83
QM Rank 64
VM Rank 43
A$0.715
4DMedical (ASX:4DX) owns the XV Technology,a platform used for respiratory imaging beyond traditional expensive means of detecting pulmonary embolisms.

ASX:4DX 1 year Daily chart
The stock picked up a lot of steam as news started to surface of the first commercial application of the technology. The inevitable capital raising and hype followed with the price reverting all the way down.
While from a business perspective these developments have been positive, from a price perspective we should be worried by a chart like this.
However if price can stop falling here, and resume on a positive trajectory I would want to see it cross above $1.135, then have its obligatory pullback and then run again. Otherwise this is in the too hard basket.
From a momentum perspective we need to remember that often prices can run too strongly when advancements/discoveries are first made. Just like in 2020 when the price popped to $3 and just like I referred to in the Lassonde Curve I spoke about for mining companies last week, the same can be said for Biotech stocks. Very rarely if ever is your first investment your last, and often the most hype is at the beginning but then drops off once Father Time takes over.
But if we take a broader look at the chart, we can see since listing the stock has been in long term downtrend. Long suffering shareholders will hope that the recent bounce, and subsequent retrace can be maintained and for the catalyst for a new Higher High. Something it hasn't seen since 2021.
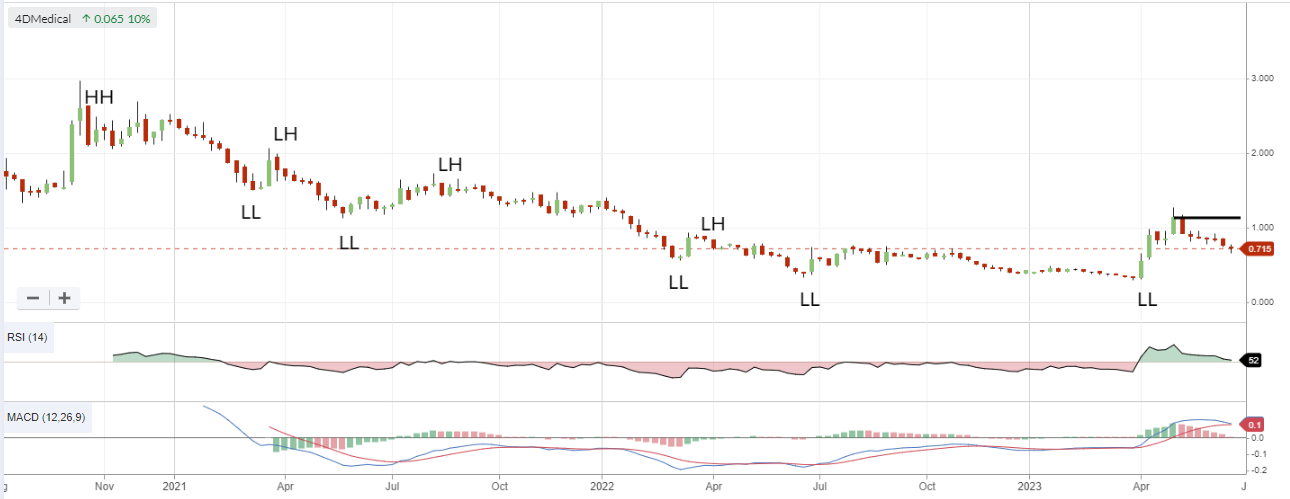
ASX:4DX Weekly chart. Since listing.
ASX:KGN Kogan
StockRank 91
Momentum Rank 93
QM Rank 93
VM Rank 89
A$4.92
Following the significant inventory pain that Kogan.com (ASX:KGN) has been trying to work through, from a chart perspective this looks ripe for a run.

ASX:KGN 1 year Daily chart
The stock recently created a new 52 week high and broke through the stubborn resistance it has encountered since August last year. Further supporting the move for the year each new low has been a higher low, adding further weight to the recovery.
Price pulled back to the previous resistance (now support line) after the creation of a new HH and it is in the shine zome will all movings averages in the right spot and moving in the right direction.
I will disclose at this point that if the stock holds its own on Monday morning, I will be buying (so I will note it in my disclosure of interest below.) However in my mind this is a trading stock. Given the outlook for the broader retail sector I will be watching this like a hawk and using shorter term levels.
But a set up like this can’t be ignored I am afraid. My parachute stop loss will be at $4.28.
ASX:LYL Lycopodium
StockRank 98
Momentum Rank 95
QM Rank 99
VM Rank 97
A$9.81
We included Lycopodium (ASX:LYL) in the NAPS Australia and NZ portfolio at the start of the calendar year and it has been one of our better performers.

ASX:LYL 1 year Daily chart
But since April it has come up against some stern resistance on account of the broader weakness among many ming related stocks.
Notwithstanding the strong trend for the year, the chart has a ‘rollover feel’ about it. Though it could stop and go the othert way with this period of consolidation given it the energy it needs for the next leg up.
Either way, if I wasn’t holding the stock, I wouldn’t be making a decision either way until there is a breakout of the sideways channel.

ASX:LYL 3 months Daily chart
If I was holding the stock and I only bought them recently within the last 3 months, the bottom end of the channel would be my stop loss. If I held them earlier, than that I would look at , I would look to set a stop loss at $8.35.
As mentioned previous in other articles, their per hour EPCM (Engineering, procurement and construction management) first strategy, rather than fixed EPC style contracts, means investors apply more value to the company. Especially in the lead up to uncertain times. Though for now from a chart perspective we are waiting for clear direction.
Stocks in the Shine Zone
To learn about the Shine Zone and how to use it, you can read it here.
The rules for inclusion in this list are based on those I like to see in a stock before considering a trade in it:
QM Rank above 80
Price is above the 2.5x ATR
50d MA is above the 200d MA
Price is greater than the 200d MA
Market cap greater than $200M
To reiterate that the “Shine Zone” are rules for possible buying. They are not for holding and/or selling. Read the “how to” article above to learn more
Data is at 23 June and is sorted by the stock code.
Changes from last week

Shine Zone list as at 23 June

52 week high screen
In this section we identify stocks within 5% of their 52 week high based on the idea, supported by academic studies, that stocks close to their 52 week highs tend to outperform. Weekly changes to the list will also be noted.
If you wish to recreate this screen in the screener select "Price vs 52 high" greater than -5% and Mkt Cap greater than $200M
A stock coming onto the list is NOT an automatic buy, just as a stock that leaves the list is NOT an automatic sell. However movements on this list may alert you to interesting charts so be sure to look at the Stockopedia and the chart first.
Data is at 23 June and is sorted by the stocks closest to their 52 week high.
And remember, past performance is no guarantee of future performance.
Changes from last week

Stocks within 5% of their 52 week high as at June 23, 2023

Important Information: Stockopedia Ltd ABN 39 757 874 670 UK business registration number 0637267 (“Stockopedia”) is an Authorised Representative of Daylight Financial Group Pty Ltd ABN 77 633 984 773 (“DFGPL”) which is the holder of an Australian Financial Services Licence (AFS Licence No. 521404).
Information in this commentary is current as at date prepared unless otherwise stated. However, please bear in mind that investments can go up or down in value, and that past performance is not a reliable indicator of future performance. For more Important Information please refer to the Disclaimer section of this website.
This communication may contain general financial product advice. It has been prepared without taking into account your personal circumstances, and you should therefore consider its appropriateness in light of your objectives, financial circumstances and needs before acting on it.
If our advice relates to the acquisition or possible acquisition of a particular financial product, you should obtain a copy of and consider the Product Disclosure Statement (PDS) before making any decision.
The author holds interests in stocks highlighted specifically in the article: PNV, KGN and other companies listed in the data tables . This position can and will change at any time without notice.
Disclaimer
This is not financial advice. Our content is intended to be used and must be used for information and education purposes only. Please read our disclaimer and terms and conditions to understand our obligations.
5 comments
A belated thank you Elio. Much appreciated your commentary on the medical stocks.
Thanks Elio, great article again. Life360 (ASX:360) looks interesting at the moment, would appreciate your thoughts.
Thanks turbo08. I might have to carry this over to next week. But for now, it is at 52 week highs and supported by the tech run in the US (where it mostly operates) so the chart looks good. *held
Appreciate a review of Allkem (ASX:AKE) ; Aristocrat Leisure (ASX:ALL) Brambles (ASX:BXB) James Hardie Industries (ASX:JHX) Reece (ASX:REH)
Hi Elio, I'd be interested in your comments on XRF. It has fallen below the ATR, but does look like it may still be in an uptrend and starting to recover from the recent pullback.