Momentum Monday 26th August 2024

Welcome to Momentum Monday.
Markets were up and nothing adds to positivity like a Presidential Campaign Conference in the US… Full of Celebrities, Politicians and Wannabe’s. So how does the financial press report on it? Not all that heavily. Especially when it doesn’t suit their narrative. But then again markets are at all time highs? So we are happy, but it certainly makes it hard to write about (I can vouch for that), which is bad for media businesses, particularly as fear sells (as you are all well aware.).
But before I continue let me make this clear…. “The Markets are positive! They both (US and Oz) closed on weekly highs.” *Phew* I’m glad I got that out, because reading the financial press over the weekend, it would be easy to forget this simple fact.
Interesting links
This week on Weekend Watchlist run in conjunction with Shares for Beginners, we cover a stock we have discussed before and why a buy-back cant even help it. It’s AZJ Aurizon. Listen here to the replay
Don’t forget to “Empower Others”. There is no better time to refer the award winning platform which is Stockopedia than right now. To Learn read more here
For any external commentary we make to the broader market, follow us on Social Media Facebook Linkedin Instagram or X (formerly Twitter)
This week’s content is as follows:
Broader market sentiment
Member corner
Stocks in the “Shine Zone”
Momentum Movers
52 week high screen
A reminder that you don’t have to read all this contribution. Simply scroll to the area of interest.
Broader Market Sentiment
We look at the direction of both the US and ASX markets to gain an understanding of the broader sentiment at the minute. It is important to stress here that I DO NOT use this to time my entry or exit out of stocks. I prefer to use the individual charts of stocks to do that. However I find it useful in helping us determine how aggressive/cautious traders should be in their trading. In short the more positive the broader market is the more risks you can take and vice versa.
US / S&P500
Well if you ever want to now what kerosene looks like in words, try having some clout and then saying, “The time has come for policy to adjust”. Just like Chairman Powell did on Friday (their time) and we saw the S&P500 pop.

S&P500 Weekly chart
To be fair though, we already knew a rate cut was coming in September. These words from Chairman Powell at Jackson Hole probably iced the deal. This lead further reduction in 10 year treasury yields and a weakening of their currency, though Gold was the beneficiary as it continues to trade near all time highs (and we have seen this positivity for the precious metal appear in our local producers.) All this aside, I even read reports this weakened that the tightening bias from the Fed is not a 180 degree turn around.
But it was another strong week for the broader S&P500 as it rose 1.45% and closed at a new weekly all-time high. Everyone's eyes will be on Nvidia next week. While the majority of the S&P500 have reported their quarterly earnings, the chipmaker will release its results on Wednesday (Thursday our time). This will be important because of the Magnificent 7 it has seen the most meteoric of rises and will tell us how much hype is left in this rally.
Though pleasingly, there has been quite a bit of support for smaller businesses as the very broad Russell 2000 actually rose by more than double than the S&P500 did. This indictes this recent rally may be due to more than just the M7.
And there is hype involved. But it is not a dirty word, particularly when it comes to Momentum. You just have to acknowledge that it can go the other way as well. But at all time weekly price highs there is not much more to add at the moment.
I have said for some time that 4967 is my watch and act level, and it is for this week. However, another positive week and that level will be raised to 5151. I have no option - particularly if markets keep going up. In my view there is no need to change perceptions at the minute.
AUS S&P/ASX200
It was pleasing to see the rebound of the previous week was sustained and we saw another rise this week. It ensures that from a price perspective there is no need to change our demur.

S&P/ASX200 Weekly chart
I really feel I can’t add much more than that from a positive perspective. I mean after all, we closed at a new weekly all-time high.
I am obviously be looking for signs that our market trend is over. But it is not just as key support levels were not broken, nor are any of the indicators in the negative. To be negative I would need to see the RSI below 50 and the MACD would be below the Breakeven line with the slower moving average above the faster moving one. But I see none of that and the strength expected on Monday would suggest it is not coming soon either.
It's reporting season in Australia and last week was the busiest thus far. As we know this is traditionally a time for volatility. Not just because of stocks hitting or missing the mark, but also stocks due to go ex-div and and if they pay a high yield to you will get more swings.
Margins are always a key theme, given they are the great profit expander. Especially in this inflationary environment. I even saw talk that New Zealand's economy was having a negative impact on earnings, despite their proportional contribution as being quite small. In the majority of cases we have seen stocks beat their expectations for this year. But we have seen a number of cautious statements about what is to come and therefore those stocks have been sold off somewhat. Looking at ING Inghams Chicken on Friday is a great example of that.
The other bit of big news for our market is the price of Iron Ore at the moment. The price of iron ore has traditionally been quite opaque. However there is now a collective view that the price has gone below US$100 per tonne. The worrying thing for those still involved with Iron Ore stocks, beyond the price decline, is that forecasts are for a tough two years coming for the steel making agent. Be it either the lack of Chinese action or the rising levels of supply, the view is definitely more bearish. However, will they be right? Well unless you have direct access to the drivers of price, you really don’t know. But you will probably see it best reflected in the price of Iron Ore producers going forward. As always, the market is forward looking and therefore will be more interested in what is to come, rather than the current situation, therefore keep monitoring them as a sign to wear this important commodity for our market and economy is headed.
The lists below are heaving, particularly stocks in the shine zone and stocks at their 52 week high. Its like shooting fish in a barrel at the moment. It eventually won’t be this easy, but for now make hay while the sun is shining. Why hold onto anything going the wrong way?
So 7547 remains my focus level for now. Hopefully a strong week comes this one.
Member corner
In this section we will provide a detailed chart assessment, on a maximum of ten stocks weekly, on companies from those of you in the Gallery.
We welcome stock requests to be analysed from members. We will also be looking at the charts of some of the more actively researched stocks for the week. We will try to rotate through a selection so as to not make the charts stale, however we will likely not cover a stock within 2 months of when it was last discussed.
If you want to see what has been written about a stock recently, go to the discussion area.

We will not be making up suggestions. If there are no changes to the most viewed list and/or there are no suggestions from members, then no stocks will be covered.
To learn of the methods used to analyse companies in this section, refer to my Momentum Journey series that I articulate here in three parts.
They will help provide context on what I am writing about and the editorial angle of this report.
Also look at the market capitalisation and liquidity before making any decisions!
And again, if you have a stock you would like analysed from a momentum perspective, please write it into the comments section below or email us at @stockopedia.com.au">support@stockopedia.com.au
IF NO ONE ASKS… HOW AM I SUPPOSED TO KNOW?!?
ASX:WTC Wisetech Global
StockRank 71
Momentum Rank 95
QM Rank 99
VM Rank 50
A$120.14
We last covered Wisetech Global (ASX:WTC) from a Momentum perspective back in April. You can read what was said here

ASX:WTC 1 year Daily chart
At the time I said I would wait for the price to retrace before getting back into a , “ price range is $79.85 - $84.00. It got into the top end of that range and bounced. So I got in. Which is fortunate given the price performance on Wednesday and Thursday last week.
OK… so enough bragging what do we do now? (Note: if you are a reader of this as a trialist to our service - let me tell you that you have just paid for Stockopedia for decades on this one trade alone. But I suppose I have to tell members because if I don’t - no one else does.)
The gap up on Wednesday is a fair way below the current price, however it can’t be ignored. I think that this will be a good place to put a stop loss at $94.38 for those looking for a point where they can change their positive disposition on the trend.
Otherwise it is close to all time highs and from a Momentum perspective there is no better place to be irrespective of the pretty price one has to pay for them now..
ASX:PME Pro Medicus Limited
StockRank 73
Momentum Rank 99
QM Rank 100
VM Rank 49
A$151.49
Speaking of paying a pretty penny, a stock that is even more expensive (if you can believe that) is Pro Medicus (ASX:PME). I actually wrote about the business last week here and how it has managed to defy reality to get to this point.

ASX:PME 1 year Daily chart
From a Momentum perspective though I last covered it back in May and I talked about how it was a poster boy for the QM investor. I spoke of some support levels but it stayed above those, and now it is close to 52 week and all-time highs. I don’t know what else to add?
Perhaps I can say that for those trading the stock a support level could be found at $123.00. Otherwise carry-on.
ASX:LYL - Lycopodium Limited
StockRank 97
Momentum Rank 85
QM Rank 95
VM Rank 91
A$12.15
In the same week we last discussed PME from a Momentum perspective, we also covered Lycopodium (ASX:LYL) . You can read that commentary here.

ASX:LYL 1 year Daily chart
Back then it was on an upward trajectory, with the risk a double top was forming. It didn’t happen, rather the price kept running. But then a double top started to form again in the lead up to their result (albeit higher than back then.) Unfortunately this time it failed and it looks like $11.60 is inevitable.
That said I wouldn’t put my stop loss at these levels. Rather if I was to take an aggressive stance, I will look further back to the structural higher low of $11.01 . At least I “won’t have to wait long to know if I am wrong.”
If I was going to take a position now my target would be anywhere between $13.50 - $14.00 for taking some profit at the point of the gap down. It would need to break above this area to suggest it could return to its positive momentum.
ASX:MAH - MacMahon Holdings
StockRank 99
Momentum Rank 96
QM Rank 99
VM Rank 99
A$0.33
Having just kept over the two month mark is Macmahon Holdings (ASX:MAH) whom we last discussed here.

ASX:MAH 1 year Daily chart
I actually woke up to the news that MAH was confirming the fatal incident which occurred at the Byerwen mine site. Such tragic news is never good to the value of the business. It looked like it was able to navigate that incident from a price perspective fairly well, though it is always difficult to tell with a stock who has challenged liquidity levels.
From a chart perspective, I last said that it looked promising but I would wait for a pullback. Well we got a mild one back down to around $0.25, and since then the price has popped.
OK so what next? As highlighted previously I felt the $0.285 level was significant given the pattern forming after what had been a long time. It would appear that breaking through it has brought on a relief rally as such. I therefore feel that level will be significant in the near term and from these levels it would be my stop loss level.
As for upside targets I see quite a bit of clean air ahead of it and it would not surprise me if the next level of significant resistance it faced was double these levels. However my past comments on the sector and liquidity remain, therefore I am going to give this a clear birth for the moment acknowledging that it won’t take much to move the price significantly one way or the other and I don’t need the added risk at the minute.
Stocks in the Shine Zone
To learn about the Shine Zone and how to use it, you can read it here.
The rules for inclusion in this list are based on those I like to see in a stock before considering a trade in it:
QM Rank above 80
Price is above the 2.5x ATR
50d MA is above the 200d MA
Price is greater than the 200d MA
Market cap greater than $200M
This is a very important point: the “Shine Zone” are rules for possible buying. They are not for holding and/or selling. If a stock falls out of the shine zone, use support levels to set your stops, or instigate a parachute stop if necessary. With markets moving sideways, one expects frequent changes in these lists.
If you feel there is a stock that should be included but is missing please let us know. This is a manual process and occasionally one gets through the cracks
Also look at the market capitalisation and liquidity before making any decisions!
Data is at 24 August and is sorted by the stock code.
Changes from last week
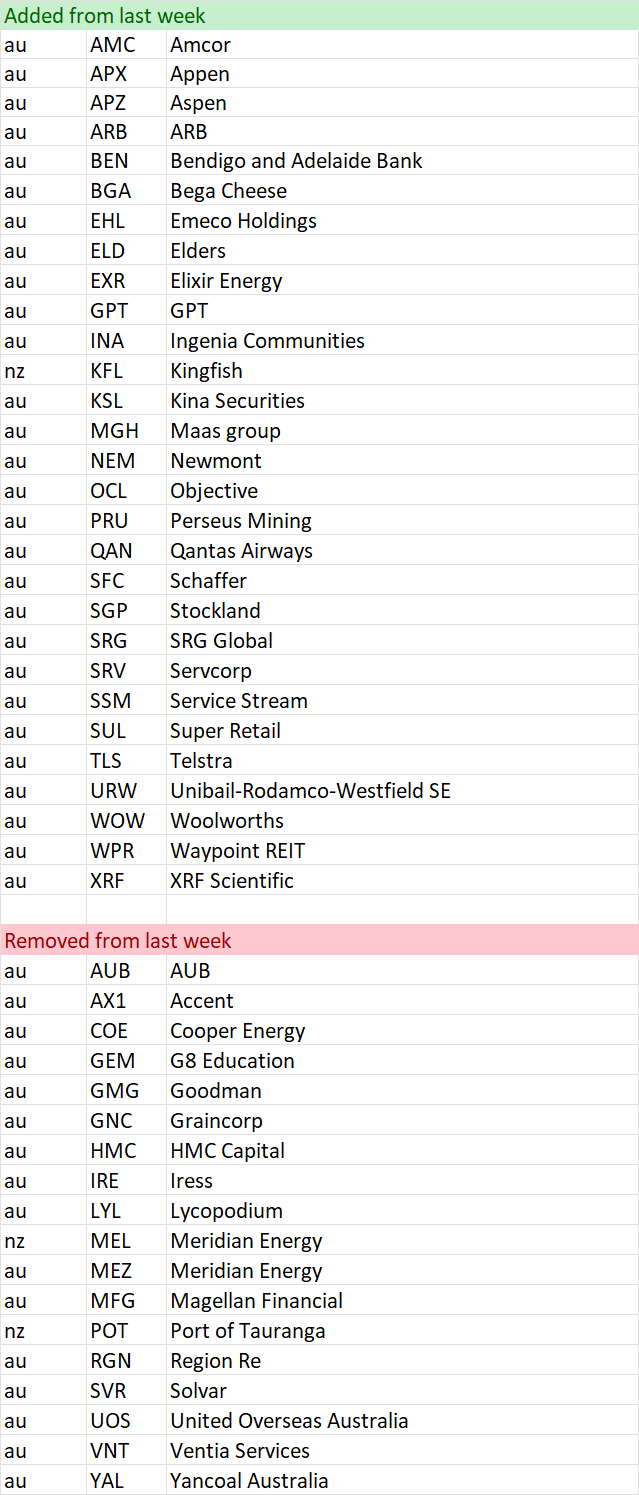
Shine Zone list as at 24 August

Momentum Movers
I have actually published an article discussing my thinking with these tables. You can read about it here.
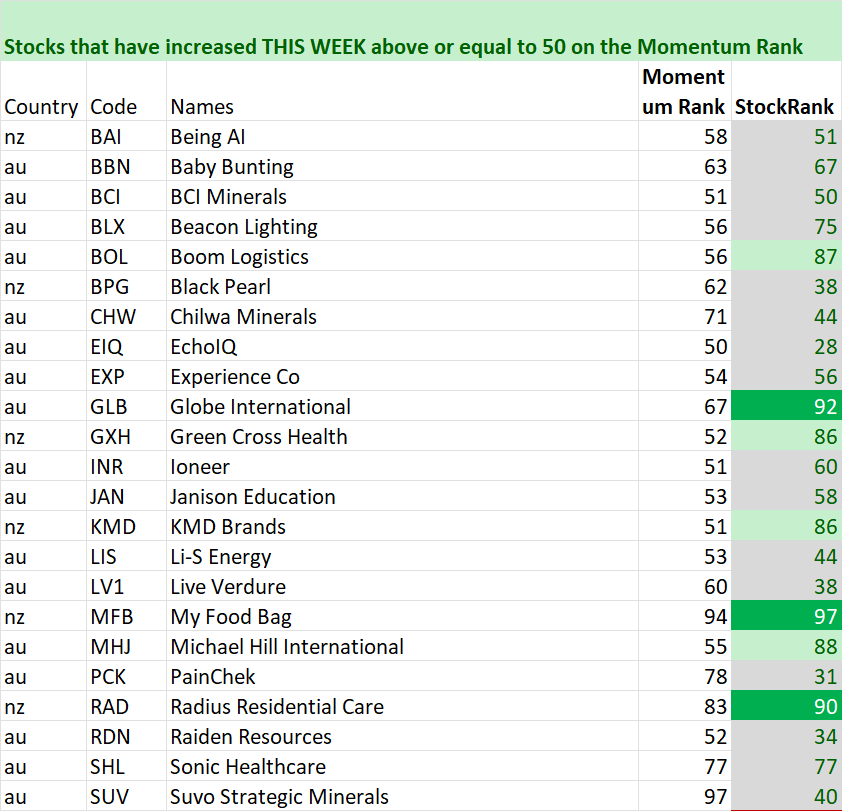
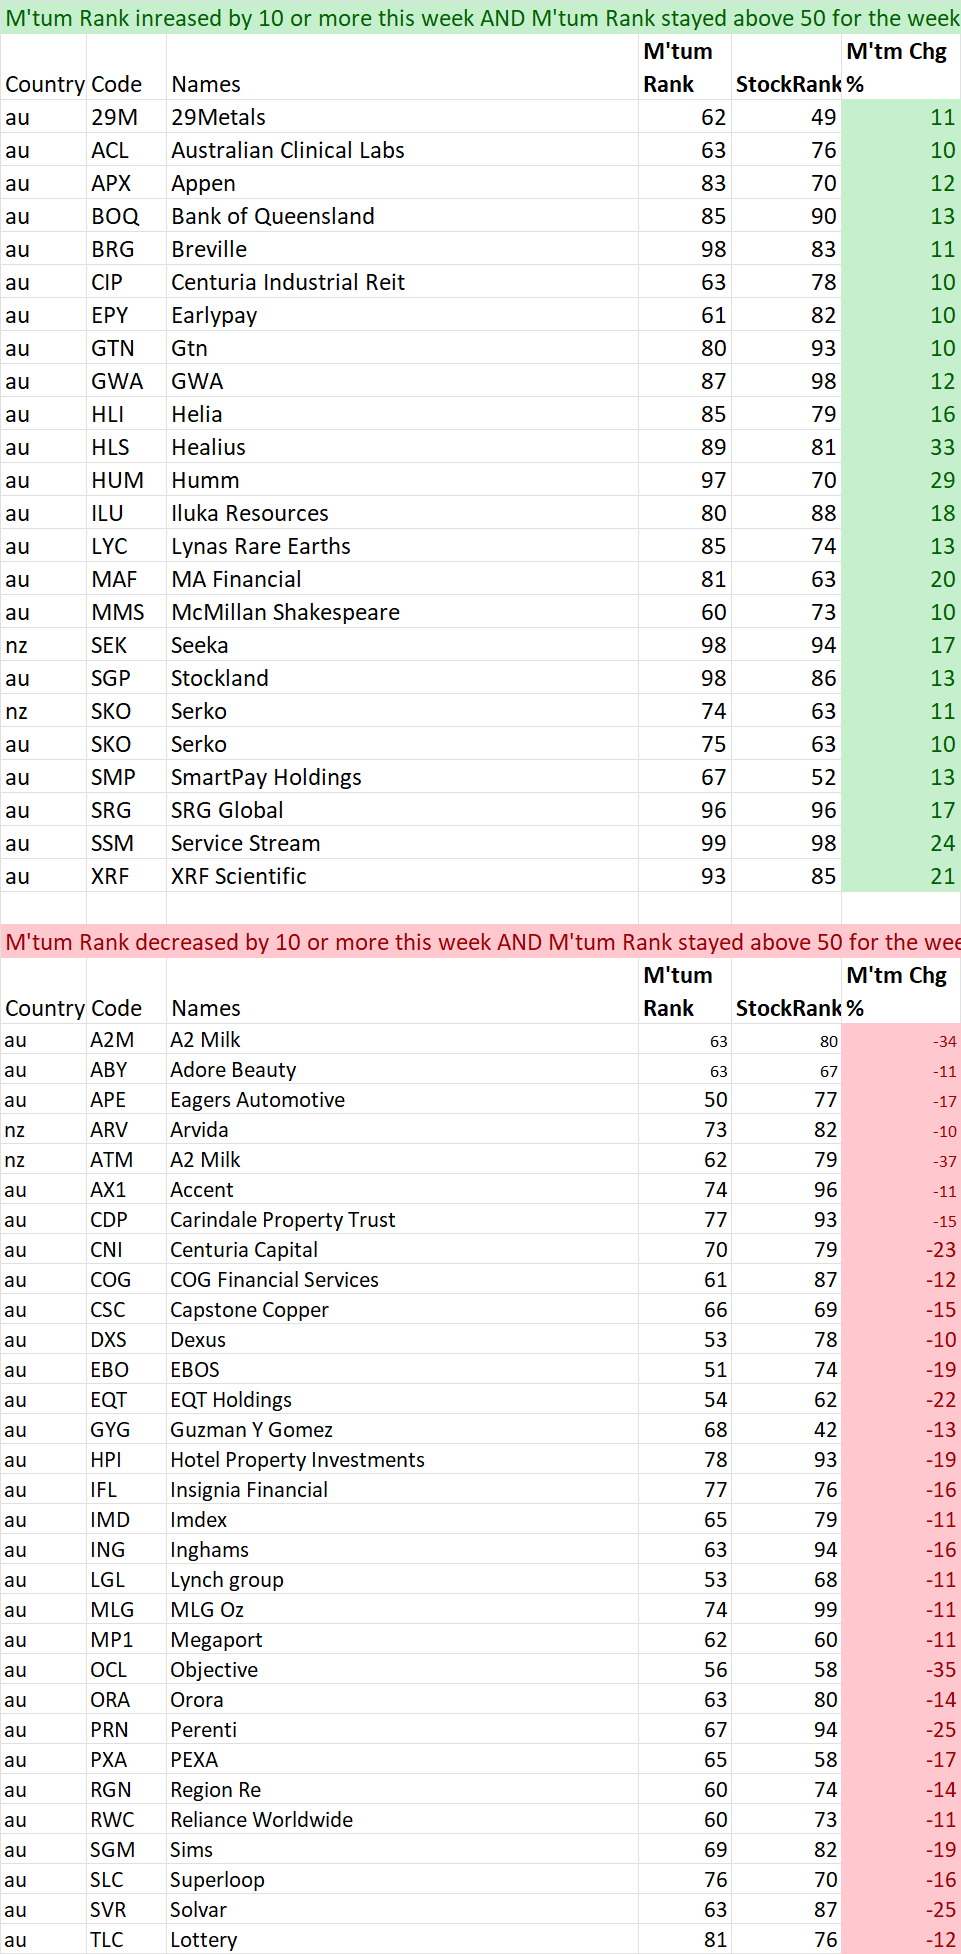
In summary, there is a school of thought that the change in something is just as important as the absolute number itself. Momentum is our most volatile ranking. This section is intended to bring to readers attention the big moves from a Momentum Perspective. As with other lists this is not designed to be a list of stocks that are replicated. Rather it can be a starting point of investigation for further consideration. Initially it will record weekly changes. This will include a monthly change when enough time has elapsed. This section is divided into two lists.
First is a list of stocks that have just crossed above 50 from a Momentum perspective. By definition, these will be stocks that have improved over the past week and month and may warrant further investigation. As a bare minimum a look at liquidity and market cap.
The second list measures all stocks that are currently ranked above 50, have remained above 50 during the time periods analysed (ie not just added or removed) AND whether they have improved or worsened by more than 10 points on the Momentum Rank.
With all filters a minimum market cap of $50 Mil has been included to help ensure investability from a small perspective. Be sure to check liquidity relative to your preferences.
As this is a new list we welcome any feedback you may have. If we have missed anything do let us know.
Data is at 24 August and is sorted by their code.
And remember, past performance is no guarantee of future performance.
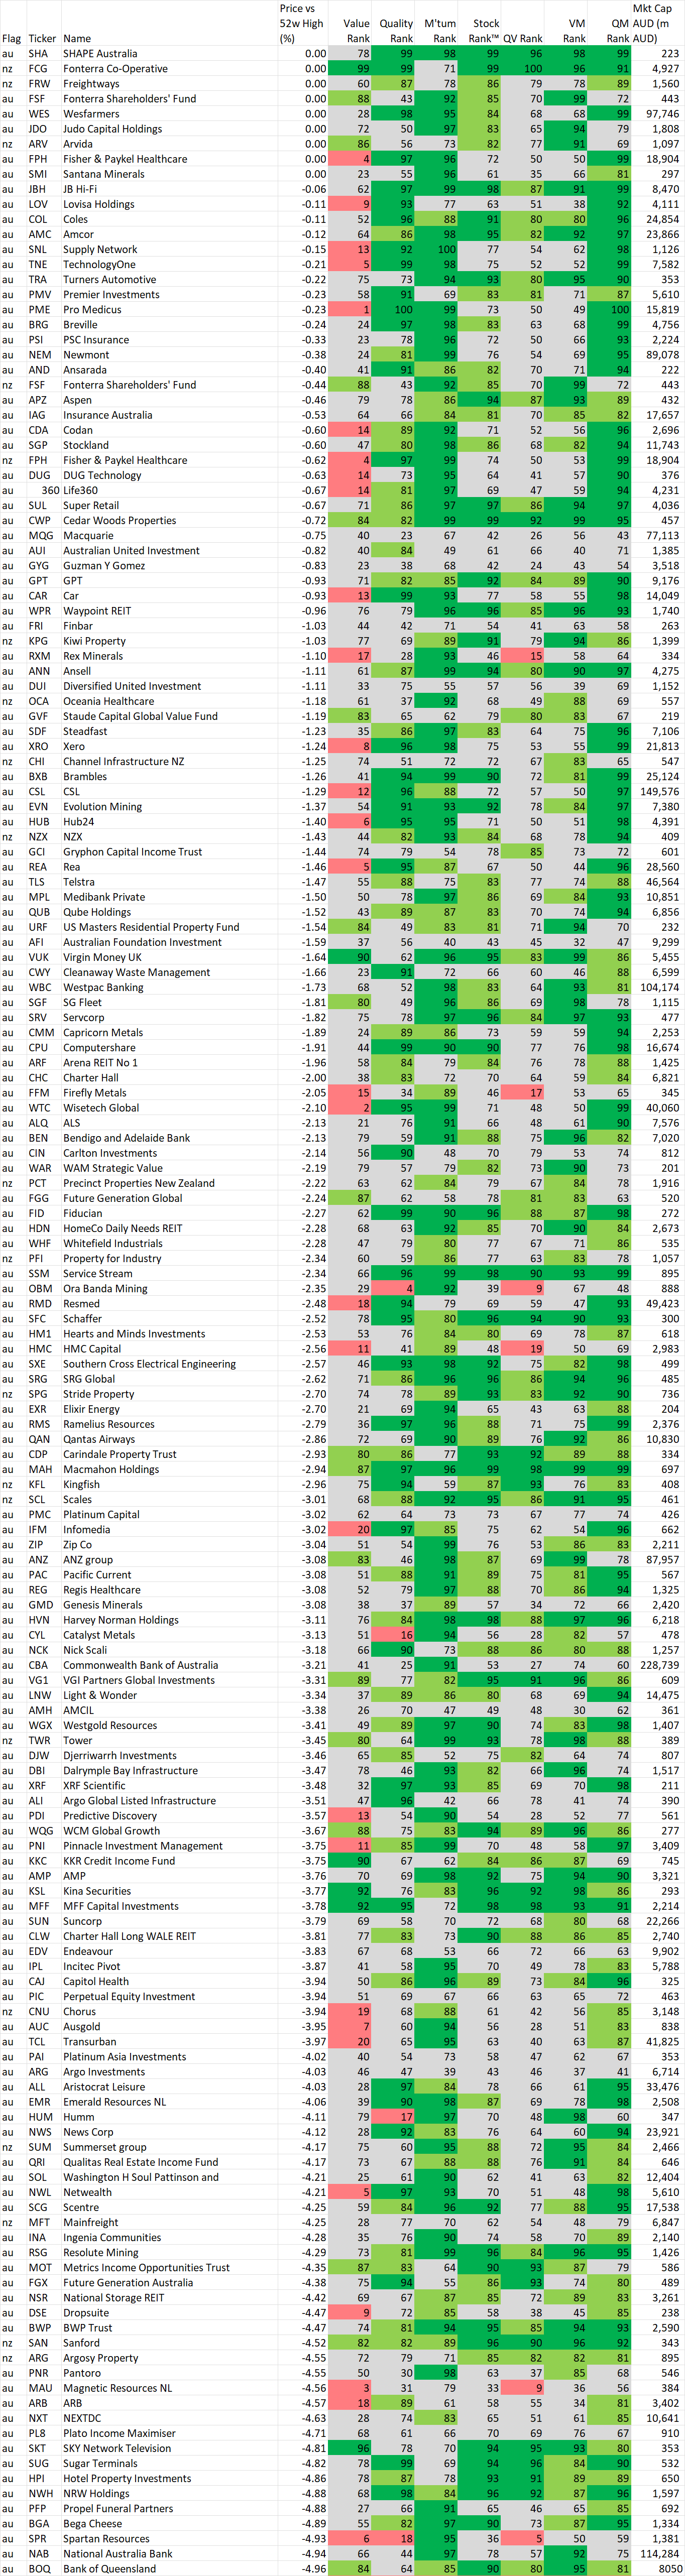
52 week high screen
In this section we identify stocks within 5% of their 52 week intraday high based on the idea, supported by academic studies, that stocks close to their 52 week highs tend to outperform. Weekly changes to the list will also be noted.
If you wish to recreate this screen in the screener select "Price vs 52 high" greater than -5% and Mkt Cap greater than $200M
A stock coming onto the list is NOT an automatic buy, just as a stock that leaves the list is NOT an automatic sell. As with the shine list, assess every chart on its merits. However movements on this list may alert you to interesting charts so be sure to look at Stockopedia and the chart first.
Data is at 24 August and is sorted by the stocks closest to their 52 week intraday high.
Also look at the market capitalisation and liquidity before making any decisions!
And remember, past performance is no guarantee of future performance.
Changes from last week
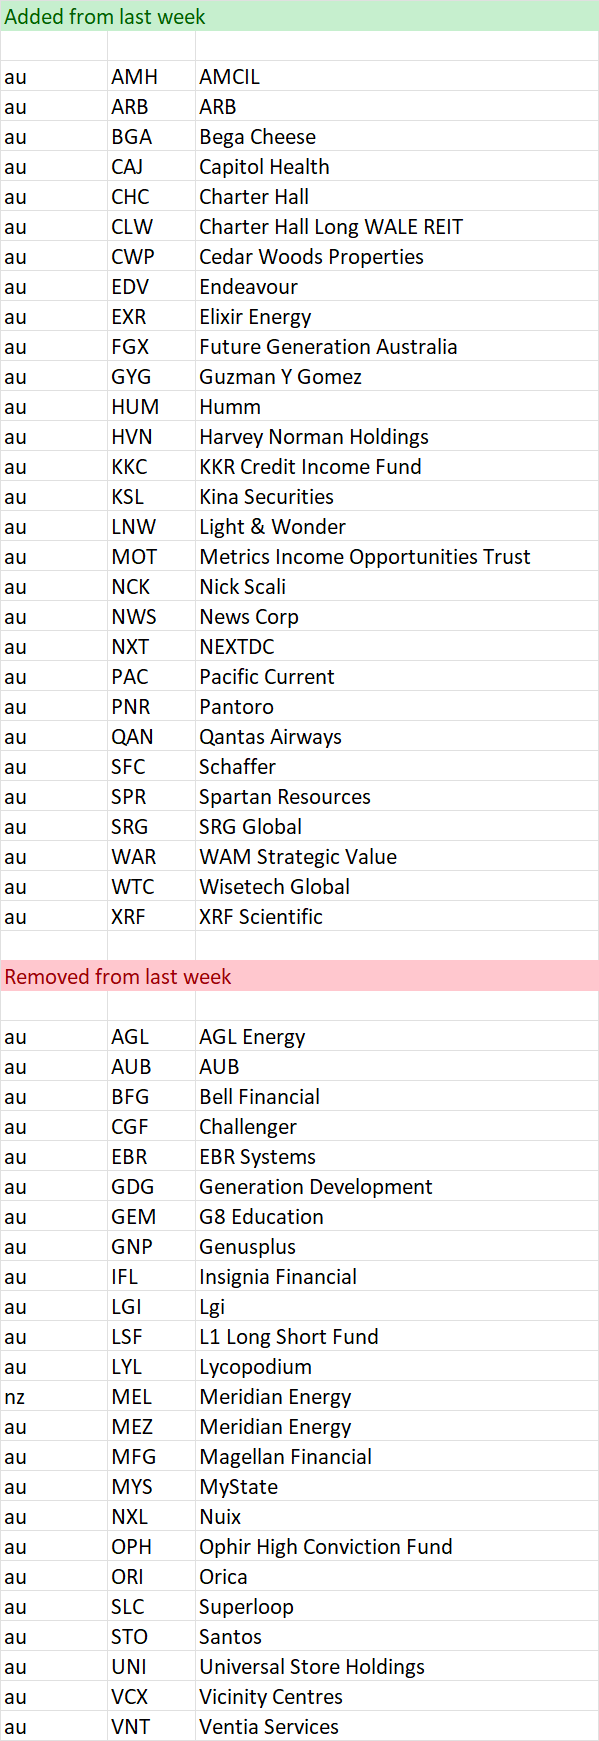
Stocks within 5% of their 52 week high as at 24 August
Important Information: Stockopedia Ltd ABN 39 757 874 670 UK business registration number 0637267 (“Stockopedia”) is an Authorised Representative of Daylight Financial Group Pty Ltd ABN 77 633 984 773 (“DFGPL”) which is the holder of an Australian Financial Services Licence (AFS Licence No. 521404).
Information in this commentary is current as at date prepared unless otherwise stated. However, please bear in mind that investments can go up or down in value, and that past performance is not a reliable indicator of future performance. For more Important Information please refer to the Disclaimer section of this website.
This communication may contain general financial product advice. It has been prepared without taking into account your personal circumstances, and you should therefore consider its appropriateness in light of your objectives, financial circumstances and needs before acting on it.
If our advice relates to the acquisition or possible acquisition of a particular financial product, you should obtain a copy of and consider the Product Disclosure Statement (PDS) before making any decision.
The author holds direct interests in WTC, PME and companies listed in the data tables . This position can and will change at any time without notice.
Disclaimer
This is not financial advice. Our content is intended to be used and must be used for information and education purposes only. Please read our disclaimer and terms and conditions to understand our obligations.
2 comments
Your thoughts on VYS please, Elio
Unfortunately it will miss the cut for this week coming. But it will definitely be covered next week.