Momentum Monday 26th February

Welcome to Momentum Monday.
Just as things were looking like a nice settled week, BOOM out comes Nvidia's result. It smashed estimates. It drives the market to an all time high, and it achieved the largest single gain in market cap every recorded. All this from a company who was overvalued…. So is it overvalued now? Does it matter if you picked it based on squiggly lines? It's heading north east, which is the right direction after all. And to be honest…. I am getting sick of answering the question.
For your reference, my cryptic response always is, “If you know why you get in, you’ll know when you have to get out.” The reality is not enough people are honest with themselves to answer truthfully.
Interesting links
Weekend Watchlist with Shares for Beginners this week is an education on how being forearmend is forewarned. We use the example of Core Lithium (ASX:CXO). Listen here to the replay
“Empower Others” referral program Learn more here
Follow us on Social Media Facebook Linkedin Instagram or X (formerly Twitter)
This week’s content is as follows:
Broader market sentiment
Member corner
Stocks in the “Shine Zone” (including changes)
Buses pulling out of the station (volume + price movers)
52 week high screen (including changes)
A reminder that you don’t have to read all this contribution. Simply scroll to the area of interest.
Broader Market Sentiment
We look at the direction of both the US and ASX markets to gain an understanding of the broader sentiment at the minute. It is important to stress here that I DO NOT use this to time my entry or exit out of stocks. I prefer to use the individual charts of stocks to do that. However I find it useful in helping us determine how aggressive/cautious traders should be in their trading. In short the more positive the broader market is the more risks you can take and vice versa.
US / S&P500
Its another record high for the broad S&P500. What moore can I say? (That is why this section is so short.

S&P500 Weekly chart
I mentioned NVIDIA in the opening and it was not surprising to see the pullback in the NASDAQ on Friday as there was some profit taking. But otherwise how could I fault what is going on? The market is strong (CAN YOU READ ENGLISH?!?) and all indicators are rocking.
All the macro stuff is noise when the record high is considered. And while much of this run has been driven by Tech stocks, with the ultimate question of a possible bubble occurring, all I will say is, “I will worry about it then.”
Just to pad out the section a little more, depending how point end your trading is you may wish to raise your support level to the previous high which is 4766. Personally I think this is a little tight, but it is a support level nonetheless. I would rather use 4589 which was my revised level a few months ago. But I will be as happy as a bear with a pot of honey if I have to keep raising that level.
For now, less is more. If I wasn’t in equities globally while our biggest market was at record highs, quite frankly, I never would be…. (and that will NEVER happen!)
AUS S&P/ASX200
What started the day as a small positive weekly gain for the S&P/ASX200 on the back of that solid NVIDIA result, disappeared later in the day and actually saw the market close down for the week (though only marginally)

S&P/ASX200 Weekly chart
On closer inspection we closed just above resistance, so in general terms we are still moving sideways, as I have said countless times before, I would rather be here than the alternative.
Last week I discussed briefly how I was taking a nibble in DTL and PME in an attempt to “buy the dips” in this strong overall market. Thus far both trades are positive (though it is early days), the later has been better.
In the case of PME, I have moved from a parachute stop to a close call stop. If you don’t know what that means I suggest you read Episode 3 below which explains my momentum journey.
Interesting that the number of stocks in the tables below remain high. Again another symptom of the market running, which is a good thing (in case you were wondering). To see more stocks where their 50 day moving average is crossing above their 200 day average is particularly pleasing.
Reporting season continues in earnest with reports from companies covered extensively elsewhere so there is no need for me to repeat the chat bots. Suffice to say that as always there have been winners and losers, even the bad results can be explained, the costs of doing business are increasing and you will go broke if you ever bet against the Australian consumer (except in the obvious cases).
While me and the next guy would want to see another push up. Back at the start of December last year I said if, “the index can stay above the support range and definitely above 6827 I maintain the faith..”
That hasn’t changed (in fact investors seem far more positive) therefore I remain exposed to domestic equities.
Member corner
In this section we will provide a detailed chart assessment, on a maximum of ten stocks weekly, on companies from those of you in the Gallery.
We welcome stock requests to be analysed from members. We will also be looking at the charts of some of the more actively researched stocks for the week. We will try to rotate through a selection so as to not make the charts stale, however we will likely not cover a stock within 2 months of when it was last discussed.
If you want to see what has been written about a stock recently, go to the discussion area.

We will not be making up suggestions. If there are no changes to the most viewed list and/or there are no suggestions from members, then no stocks will be covered.
To learn of the methods used to analyse companies in this section, refer to my Momentum Journey series that I articulate here in three parts.
They will help provide context on what I am writing about and the editorial angle of this report.
Also look at the market capitalisation and liquidity before making any decisions!
And again, if you have a stock you would like analysed from a momentum perspective, please write it into the comments section below or email us at @stockopedia.com.au">support@stockopedia.com.au
IF NO ONE ASKS… HOW AM I SUPPOSED TO KNOW?!?
ASX: PLS - Pilbara Minerals
StockRank 57
Momentum Rank 18
QM Rank 50
VM Rank 40
A$3.67
With a bit of favour returning to the sector, plus talk of government support to help an ailing business and with the stock crossing the two month threshold we look at Pilbara Minerals (ASX:PLS).

ASX:PLS 1 year Daily chart
But I want to be clear. Its troubles are far from behind it. The price of Lithium Spodumene has fallen 85% since its peak, and 50% in the last few months alone.

Lithium Carbonate Prices *CNY/T) 5 years Source: Trading Economics.
Also all my previous comments remain relevant in regards to my personal position (please read previous Momentum Monday's for more detail.)
When last commented on I said, "The stock is in a downtrend with a bounce the opportunity for an “elegant” exit if required." In the two months it did just that, and now it has returned to that level. From a trading perspective, I wouldn't look at this stock from a trading perspective until it got back above $4.30
Until then, likewise as I said at the end of that comment, as a premium producer and reseller of hard rock Lithium, "If Lithium prices improve then look for PLS to improve."
ASX: SHA - SHAPE Australia
StockRank 99
Momentum Rank 95
QM Rank 99
VM Rank 98
A$1.91
A stock that was close to being a protagonist is the NAPS portfolio, however was excluded because of its size was SHAPE Australia (ASX:SHA).

ASX:SHA 1 year Daily chart
It has only recently listed and is the first time it is being discussed within Momentum Monday. SHA is a fit-out and construction services business, whose recent share price has rebounded inline with many in the sector.
I mention the Capital Raising at $1.96 because anyone who participated is still losing money, irrespective of the recent bounce and that can't be ignored. I suspect this level will prove quite the resistance point.

ASX:SHA Since listing Daily chart
Therefore I look to the registry and I note the stockholders are made up of founders and related entities. So a selldown is a risk. Particularly as 18.5M shares are released from escrow as the half year report is announced on 23rd Feb.
Speaking of which, as mentioned earlier the stock achieved a strong half year with good profit growth despite a small drop in revenue. With all other business metrics pointing in the right direction including the dividend, I can see the favour. The stock is in an uptrend afterall, and while the cost of doing business has increased, so too has their workbook.
Just be wary of the shares coming out of escrow and that resistance level.
ASX: DGL - DGL Group
StockRank 88
Momentum Rank 69
QM Rank 73
VM Rank 91
A$1.00
Likewise a stock not discussed in Momentum Monday until now is DGL (ASX:DGL). I can remember (it’s not that long ago) when Urea was the hot thing. As the shortage in diesel grade additive Adblue was running short. Further the CEO Simon Henry appeared in the AFR for a coverage piece (always a warning signal). But as with all things the bubble burst and price reverted downwards.

ASX:DGL 1 year Daily chart
Therefore with the hype it was not surprising to see the price hit a high well above $4. Fast forward to today and now at $1.00 the question is being asked, “Is now the time to look at it?”
I don’t think you need to be an astrophysicist to understand the stock has been in a down trend. But it has been rebasing and some may be wondering whether the recent bounce is a sign of life. Personally, I don’t mind the chart. The ability to cross back above $1.05 is pleasing. The fact that the 50 day moving average has crossed back above the 200 for the first time since July 2022 is also a good sign with the current price above both levels.. The subsequent pullback gets me excited even more and one could argue that a breakthrough may very well justify a buy.
If I had to be pessimistic, I note the gap created in the middle of June last year. I suppose I should say that I want that gap to fill, then I will hope to see a pullback and then get it.
The difference in price is about 10 - 15 cents which at these levels is 10% (not to be sneezed at)
The ultimate decision will be based on a general view as to how aggressive one should be in the current environment. More cautious, then you wait. More aggressive, then you are in if the price gets above $1.07.
I would set a parachute stop loss at the level from whatever level I get in. Structural support in my view is at $0.81.
ASX: EGL - Environmental Group
StockRank 89
Momentum Rank 86
QM Rank 94
VM Rank 79
A$0.26
As with all more positive markets smaller companies get raised. And in the case of Environmental (ASX:EGL) it is smaller than SHA, has a similar level of free float, can have lumpy days of trade - but it has a longer history.

ASX:EGL 1 year Daily chart
My views on using Technical Analysis on smaller less liquid stocks is well documented, and in such instances I prefer to defer to the fundamentals. But discounting the stock all together would be folly, and on the fundamental front, Stockopedia is showing that there is an improvement. Further after reading the half year report (released on the 21st) and then the presentation (released on the 22nd) the numbers look solid, and the outlook is robust with EBITDA expected to rise by 45% this coming financial year. (Note: the numbers are not yet in Stockopedia. May be due to its size and the busy time if year that it is)
Back to the chart and what I see is a long history and a period of basising in the stock that lasted a decade. They breakout, subsequent pullback and now rebound should have chartists excited.

ASX:EGL Since listing Monthly chart
I know many will point to the $0.28 resistance level. Looking further back if it could cross $0.295 even better. Again the chart is looking good and a parachute stop would have to be put in place as the structural support level of $0.175 may be too far from here.
All that positive commentary aside, my comments on less liquid stocks still stands.
Stocks in the Shine Zone
To learn about the Shine Zone and how to use it, you can read it here.
The rules for inclusion in this list are based on those I like to see in a stock before considering a trade in it:
QM Rank above 80
Price is above the 2.5x ATR
50d MA is above the 200d MA
Price is greater than the 200d MA
Market cap greater than $200M
This is a very important point: the “Shine Zone” are rules for possible buying. They are not for holding and/or selling. If a stock falls out of the shine zone, use support levels to set your stops, or instigate a parachute stop if necessary. With markets moving sideways, one expects frequent changes in these lists.
If you feel there is a stock that should be included but is missing please let us know. This is a manual process and occasionally one gets through the cracks
Also look at the market capitalisation and liquidity before making any decisions!
Data is at 24 February and is sorted by the stock code.
Changes from last week
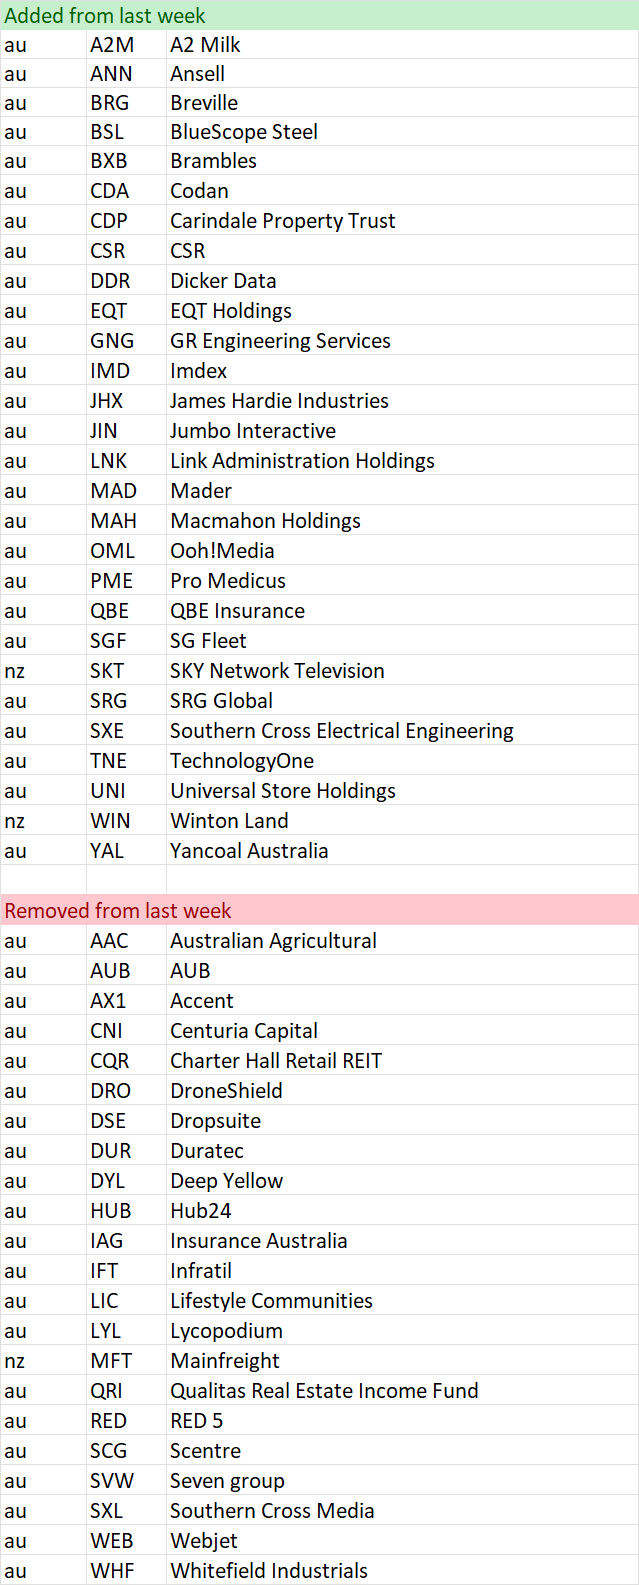
Shine Zone list as at 24 February

“Bus pulling out of the station”
To learn more about this screen read the following article on the objective of the screen
Here is a shortcut in understanding the reasons why a stock is removed:
Volume drop = Bus might be moving, but no one is on it
Price 1 mth < 0% = Bus has been cancelled
Price 3mths >= 3% = Bus has pulled out of the station
Also look at the market capitalisation and liquidity before making any decisions!
Data is at 24 February and is sorted by the stock code.
Changes from last week
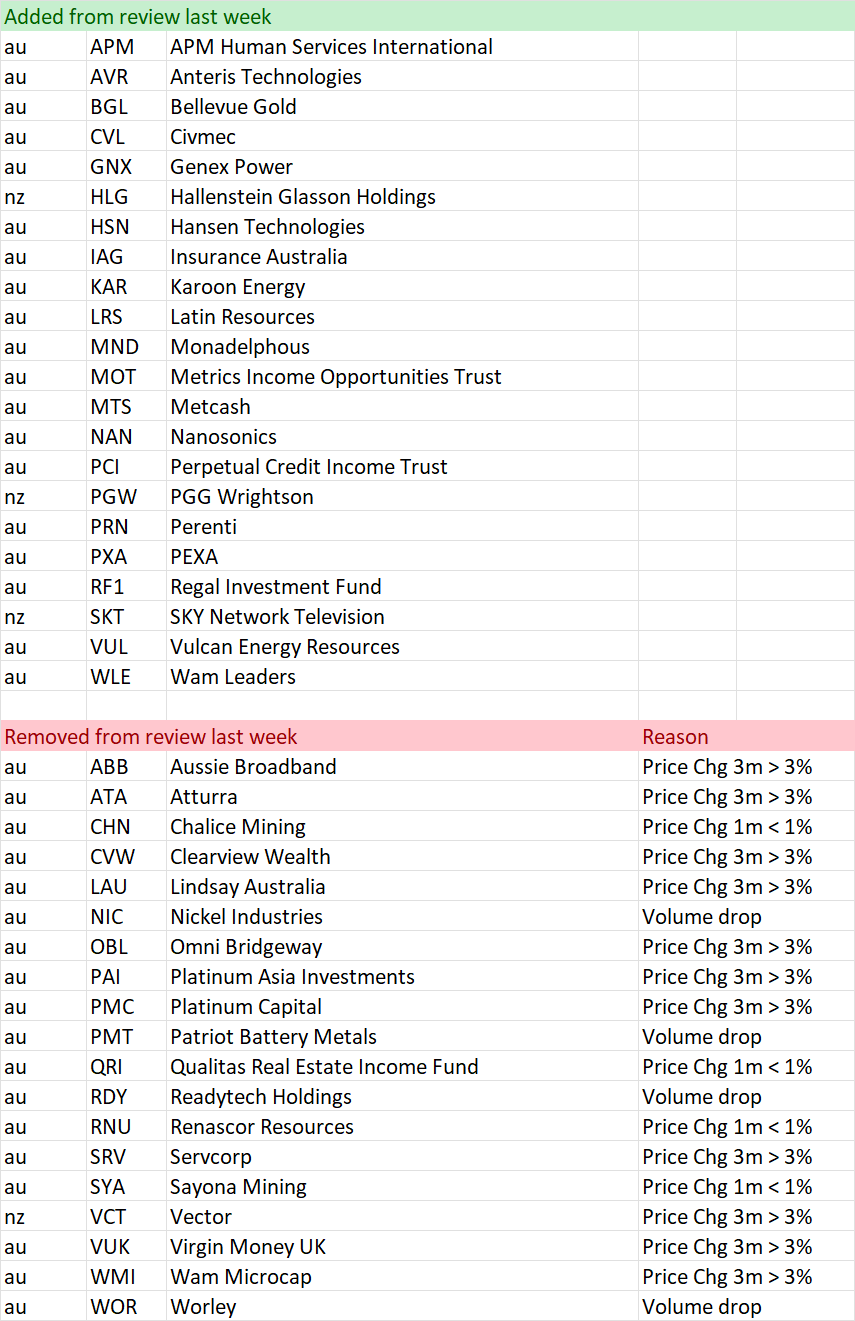
“Pulling out of the station” on 24 February
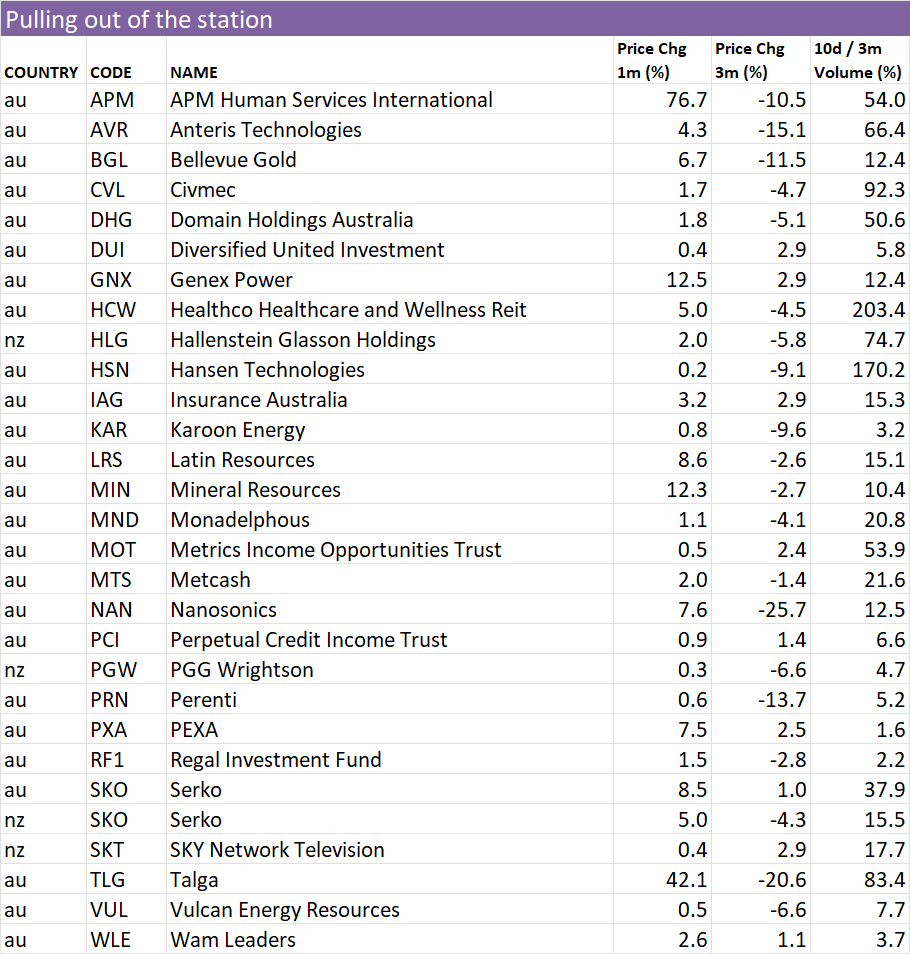
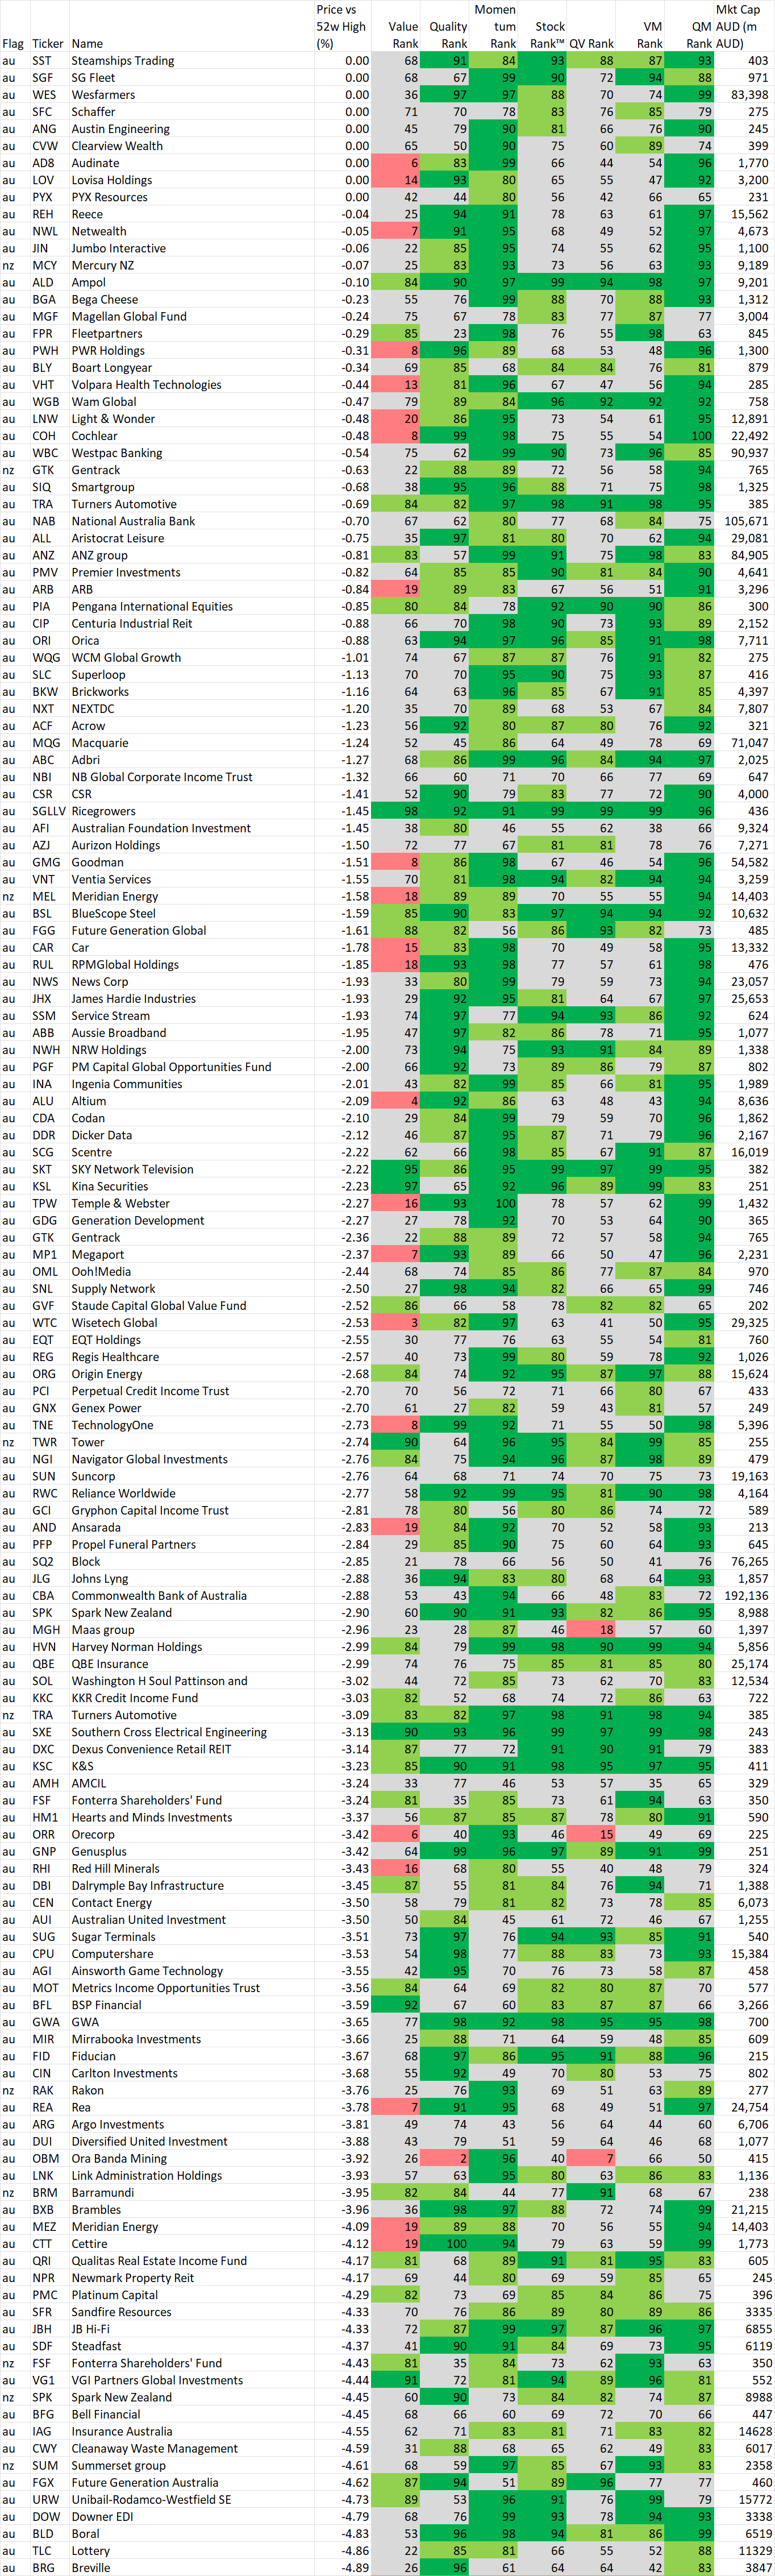
52 week high screen
In this section we identify stocks within 5% of their 52 week intraday high based on the idea, supported by academic studies, that stocks close to their 52 week highs tend to outperform. Weekly changes to the list will also be noted.
If you wish to recreate this screen in the screener select "Price vs 52 high" greater than -5% and Mkt Cap greater than $200M
A stock coming onto the list is NOT an automatic buy, just as a stock that leaves the list is NOT an automatic sell. As with the shine list, assess every chart on its merits. However movements on this list may alert you to interesting charts so be sure to look at Stockopedia and the chart first.
Data is at 24 February and is sorted by the stocks closest to their 52 week intraday high.
Also look at the market capitalisation and liquidity before making any decisions!
And remember, past performance is no guarantee of future performance.
Changes from last week
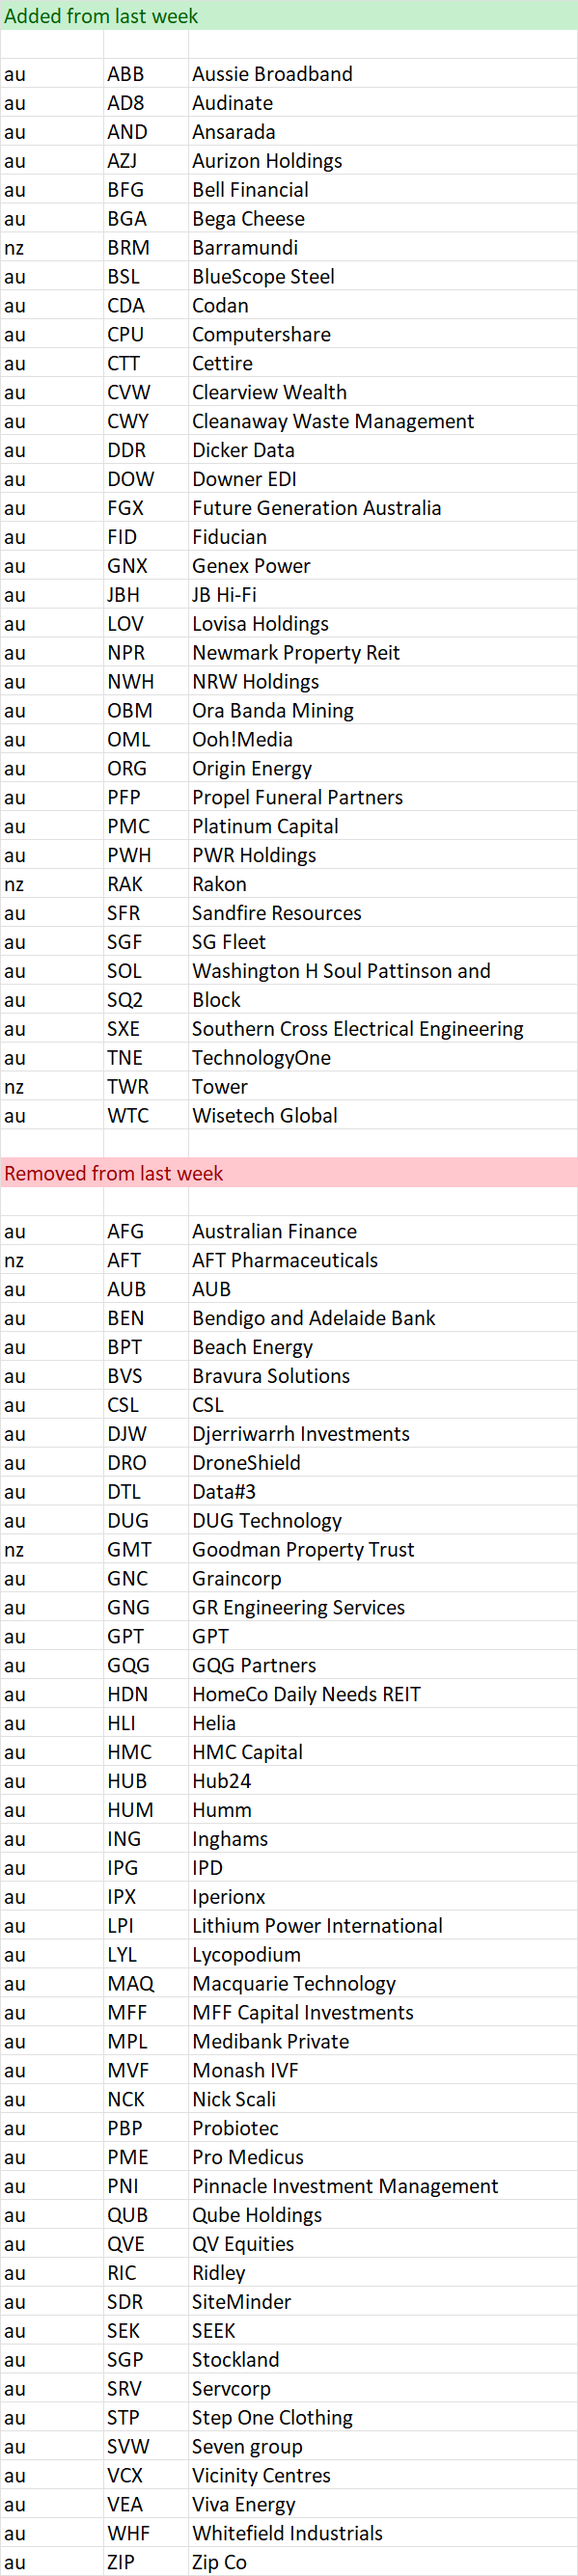
Stocks within 5% of their 52 week high as at 24 February
Important Information: Stockopedia Ltd ABN 39 757 874 670 UK business registration number 0637267 (“Stockopedia”) is an Authorised Representative of Daylight Financial Group Pty Ltd ABN 77 633 984 773 (“DFGPL”) which is the holder of an Australian Financial Services Licence (AFS Licence No. 521404).
Information in this commentary is current as at date prepared unless otherwise stated. However, please bear in mind that investments can go up or down in value, and that past performance is not a reliable indicator of future performance. For more Important Information please refer to the Disclaimer section of this website.
This communication may contain general financial product advice. It has been prepared without taking into account your personal circumstances, and you should therefore consider its appropriateness in light of your objectives, financial circumstances and needs before acting on it.
If our advice relates to the acquisition or possible acquisition of a particular financial product, you should obtain a copy of and consider the Product Disclosure Statement (PDS) before making any decision.
The author holds interests in PLS and other companies listed in the data tables . This position can and will change at any time without notice.
Disclaimer
This is not financial advice. Our content is intended to be used and must be used for information and education purposes only. Please read our disclaimer and terms and conditions to understand our obligations.
7 comments
Highcom (ASX:HCL) was not expected to show good results but today’s announcement is on an entirely different level - utterly catastrophic. The market cap is now a fraction of sales and I am surprised that the auditors have not raised an eyebrow about solvency. With A$700k of receivables and A$4 million of payables even a year of inventory (after write downs) is not even the top worry. Does this company have any chance of making it through the year?
I'm not sure but what a mess. It's surprising their opening an office in Europe hasn't yielded any results given the current geopolitical situation. Maybe their products just aren't very good.
Data#3 (ASX:DTL) seemed to get hosed following its interim statement. Although it did have a small miss against estimates, the reaction to a company still showing good growth in sales and profit seemed to be rather extreme. Is this just market volatility providing a buy opportunity,or am I missing some more fundamental issues? Your insight would be appreciated.
Got to admit. This was perplexing. Especially as I thought I was silly selling early... and now the price is back to what I sold it at. I only covered DTL one month ago.... so I won't do a full blown comment.... (unless asked after two months of course) but I agree.... this seems over done. I have checked everywhere and there seems no sinister reason for the sell off. So if the sell off stops (everything seems to have settled down) I will look at getting back in. I am a fan of DTL and what it is trying to. Especially when I compare its result to others this reporting season. It could be the gift I don't deserve? (but will take if offered.) My Jan 22 MM was when I last covered it (sorry.... on my phone). Regards, Elio.
Thanks for your comments, I had followed your review in January and I am pleased that there are no “sinister reasons” for the drop. I will examine my courage for going into a bit more DTL. My house rule says “don’t catch falling knives”….but the last few sessions hint that this may be one of those rare bouncing knives!
Duratec (ASX:DUR) had a similar market reaction to what I thought was a good report. The only negative was a slight drop off on the order book. Hard to understand the sell off, given the company is growing and isn't expensive. Time will tell if it's an opportunity or if Mr Market knows something I don't.
Thanks Elio, great comments as always. I hadn't noticed those shares coming out of escrow, so thanks for pointing it out.