Momentum Monday 27th February 2023

Back for another round of Momentum Monday, proudly brought to you by the reporting season, your home for heartbreak and irrational trading.
Stay tuned for our next webinar for Members which will be a wrap of the reporting season. Where we will talk about the stocks that shone and those that deteriorated. By this I mean based on company factors, not just price. After all, that is what the Momentum Monday report is for .
We hope you are valuing this, plus all the other services we provide at Stockopedia. If you have a suggestion on how we can improve the service please tell us. Otherwise if you have nothing bad to say, please tell others as we would welcome the opportunity to showcase the power of Stockopedia to everyone.
The agenda for today’s report:
Broader market sentiment
Stocks of Interest
52 week high screen
Broader marker sentiment.
S&P500
The S&P 500 was down 2.7%, marking its worst week since Dec. 9 and third down week in a row.

Most of that performance captured on Friday when the core personal consumption expenditures price index, (apparently the Fed’s preferred measurement of inflation), rose 0.6% in January and 4.7% from the prior year, higher than economists’ expectations.
While I struggle to see what unique insight this latest number delivers beyond what we already knew, it stands to reason that the Fed may have to keep rates higher for longer to quell inflationary pressures.
However on the weekly chart, we see the impact is still not great enough to get us back into the downward channel (thankfully) and if we can reverse (or best case scenario) and stay above 3837 before continuing our climb from here, that will be a positive.
I would still prefer the price stay out of the 2022 downward channel which means the index must stay above 3818. The last chance saloon will be at 3582. A breach below that level and it is difficult to suggest that we will avoid more downward pressure.
The larger fall in the S&P500 comes after two stoic weeks where in the face of broader macro concerns, the market held its own.
Unfortunately though it has now just tipped the weekly RSI below 50 (meaning the market is down), the the MACD continues to hold the line maintaining a positive (though diminishing) gap between the 9 day and 15 day averages
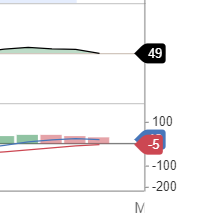
For those with a more half glass full perspective, they will also take heart from the S&P500 daily performances of the past week. With the exception of Tuesday, each of those days started with a heavy sell off in the market early but then buying support can in the later half of the day. Such activity shows a commitment from buyers to stem the flow of selling seizing on some bargain hunting.
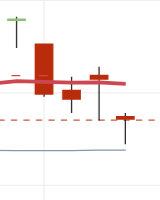
S&P500 five trading days
In other news, I also read with interest during the week that the American Association of Individual Investors (akin to our Australian Shareholders Association) release regular surveys on investor sentiment. The latest survey run shows bullish sentiment among individual investors that prices will rise over the next six months plunged to 21.6% in the latest week, down from 34.1% last week. This means bullishness is below an historical average of 37.5% for the 64th week out of the past 66.
While not intended (I assume) to be a predictive measure, I believe it more indicates a cautiousness creeping in to sentiment from retail investors, that cautiousness has been prevalent for over a year now.
And on a final note, we have also got the opportunity to read the annual Berkshire Hathaway letter to investors where Warren Buffett (92) shares some the unique insights of himself and his counterpart Charlie Munger (99). While not something normally attributable to Momentum investing, its still always a good read for those interested in US Market moves and I have included a copy for you reading pleasure. Read the letter here.
S&P/ASX200
It was our busiest week of the reporting season last week. The good news is the vast majority of good companies have now reported. What tends to be left at this stage in most cases, with the exception of a few, are the rats and mice trying to hide in the anonymity of the crush which is the last week of reporting season.
But to be honest, more is gleaned from their quarterly cash statement than there is looking at half year / full year coroner's report.
We won’t complete a review on the collective of stocks until next week as the logjam of companies can lead to some delays in getting the data into the system.
But there is no logjam when it comes to prices they move immediately and for the record, last week was the third consecutive down week for the market.

S&P/ASX200 Weekly chart
Notwithstanding the disappointment of the sell of since January, we know the market is simply doing its thing, and if it is any comfort to anyone the pullback to date has still been relatively mild. The next short term level of support is 7038, which would be a fantastic level to stay above, not just because it will mean that we have a new higher low, but it also shows the three negative weeks have not had too big an impact on sentiment.
Remember this chart from last week’s edition?

XJO - Weekly chart (Taken from on week ago - Momentum Monday 20 Feb)
We mentioned that in recent times as we continue to butt our heads against all time highs, the pull back tends to be prolonged. Sure enough this down week continues that trend, however pleasingly the lack of veracity around the downside can provide some confidence… for now.
And you certainly know we are on the eve of another footy season soon as the market has become a game of political football. Be it the Qantas' result, wage growth being lower than expected, even the old superannuation chestnut was raised again all items designed to distract us from the main gain.
In the spirit of of blocking out the noise I will recite the words of 20th Century poet, sportsman, philanthropist and all American hero Forrest Gump when he said, "that's all I've got to say about that!"
So back to markets and we are also witnessing something quite rare. Despite three consecutive down weeks the RSI is above still which means the move of the market is still up. And the MACD is even above the positive line (though obviously coming together given the recent fall.
As far as pullbacks go, this is a dream one. Doesn't means the market can't tip over, however for now I am still buying stocks.
Even Friday's price action which on the surface may of appeared futile given the negative week. However the push that day actually moved the price back up over the 50 day EMA (by one point), again a relief and a good sign if it can hold next week.
Probably not a particularly strong support point given the lead from US Markets on Friday, but it shows all things being equal there is support for the market at these prices.
With reporting season the other thing one tends to notice is the price gaps (both to the up and downside) occurring within our stocks. This is normal this time of year as we previously explained the reporting season is a good point for price to re-calibrate itself as the latest set of financials are displayed to the world. Sometimes that recalibration takes time, but in some (including a number of stocks that we will cover) it can be rapid.
Stocks of interest
Tip: if you look at the list on the right hand side you will see the stocks mentioned within this week's contribution.
Author note: In line with the approach I am using with Stockopedia, I will focus the majority of my attention to stocks with a QM rating above 80 and market cap above $500M. For those who may be new to this report please read the last instalment of my momentum journey here. I will discuss where their charts presently sit to provide context for potential and current investors. You can revisit the series of articles starting with Episode One here.
These stocks are considered purely for the purposes of education. Be sure to read all relevant commentary to understand the context from which a chart is presented. It’s not always positive!
ASX:BHP BHP. QM Rank 93 A$45.94
BHP (ASX:BHP) has experienced a false break in recent times with excess selling in my view on account of the disappointment it was unable to sustain recent gains.

ASX:BHP 1 year daily chart
We last covered BHP in early January and then we mentioned the resistance that the price was coming against and that a break would be positive.
And sure enough it was for a while, the price even retraced to the resistance line which had now become support. However when the company released a bigger than expected drop in revenue and a dividend cut, it was unable to stay elevated and the price has come off somewhat aggressively. It has broken below the ATR following two strong sell days. It will likely find support for it soon.
It is not for me to suggest that someone trade BHP as it is a core in most portfolios and quite frankly, if it fails to stop the decline, the market will likely follow given its size. I am confident most in BHP are long term investors who have a longer term view than just half yearly numbers.
However if there are traders out there holding BHP for a trade, the stop would be $45.25
ASX:QBE QBE Insurance. QM Rank 91 Price A$15.30
We last spoke about QBE Insurance (ASX:QBE) in the second ever Momentum Monday article.

ASX:QBE 1 year daily chart
Since then, we saw it break out of the $13.00 range, which meant it was blue skies ahead and the price has now powered onto higher highs. Although interesting to see that on this latest run, the $13.00 level acted as support twice after we broke above that level.
The last report confirmed what we all know about insurance companies. That catastrophic events can mean they can charge more next year and QBE was quite positive in its outlook statement. Gross written premium growth is headed in the right direction, as was the combined operating ratio that continues to fall (the lower the number the more profitable the underwriting business is as they take more than they pay.)
The price popped on the day of the announcement and it has had 6 consecutive positive days. The price will eventually have to take a breath. As I was a late comer to the QBE party I am acutely aware that there is a risk the price may pullback and fill the gap back to $13.38.
As a result I am setting a stop loss at $14 32 to lock in gains .
For those looking to enter the stock, be patient. Eventually the price will have to take a breather potentially offering a better entry point at the $14 32 or lower level.
It's important to note that this will change if the price keeps powering on. It's just, that I am reluctant to buy after a parabolic move up like this.
ASX:DMP Domino's Pizza Enterprises. QM Rank 52 A$53,29
Just to prove not all stocks work to plan, especially around reporting season. I personally have held DMP since it pulled out of its rebase in November 22. I even wrote about the stock in the first Momentum Monday article.
However on the back of the company's latest half year result the price plummeted, broke below the ATR and even fell below the 200 day moving average. I recently sold at a loss, all my gains eroded in one day.
Prior to that the price had been stepping up nicely to a peak of around $76 before it cratered on Wednesday (22/02)

ASX:DMP 1 year daily chart
If likewise you were caught with DMP there is no point looking back. We have a capital allocation to make today - ie where is the best place to put my money. So what to do now?
Either sell now and move on. Tough, but like the pizza, you have to stomach it.
Or there are many that subscribe to the theory that price gaps are filled, which would mean the gap created from the fall from $70 to $60 will eventually be filled. You may choose to wait for the that to happen to allow for a more elegant exit, as to whether the price will get back above $70 will be a combination of a range of fundamental factors which unfortunately the company by its own admission suggests it is some time away from solving.
If you choose to wait for the gap to be filled, know that your stop loss (an oxymoron I know given the fall to date) a cross below $51.33 is when you will know you are “definitely” wrong
For those who have missed the kerfuffle and are thinking that will take a bite of DMP, consider buying closer to support of $51.33, as that too will be your stop loss. If it breaks below $51.33, we will be at 52 week lows and that generally is not a good sign. If it were we would have a table in this report showing stocks within 5% of their 52 week lows instead.
ASX:NHF NIB Holdings QM Rank 89 A$7.44
One of the more intriguing charts to watch at the minute is NIB Holdings (ASX:NHF) so intriguing I may just use it as a personal learning study rather than get actively involved with the stock.

ASX:NHF 1 year daily chart
Obviously the comments that the uncertainties around COVID were treated harshly by the market who would have preferred more formal guidance. I say this because the fundamental result was not that bad.
In the past 12 months the company has experienced two gap events. First in October 2022, and then again last week. The first time the gap was eventually filled to the point that the price was close to all time highs, until it failed miserably recently.
Since that day though (unlike DMP) you will see that the price has started to recover as the underlying strength of the result has started to be acknowledged. Why am I particularly intrigued by this setup? Because unlike DMP which has had its gap even close to 52 week lows, this latest one for NHF has occurred when the price was close to its 52 week high. Will that lead to a different outcome, I’m not sure. But it the commentary from the company was anything to go by it sounded more positive.
If you are feeling confident that the gap will indeed be filled, a close back above $7.50 will see the price above the ATR (it crossed it intraday, but was then sold off throughout the day to close back below that level.
If it fills the cap, one would be relatively confident that a retest of all time highs will occur. A stop loss would be in place at $7.02, or else $6 comes into play.
ASX:RHC Ramsay Health Care QM Rank 87 A$67.90
Another intriguing chart in a similar sector belongs to Ramsay Health Care (ASX:RHC) who has seen a bit of mess in the past 12 months

ASX:RHC 1 year daily chart
The Price spiked in May 2022 following an offer from a consortium lead by private equity firm KKR. That offer subsequently dragged on with a revised lower offer made until eventually it was discharged from consideration in September 2022.
If you exclude that whole period, it was as if the price hadn’t changed much and so we look at it through today’s lens which pleasingly appears to be increasing in positivity.
Following the development of a new short term higher high, the subsequent retracement held the $63.92 line and formed the base from which this latest tilt at $68.00 is being made, Should the price break above that level then we have a new higher high, and in the short term at least there may be some more momentum behind it.
This will have to counter the recent downgrade cycle from analysts, however the company sees more surgeries being undertaken as the industry recovers from the COVID calamity of the last few years.
ASX:BSL Bluescope Steel. QM Rank 95 A$18.46
We last discussed BlueScope Steel (ASX:BSL) in the Jan 16 Momentum Monday report. We said at the time that:
“But after a series of short term higher highs and higher lows, BSL has a look as if it is a stock on the move. If you were able to pick some up at around the $17 level, a stop of $14 80 would be appropriate.”

ASX:BSL 1 year daily chart
Unfortunately, the price didn’t get back to the $17 range. That was until the release of their results where the price gapped down and intra day hit the $17.50 which was previous resistance but had now turned into support.
While gap downs are generally not great (especially for holders) looking at BSL from a longer term perspective and we can see that despite the pullback, for now the broader recovery remains in place that we flagged a month ago.

ASX:BSL 5 year weekly chart
Since the gap the price has rebounded, with traders caught on the down swing hoping that the gap will again be filled. That would take the price again to short term recent higher highs and therefore continue the tren of the recovery out of the two year bear cycle the price has been in.
ASX:ALU Altium. QM Rank 99 A$37.90
Another stock that gapped down on its result was Altium (ASX:ALU). We last covered in our first Momentum Monday contribution.
At the time we mentioned that a break above $37, had investors hoping for a retest of $45. However as is often the case with price in time commentary, we saw a mild pullback which pleasingly created a new short term higher low, and the price regained its strength for another run to $41 this time until the recent pullback.

ASX:ALU 1 year daily chart
If the current range can hold, then pleasingly we see a new higher low which again improves the stocks chance of reter=sting $45. The stop loss level remains around $33.50 as it did back then
ASX:WTC Wisetech Global. QM Rank 99 A$63.12
At the time of the ALU comment, I also mentioned that the stock runs a second to Wisetech Global (ASX:WTC) as the premier IT business on the market. (TNE also gives both a run for their money). And we last covered WTC when it was stock in a sideways channel back towards then of last year. (I have left the lines on the chart to illustrate the point.)
I cautioned that a break below $51 may see some downside targets in play. And it did break below that level.
However, testament to the Quality elements of the business, it didn’t fall much further than $49 and in fact hit all time highs at the start of Feb.

ASX:WTC 1 year daily chart
The pullback since that all time high has created a new higher low, and the chart looks bullish set for another run. A break above $63.53 will take us to 52 week and all time highs again, with the recent pullback providing some confidence that the run could continue.
Though be prepared to bring your oxygen tank given the value metrics - however that is a discussion for another forum beyond Momentum discussions.
ASX:GUD GUD Holdings. QM Rank 85 A$10.13
Chris recently wrote about GUD Holdings (ASX:GUD) which you can read here.
From a chart perspective the price action of the last few weeks has closed the gap which was formed in June last year.

ASX:GUD 1 year daily chart
The price will eventually have a (we hope mild) retrace as this has been quite an aggressive move. Those looking for a possible entry point may be hoping for a retrace to below $9.50 for a more elegant entry with a first target of $11.95 all playing out well.
An entry here would require a parachute or close call stop as the structural level of $8.20 may be too deep to cop.
(For more information on how I set my stop losses including the concepts of a parachute or close call stop. Read here)
ASX:WOW Woolworths. QM Rank 87 A$37.03
Fundamentally there was a lot to unpack with Woolworths (ASX:WOW)’s result. Slight reduction in cash, increases in revenues and normalised profit, increased cap ex, an increased dividend and the lingering question of “what are they going to do with all those plastic bags.”

ASX:WOW 1 year daily chart
But ultimately, “people gotta eat” and we have seen support in WOW price since the lows of November 2022 as investors start to appreciate the position WOW has in helping to create an inflation proof portfolio.
The next key levels to watch include $39.50 which was a resistance level tested twice in April and August 2022. If it is able to break through that level, then $40.62 will close the gap of December 2021, then beyond that is all time highs at $42.66

ASX:WOW 2 year daily chart
Notwithstanding the positive short term move, a pullback is to be expected at some stage. Provided it stays above $33.10, the the price remains orderly.
ASX:BXB Brambles. QM Rank 99 A$12.97
I am going to start by saying that I have always found the chart of Brambles (ASX:BXB) to be a little messy so I have steered clear of it my entire investing career.
But the the recent spike in price and comments from the company to the effect that they are so big and command so much market power they can easily pass on inflation costs to customers (I suppose Qantas will want to know why BXB weren’t dragged through the media mud for making a statement like that… after all, Pallets are far more important to the everyday consumer than planes are… sorry I digress.

ASX:BXB 1 year daily chart
I am going to still avoid BXB (for now) despite the fact it is close to 52 week highs, as I still need evidence that this latest move is sustainable. After all, in the past 12 months as highlighted on the chart above, the price has gapped up four times and the price has been filled.
If we extend the graph out to say a 10 year period, you will also notice that since the all-time high in 2016 of $13.16 the price really hasn’t done much.

ASX:BXB 10 year monthly chart
Pleasingly if it can break above all time highs, consolidate, and then return on a positive trajectory I may consider it. It is on the watchlist for the moment and is one to watch here on in.
ASX:SEK Seek. QM Rank 86 A$24.47
It remains a mystery to many how SEEK (ASX:SEK) are not at all time highs in the current environment.
You can’t even find terrible staff for love nor money, with many job ads almost gaining heritage listing because they have been posted online for so long.
Yet here we are.

ASX:SEK 1 year daily chart
They are trying their best to find a floor. Pleasingly the 50 day moving average has crossed above the 200 day average and is a rising, a combination not seen since December 2021.
A new short term higher high has been created. I would like to see the price hold these levels and then break above $25.70 before committing. I would remove it from consideration if the price broke below $20.30, which coincidentally would be the last chance saloon, even though trades would have a stop at $22.80
52 Week High screen
Academic Research has shown that stocks close to their 52 week highs tend to outperform.
To that end I have attached the results of a screen run within Stockopedia showing every stock above 200 million market that is trading at least 5% from its 52 week high. (If you wish to recreate this criteria in the scanner select "Price vs 52 high" greater than -5%)
This has not considered liquidity of the stock nor does it consider its fundamental qualities. However we have included each factor score to help you.
Data is at 24 February and is sorted by the stocks closest to their 52 week high.

Important Information: Stockopedia Ltd ABN 39 757 874 670 UK business registration number 0637267 (“Stockopedia”) is an Authorised Representative of Daylight Financial Group Pty Ltd ABN 77 633 984 773 (“DFGPL”) which is the holder of an Australian Financial Services Licence (AFS Licence No. 521404).
Information in this commentary is current as at date prepared unless otherwise stated. However, please bear in mind that investments can go up or down in value, and that past performance is not a reliable indicator of future performance. For more Important Information please refer to the Disclaimer section of this website.
This communication may contain general financial product advice. It has been prepared without taking into account your personal circumstances, and you should therefore consider its appropriateness in light of your objectives, financial circumstances and needs before acting on it.
If our advice relates to the acquisition or possible acquisition of a particular financial product, you should obtain a copy of and consider the Product Disclosure Statement (PDS) before making any decision.
The author holds interests in the following stocks mentioned in this article: QBE, DMP, ALU . This position can and will change at any time without notice.
Disclaimer
This is not financial advice. Our content is intended to be used and must be used for information and education purposes only. Please read our disclaimer and terms and conditions to understand our obligations.
No comments yet
No one has commented here yet! Why not be the first one?