Momentum Monday 29 July 2024

Welcome to Momentum Monday.
It was another good weekend for our business at Stockopedia as we grow the profile of it within the Australian investing public. (And it has nothing to do with the Olympics).
Although I still fail to see how we are not a staple in any serious DIY Investor’s toolkit, and lament that obviously either A) investors don’t like money, or B) they are happy to consistently lose in their investing as long as they don’t pay for a membership.
Particularly when you consider they invest their Family’s future prosperity in the market and yet baulk at an absolute minimal fee that is potentially tax deductible if you have a good tax accountant - I just have to laugh.I can;t fight City Hall. All I can do is talk to the enlightened ones who I hope have identified the right strategy for them (ie You) because by saving you time and supporting your strategy, we feel this is the best way we can serve you moving forward. After all, the big family investment offices didn't become big by one individual doing their own research.
Interesting links
This week on Weekend Watchlist run in conjunction with Shares for Beginners, we cover a business that we often need to correct members as to the perception of what the growth engine is. It is CDA Codan. Listen here to the replay
We ran the latest Mastermind series episode with Alan Hull Watch the replay here.
This quarter we were once again ranked as the Gold Standard by the Investing Newsletter Group. Go to https://www.tinglive.com.au/ to learn more. Congratulations Team!!!

Given that we are consistently up there, what better time than now to “Empower Others” with our referral program that has been updated and it offers the biggest discount we have available anywhere (Even better than the EOFY offer). To Learn read more here
For any external commentary we make to the broader market, follow us on Social Media Facebook Linkedin Instagram or X (formerly Twitter)
This week’s content is as follows:
Broader market sentiment
Member corner
Stocks in the “Shine Zone” (including changes)
Momentum Movers *New section*
52 week high screen (including changes)
A reminder that you don’t have to read all this contribution. Simply scroll to the area of interest.
Broader Market Sentiment
We look at the direction of both the US and ASX markets to gain an understanding of the broader sentiment at the minute. It is important to stress here that I DO NOT use this to time my entry or exit out of stocks. I prefer to use the individual charts of stocks to do that. However I find it useful in helping us determine how aggressive/cautious traders should be in their trading. In short the more positive the broader market is the more risks you can take and vice versa.
US / S&P500
It was a very volatile week on the US last week. The strong performance in the S&P 500 on Friday did much to reduce the impact, but the records will show the broader index fell for another week by 0.8%. It's the first consecutive down week for the index since April.

S&P500 Weekly chart
There was a lot of noise this week that was always going to make it hard for it to be a positive one. From the cyber events of last week, to the establishment of a credible rival in their US Presidential campaign through to the arrival and photo opp of a divisive character in Netanyahu in Congress.
Macro wise though (Thursday their time) we saw data which showed the US economy was growing strongly. This added further weight to a rate coming soon as slowing inflation (as measured by the personal consumption expenditures index) plus good growth is the exact scenario the Federal Reserve is looking for when assessing ”economic resilience.”
The much discussed rotation out of the tech stories and into the more cyclical and stoic type business has been spoken about at length recently. Though I feel it is no better emphasised than by the daily performance of safety and office equipment maker 3M Co (who is a constituent on the Dow Index as well) who jumped 23% on the day. Its best daily move since 1972 (that is over 50 years ago!). Despite the impact on the tech inflated index I mentioned last week, that I don’t see the return to favour of more boring stocks as a bad thing. That said many of the technames did rally on Friday will the recent sell off an opportunity for some.
To further emphasise the above point it has been a good week for the Dow and the Russel 2000 Index. A look at a US based ETFs on the latter shows what good performance it has been the last three weeks.

iShares Russell 2000 ETF (US Based) Weekly chart - 6 months.
But just a reminder that not all boats float when the tide comes in, and sometimes the trend can change on fundamental news, Ford Motor company had its worst week since 2020. In fact when the automaker posted weaker-than-expected earnings after the bell on Wednesday (their time) the price move the next day was the single biggest drop in the stock since 2008.

NYQ:F 1 year Daily chart
Back to the broader S&P500 index and ther chart still looks positive with the weekly RSI above 50 (sign of a positive moving market) and MACD well above the break even line, though notice the convergence of the two moving averages which could mean something over time. We will see.
I also read that according to FactSet, more than 40% of S&P500 have posted their quarterly financial results. Of those, more than 78% have beaten analysts’ consensus forecasts. But with some big names yet to report we could still some action here. For example next week is a big week with the likes of Microsoft, Meta, Amazon, Apple and McDonald’s due to post results. Then of course we get NVIDIA later next month. Of that list, the first three have seen 3 consecutive down weeks in terms of price so it will be interesting to see what happens there.
All in all however, I continue to remain of the opinion that this is just the market behaving normally. I also remain happy that it would appear the cyclical businesses are coming to the party and remain of the view that I will be aggressive for as long as the S&P500 index remains above 4967.
AUS S&P/ASX200
Despite the positive close on our market on Friday, it was not enough to erode the losses of the week. And much of that was felt on Thursday. So all in all not a bad effort for the index with the S&P/ASX200 falling 0.6% for the week.

S&P/ASX200 Weekly chart
We started the week coming out of the end of the world with the botched CrowdStrike release. But nothing a US$10 Uber Eats voucher couldn’t fix (PS I am serious. Google it) But by the end of the week we were playing a bit of catchup. Particularly in the materials space as according to some, there were some bargains to be had. I even note press reports that Macquarie is considering participating in Metallurgical Coal deals moving forward. It seems many hope the sector’s return.
As our market has nowhere near the same size of an IT sector as the US we were insulated somewhat from their recent melee. However there wasn’t much love for commodities either as prices there continued to struggle. For example, Iron Ore fell below US$100 per tonne. Copper saw strong pullbacks. So when combined with the green energy disasters of the past year it was always going to be tough to stand out.
But it isn’t just the price takers who are struggling. We have seen a number of quarterly updates from companies highlighting the increased cost of doing business. While this is obviously not good for similar companies in similar industries, it also adds weight to the next rate movement in Australia if anywhere is up. Not that the USD/AUD shows any signs of that, falling through the weak as the US dollar strengthened on the back of better than expected growth figures and a credible competition for the Presidency.
The incredibly positive moves in the US on Friday are likely to get our market started on the right foot again when we open on Monday. Hopefully that momentum can continue for the whole week and keep the Materials Bears at bay.
All that aside, the lists below are heaving in terms of being full and therefore there are always opportunities to invest. This is particularly beneficial if you are like me and believe that the market goes up more than it goes down. But I hasten to caution my constant reminder, “Never mistake a Bull market for Brains.”
Nonetheless, anyone using weakness as a buying signal has reaped the benefits of a pretty solid bounce. That is one of the hallmarks of a bull market. And for as long as the index stays above 7547 in the short term , I continue to share the same view.
Member corner
In this section we will provide a detailed chart assessment, on a maximum of ten stocks weekly, on companies from those of you in the Gallery.
We welcome stock requests to be analysed from members. We will also be looking at the charts of some of the more actively researched stocks for the week. We will try to rotate through a selection so as to not make the charts stale, however we will likely not cover a stock within 2 months of when it was last discussed.
If you want to see what has been written about a stock recently, go to the discussion area.

We will not be making up suggestions. If there are no changes to the most viewed list and/or there are no suggestions from members, then no stocks will be covered.
To learn of the methods used to analyse companies in this section, refer to my Momentum Journey series that I articulate here in three parts.
They will help provide context on what I am writing about and the editorial angle of this report.
Also look at the market capitalisation and liquidity before making any decisions!
And again, if you have a stock you would like analysed from a momentum perspective, please write it into the comments section below or email us at @stockopedia.com.au">support@stockopedia.com.au
IF NO ONE ASKS… HOW AM I SUPPOSED TO KNOW?!?
ASX:FMG - Fortescue Limited
StockRank 99
Momentum Rank 76
QM Rank 93
VM Rank 95
A$20.35
The last time I spoke of Fortescue (ASX:FMG) from a Momentum perspective was two months ago and I was vague. You can read that commentary here. At the time I wanted one of two things to happen in order to provide further guidance.

ASX:FMG 1 year Daily chart
Unfortunately for holders it did the first point. Ie It created a new lower high, and has subsequently created a new lower low. That China ‘hope’ trade I last spoke of has run out of a bit of puff and Iron Ore has fallen back below US$100 per tonne.
Further adding to the negative sentiment was news that there was rising cost pressures in the Iron Ore business as identified in their latest quarterly, coupled with 700 job cuts announced the week earlier calling into question further the Green Hydrogen business.
In my view this remains a clear avoid until the chart looks better. (PS At the moment it doesn’t look great.)That said, the price is coming up to resistance that it has tested twice this year. So a trader with an aggressive may consider a nibble here as they, “won’t have to wait long to know if they are wrong.”

ASX:FMG 2 year Daily chart
Not me though. For this price taker, I want to see a crossover in the 50 day MA and 200 day MA as a bare minimum.
ASX:YAL - Yancoal Limited
StockRank 99
Momentum Rank 98
QM Rank 97
VM Rank 100
A$6.81
It's been a while since we have discussed Yancoal Australia (ASX:YAL) from a Momentum perspective and it is not unusual to see it and many peers in the space also receive the same scrutiny given their strong cash flow generating capabilities. For the record, members can read the old commentary here.

ASX:YAL 1 year Daily chart
Short term it has had a good run. I wanted to wait for it to pullback, and though it ran a little higher initially, it eventually did just that. The run up as shown by a series of higher highs and higher lows adds further weight to the strength of the run.
Though keen watchers will notice the price hasn’t performed as a WHC, NHC or CRN has done (which is worse over the past year) . I feel this is a symptom of the 62.3% holding held by Yankuang Energy Group. The other pleasing thing is that it broke through those 2022 quite powerfully and if it holds the higher low of $5.24, then it can be in an uptrend. It hit my $6.95 target as well. So just looking at the lines, one has to be positive.
I have voiced my thoughts on major shareholders on a registry before. However in the case of YAL at the moment it has been a saving grace. But I still feel it will be beholden by the underlying commodity price and the fact it could be taken over eventually. Hopefully at a fairer price than what shareholders were initially offered.
Stocks in the Shine Zone
To learn about the Shine Zone and how to use it, you can read it here.
The rules for inclusion in this list are based on those I like to see in a stock before considering a trade in it:
QM Rank above 80
Price is above the 2.5x ATR
50d MA is above the 200d MA
Price is greater than the 200d MA
Market cap greater than $200M
This is a very important point: the “Shine Zone” are rules for possible buying. They are not for holding and/or selling. If a stock falls out of the shine zone, use support levels to set your stops, or instigate a parachute stop if necessary. With markets moving sideways, one expects frequent changes in these lists.
If you feel there is a stock that should be included but is missing please let us know. This is a manual process and occasionally one gets through the cracks
Also look at the market capitalisation and liquidity before making any decisions!
Data is at 27 July and is sorted by the stock code.
Changes from last week
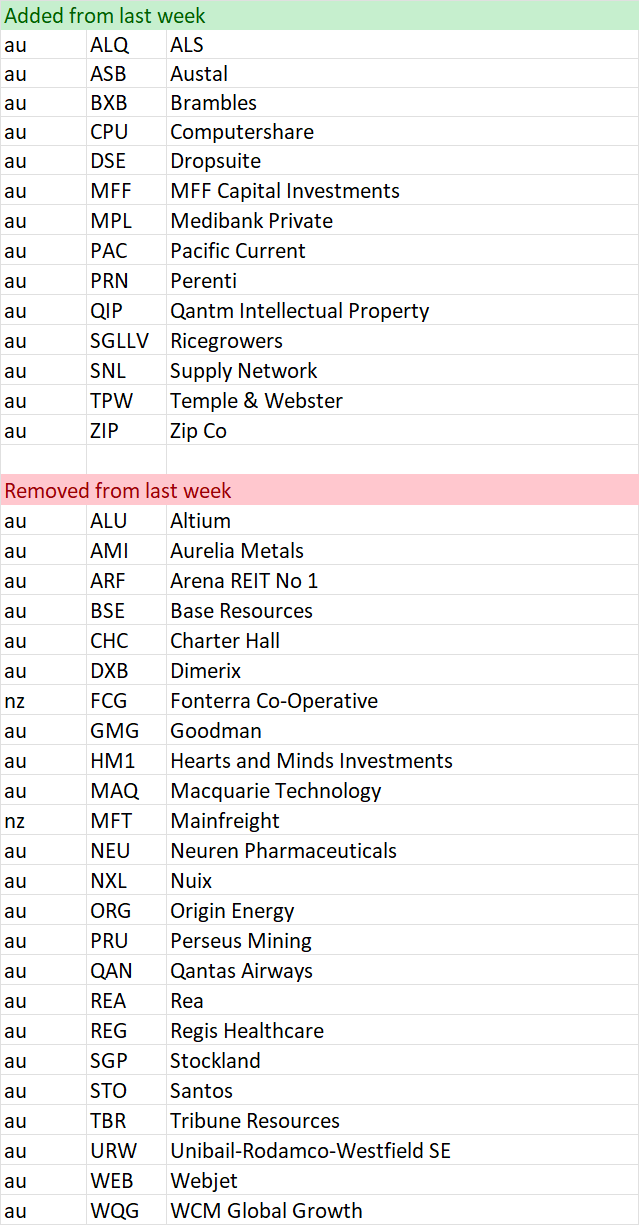
Shine Zone list as at 27 July

Momentum Movers *New Section*
I have actually published an article discussing my thinking with these tables. You can read about it here.
NOTE: THERE IS A SMALL CHANGE TO THE SCREEN. PLEASE READ BELOW.
ALSO THERE WAS A CRITICAL ERROR IN THE SCREENER WHERE DUAL LISTED STOCKS WERE EXCLUDED, THIS MEANS THE MONTHLY COMPARATIVE FIGURES WON’T APPEAR UNTIL THE FOLLOWING MONTH (Start of September). SORRY FOR THE INCONVENIENCE
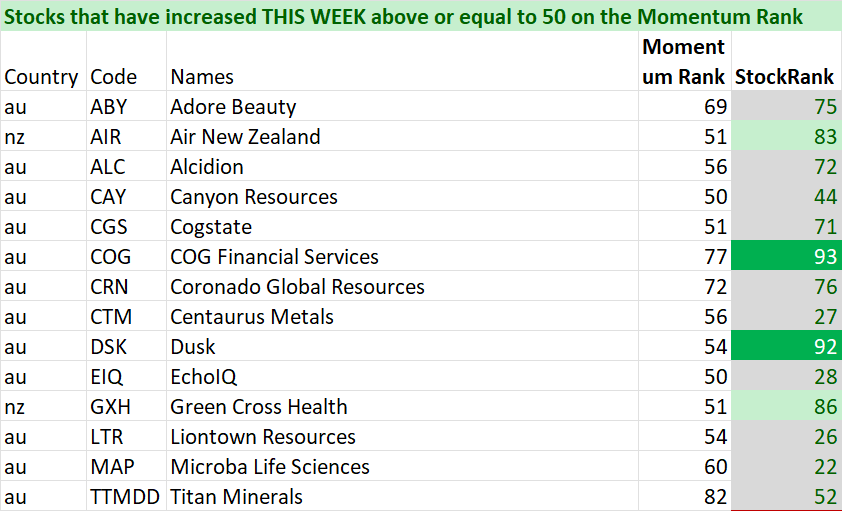
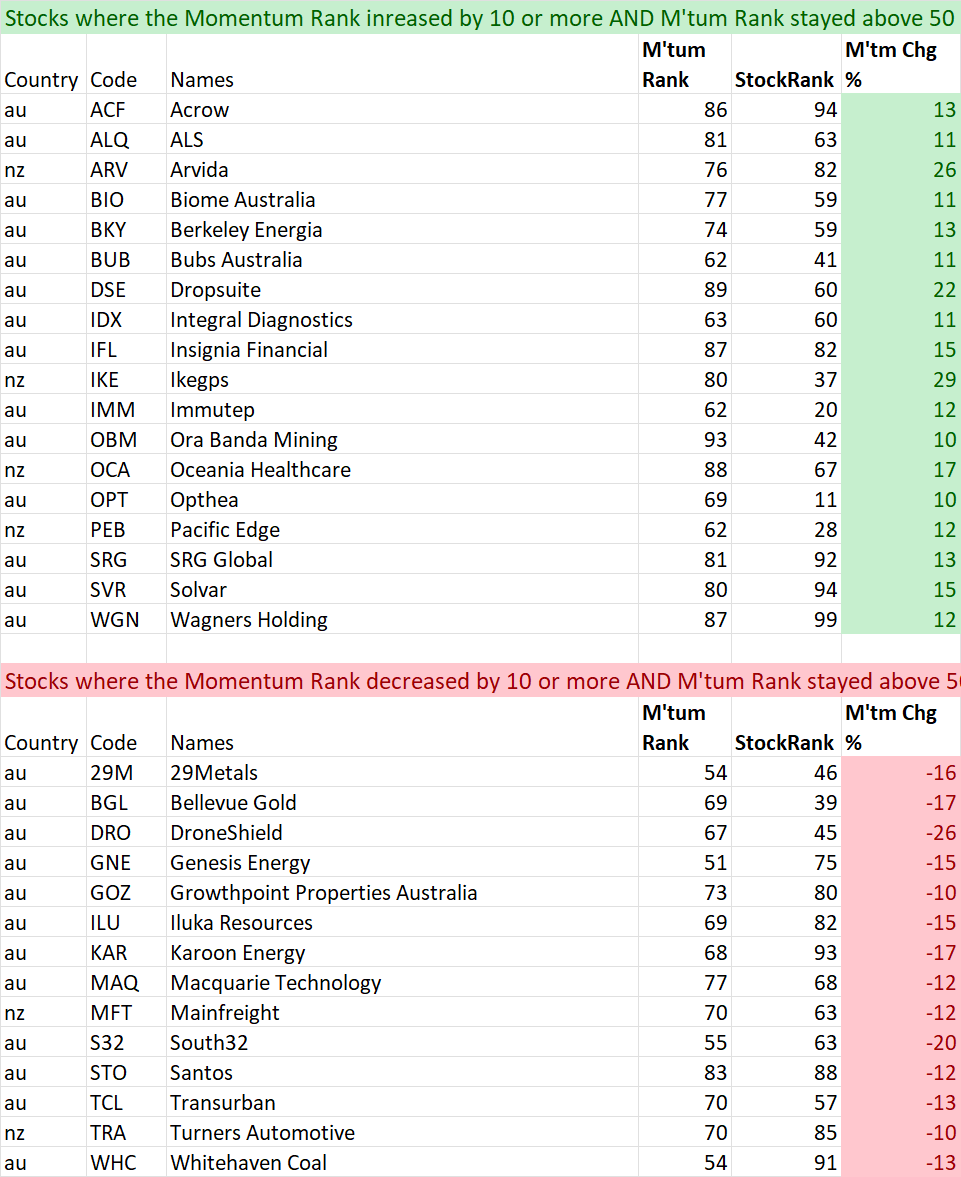
In summary, there is a school of thought that the change in something is just as important as the absolute number itself. Momentum is our most volatile ranking. This section is intended to bring to readers attention the big moves from a Momentum Perspective. As with other lists this is not designed to be a list of stocks that are replicated. Rather it can be a starting point of investigation for further consideration. Initially it will record weekly changes. This will include a monthly change when enough time has elapsed. This section is divided into two lists.
First is a list of stocks that have just crossed above 50 from a Momentum perspective. By definition, these will be stocks that have improved over the past week and month and may warrant further investigation. As a bare minimum a look at liquidity and market cap.
The second list measures all stocks that are currently ranked above 50, have remained above 50 during the time periods analysed (ie not just added or removed) AND whether they have improved or worsened by more than 10 points on the Momentum Rank.
With all filters a minimum market cap of $50 Mil has been included to help ensure investability from a small cap perspective. Be sure to check liquidity relative to your preferences.
As this is a new list we welcome any feedback you may have. If we have missed anything do let us know.
Data is at 27 Jul and is sorted by their code.
And remember, past performance is no guarantee of future performance.
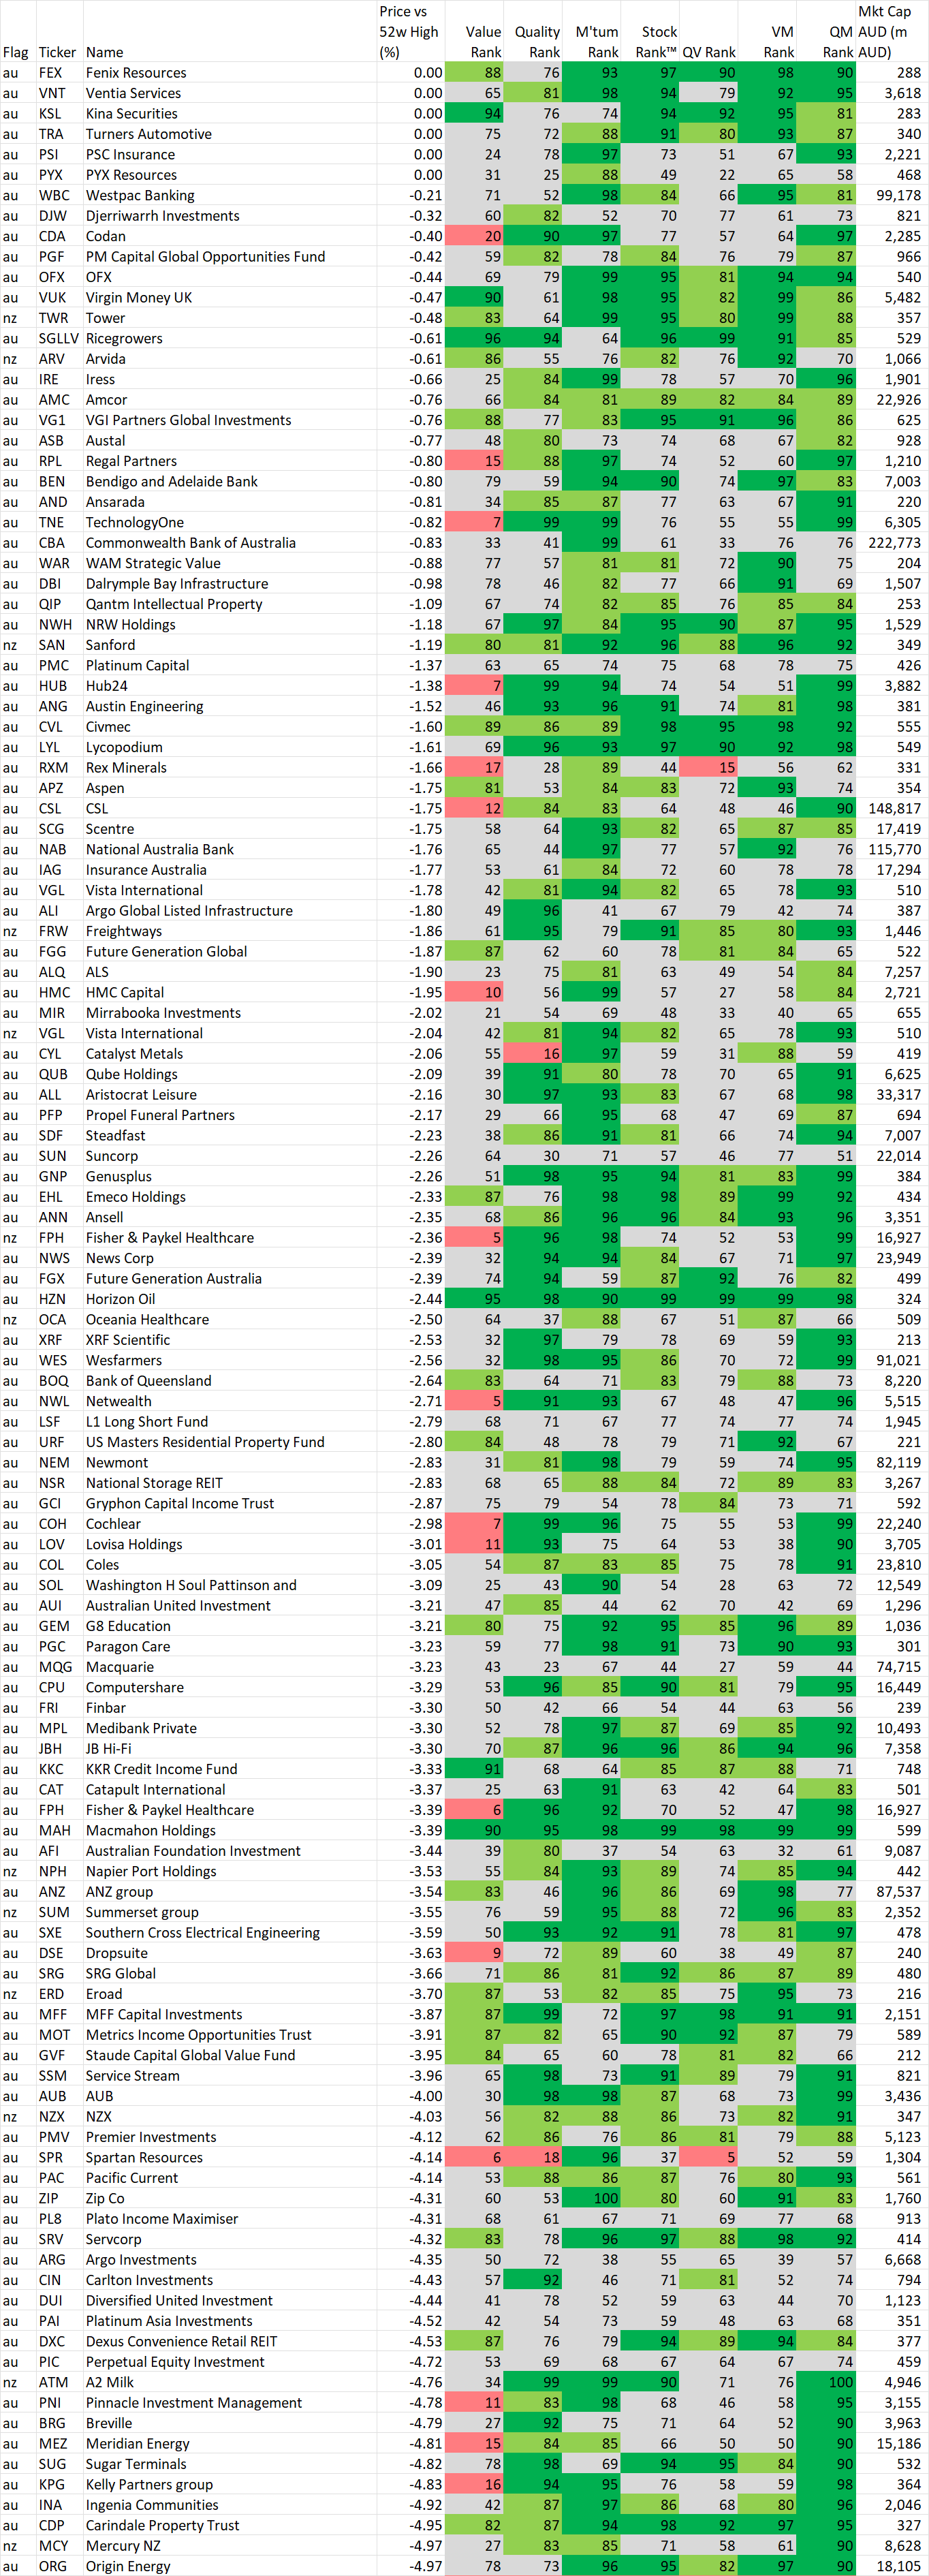
52 week high screen
In this section we identify stocks within 5% of their 52 week intraday high based on the idea, supported by academic studies, that stocks close to their 52 week highs tend to outperform. Weekly changes to the list will also be noted.
If you wish to recreate this screen in the screener select "Price vs 52 high" greater than -5% and Mkt Cap greater than $200M
A stock coming onto the list is NOT an automatic buy, just as a stock that leaves the list is NOT an automatic sell. As with the shine list, assess every chart on its merits. However movements on this list may alert you to interesting charts so be sure to look at Stockopedia and the chart first.
Data is at 27 Jul and is sorted by the stocks closest to their 52 week intraday high.
Also look at the market capitalisation and liquidity before making any decisions!
And remember, past performance is no guarantee of future performance.
Changes from last week
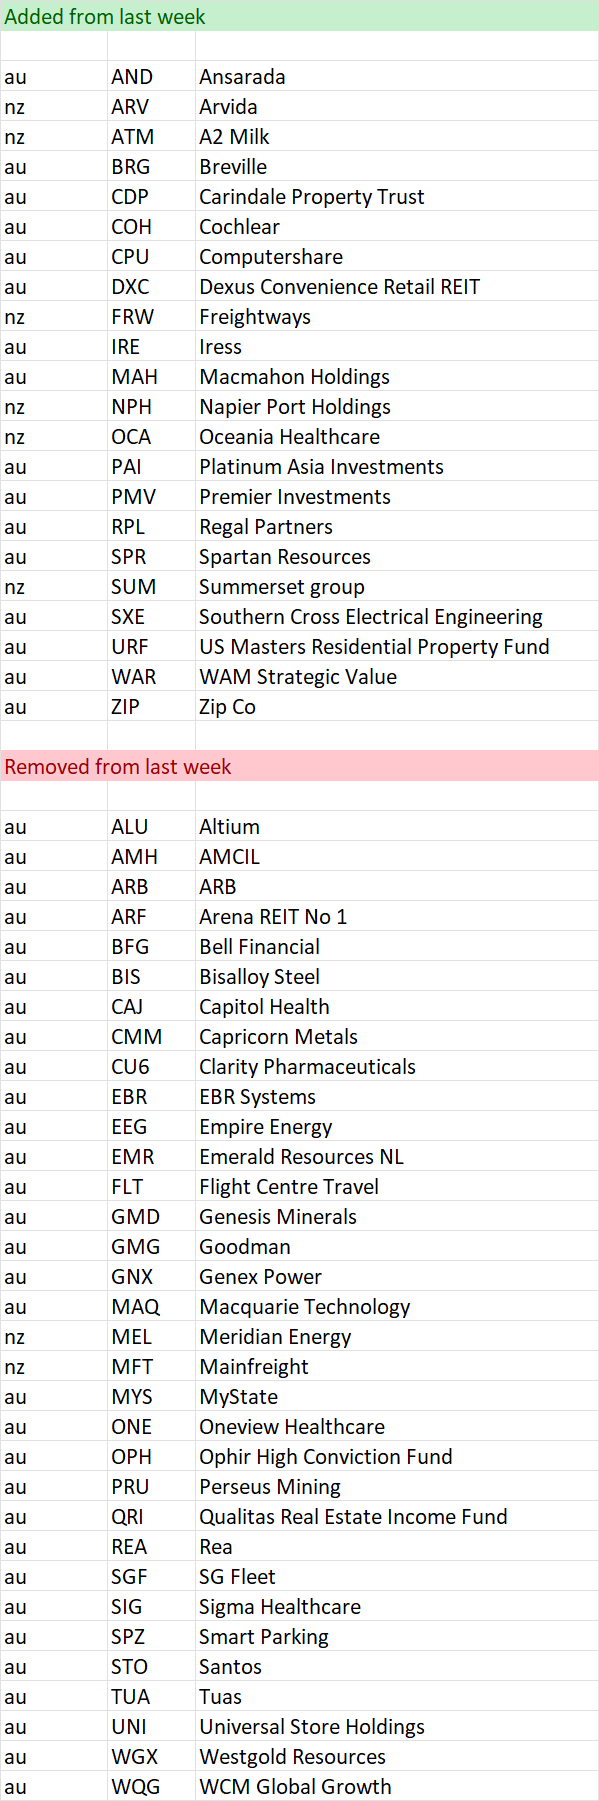
Stocks within 5% of their 52 week high as at 27 Jul
Important Information: Stockopedia Ltd ABN 39 757 874 670 UK business registration number 0637267 (“Stockopedia”) is an Authorised Representative of Daylight Financial Group Pty Ltd ABN 77 633 984 773 (“DFGPL”) which is the holder of an Australian Financial Services Licence (AFS Licence No. 521404).
Information in this commentary is current as at date prepared unless otherwise stated. However, please bear in mind that investments can go up or down in value, and that past performance is not a reliable indicator of future performance. For more Important Information please refer to the Disclaimer section of this website.
This communication may contain general financial product advice. It has been prepared without taking into account your personal circumstances, and you should therefore consider its appropriateness in light of your objectives, financial circumstances and needs before acting on it.
If our advice relates to the acquisition or possible acquisition of a particular financial product, you should obtain a copy of and consider the Product Disclosure Statement (PDS) before making any decision.
The author holds interests in companies listed in the data tables . This position can and will change at any time without notice.
Disclaimer
This is not financial advice. Our content is intended to be used and must be used for information and education purposes only. Please read our disclaimer and terms and conditions to understand our obligations.
4 comments
I couldn't agree more on your comment that "the big family investment offices didn't become big by one individual doing their own research". Stockopedia, for me, has saved me so much time!
I am glad you appreciate my slightly off centre humour Mr Ed. Though I do think, often having watched that program as a child (re-runs) I suppose I am showing my age. I am sure my initials had nothing to do with it.... Nor the fact my Mum's B'Day is on the 1st August... I can keep digging...
Momentum movers' inclusion in this forum is a valuable addition . Thanks, Elio
Thanks for the feedback Sagie. More welcomed! Regards Elio.