Momentum Monday 29th April 2024

Welcome to Momentum Monday.
It certainly felt choppier than it was last week, and is a prime example of why I now try to ignore the goings on of the market and follow the directions of the lines.While noise might get louder, for now there is little change to sentiment. This doesn't bother me. Of course it would if I was 100% in cash, but I am not. I have an allocation to cash in the case of a rainy day. But despite the noise - it ain't today.
Interesting links
Weekend Watchlist with Shares for Beginners this week is a Stock Not like when it listed. It is S32 South32 Limited. Listen here to the replay
I recently wrote an article for the AFR noting the arrival of AI that we have noticed 20 years too late and stocks that will likely benefit. You can read it here. Given the tyranny of timing one company has had a capital raining and another i being taken over. But it doesn;t change the narrative.
Our “Empower Others” referral program will e undertaking a change. For now we maintain the current system, be sure to Learn more here if you are interested in current plan
For any external commentary we make to the broader market, follow us on Social Media Facebook Linkedin Instagram or X (formerly Twitter)
This week’s content is as follows:
Broader market sentiment
Member corner
Stocks in the “Shine Zone” (including changes)
Buses pulling out of the station (volume + price movers)
52 week high screen (including changes)
A reminder that you don’t have to read all this contribution. Simply scroll to the area of interest.
Broader Market Sentiment
We look at the direction of both the US and ASX markets to gain an understanding of the broader sentiment at the minute. It is important to stress here that I DO NOT use this to time my entry or exit out of stocks. I prefer to use the individual charts of stocks to do that. However I find it useful in helping us determine how aggressive/cautious traders should be in their trading. In short the more positive the broader market is the more risks you can take and vice versa.
US / S&P500
Well, it just goes to show you what a charting education does for you.
Last week I noted the three negative weekly barsm growing in severity. This week it was positive. Though I note it was not as high as the all time. In fact it wasn’t enough to cover the previous week. And this despite the strong performance on the US Market Friday their time.

S&P500 Weekly chart
Now before I throw out everything I have known to get this point, the overarching view remains and that is there are two key points:
Markets zig and zag
The more consecutive moves in a certain direction bring you closer to a move the other way
Actually in a way, point 2 reads as point 1, but I am not in the mood for discussing semantics. It can all be bundled up in the idea that the market is behaving normally.
Leading into this week we discussed that the IT stocks were reporting their quarterlies, and they did, and they were very big. The pick of the bunch being Google as a well worn acronym became the focus of traders (and of the company itself.)
Long story short though. This was the best week for the S&P500 since November jumping 2.7%. At this point I will insert the audio worm that is running in my head, “But the dips… Man” But this action is much harder to do when you have an investment timeframe longer than a flea’s life span and you don’t draw a wage. Either way, it doesn’t change the context of last week’s commentary. Nor do the stubborn inflation pressures previously discussed go away. Especially the tone coming from the Fed and the now agreed view that it was a pipe dream that we would see three rate cuts this calendar year, (though I hasten to add that one should never say never when it comes to the markets,) it is looking increasingly likely that two cuts are what can be hoped for at best. The latest data point that contributes to this belief was the core personal consumption expenditures reading which for March can in at 2.8%- hotter than expected.
And let’s not forget, prior to the pop on Friday the market was looking weak so we can’t forget our previous cautionary statements. Next week, reporting season continues. Traders will be looking at the like of Bellwethers such as Amazon and Apple. Not only that but they will have the Federal Reserve’s next rate decision to contend with.
But looking at charts again it stays above 4734 so I maintain my general sense of humour. I will start to get really worried around 4117.4. But until then… carry on.
AUS S&P/ASX200
I mentioned last week the lament that we had returned back into the sideways channel. Then we had broken out, until another the close on the Friday ruined it for us all. But pleasingly we finished up for the shortened week. Even if it was only by 0.1%. Looks lilikwwe will start Monday more favourably.

S&P/ASX200 Weekly chart
Notwithstanding the hope that we go up there is still a lot of confusing messages out there stemming from a possible China recovery, the Middle East conflict or stubborn interest rates.
Inflation was hotter than previously expected, but our market is less in time to the movements in bond rates and post meeting commentary. But just like with anything in life, investor will be best to remember that dropping interest rates is like losing weight. The first few kilos are easy, and then it gets hard to lose the last few to get you to your target range.
But the big news story of course was the BHP non-binding, non-committal, headline grabbing takeover of Anglo American. Which makes sense that it is made when the commodity cycle has been so up and down recently. The problem is it became public knowledge that the UK Based Centuries old company was being sought after for its copper resource. This is a commodity that is currently trading at 52 week highs, and not too far from all-time highs.
Therefore, it was unsurprising on Friday night to see Anglo American give the Daniel Kerrigan “tell ‘em they’re dreamin” to BHP’s $60 Billion bid. Of course the actual refusal was far more eloquent than that. However in my eyes the result is the same.
Which leads me to a good point as some investors are wondering why BHP would do such a thing and not dig holes for themselves. It would appear cheaper and it would dilute shares by less. And to a point I agree. But the problem is that a BHP is as nimble as an oil tanker at sea. It takes an age for it to get stuff done. Also why take on all the exploration risk many single commodity, single project explorers face, when they can be patient and wait for a producing multi-decade asset to appear and just buy that?
But again, we can never say never in the market and a cashed up BHP may circle back with a more attractive bid (and the market thought it would have to as well, given the price reaction on Friday) - and let's face it. Our market could do with another Mega-Merger, though it will be best to remember such a process can take over a year to materialise.
There have been quite a few quarterly updates released by stocks onto the market so be sure to read up on those. Particularly if you are invested in the Materials and Biopharmaceutical space.
And as a final note…. Can people in positions of power within a company please note what is happening at Super Retail? When will we ever learn that this stuff is natural, also that any lawsuit will likely be inconsequential, but the look is terrible. And so was the price on Friday. We don’t change our fundamental view of the company.
But big mergers means the economy is healthy, therefore not withstanding recent calls to sell the banks, I remain long and aggressive for the minute, but I remain on alert should broader sentiment change.
Member corner
In this section we will provide a detailed chart assessment, on a maximum of ten stocks weekly, on companies from those of you in the Gallery.
We welcome stock requests to be analysed from members. We will also be looking at the charts of some of the more actively researched stocks for the week. We will try to rotate through a selection so as to not make the charts stale, however we will likely not cover a stock within 2 months of when it was last discussed.
If you want to see what has been written about a stock recently, go to the discussion area.

We will not be making up suggestions. If there are no changes to the most viewed list and/or there are no suggestions from members, then no stocks will be covered.
To learn of the methods used to analyse companies in this section, refer to my Momentum Journey series that I articulate here in three parts.
They will help provide context on what I am writing about and the editorial angle of this report.
Also look at the market capitalisation and liquidity before making any decisions!
And again, if you have a stock you would like analysed from a momentum perspective, please write it into the comments section below or email us at @stockopedia.com.au">support@stockopedia.com.au
IF NO ONE ASKS… HOW AM I SUPPOSED TO KNOW?!?
ASX: NCK - Nick Scali Limited
StockRank 97
Momentum Rank 99
QM Rank 99
VM Rank 93
A$15.85
Last discussed in December from a Momentum perspective was Nick Scali (ASX:NCK). and it is doing fine without our focus.

ASX:NCK 1 year Daily chart
When last discussed I mentioned “This level is now resistance ($12.42 - $12.61) and I would prefer a clean break above it for the stock to have any chance of reaching the previous all time high of $16. I still have $9.20 as my stop loss level.” Well we got those and the price kept running.
The news which brought them to the attention of members is very different than last time. On this occassion the company is entering the UK market and hope springs eternal it won't end up being the basket case as so many others have been. Therefore watch this closely.
Especially as it approaches all time highs and I said back then this would be the first target. I remain of that view. Short-term support for those considering a trade would be inserted at say $13.70 from here.
But hopefully the positive re-rate can stick and the stock can continue rewarding share holders.
ASX: KAR - Karoon Energy Limited
StockRank 94
Momentum Rank 70
QM Rank 80
VM Rank 94
A$1.94
I noticed during the week Karoon Energy (ASX:KAR) was amongst the most viewed stocks. I last covered it from a Momentum perspective in November last year which you can read here.

I don't know how I can help more? I said, “For those brave enough to try a position on the back of the announcement of the acquisition and a weakening short term oil price then $1.87 is now the current stop loss. If that level was breached, I would wait for a mild bounce before making an elegant exit.” That is exactly what happened.
So what to do now? In my view, unless it crosses back above $2.38 Which coincides with the short term lower high, I won't be interested. It has to hold $1.85 - $1.86 at all cost. And given it is closer to the bottom on my range, I will leave it be. For those brave enough, you won't have to wait long to know if you are wrong. But a failure brings $1.52 in to play (though I’d rather it not.)
ASX: SUL - Super Retail Limited
StockRank 99
Momentum Rank 97
QM Rank 96
VM Rank 98
A$14.37
Regularly discussed is Super Retail (ASX:SUL). From a Momentum perspective that was in January this year.

ASX:SUL 1 year Daily chart
At the time I noted the stock was trading at all time highs and I said “my short-term/trading support is at $14.50-$14.53.” On Friday it was discovered that a looming litigation was coming on account of the CEO and Head of HR having a non-disclosed relationship with one another. While amounts are not consequential to the company's outlook, from an investment perspective it doesn't look good.
As a result the level I spoke of was broken through and the stock has entered a short term downtrend .
Which means from a traders perspective I would be on an exit footing, looking for a bounce for a more elegant exit.
History has taught us however that such news can cause over reactions in the short term as evidenced by SUL’s price move on the day. Therefore I would be inclined to think the market is wrong in this instance. But we can't ignore the change in sentiment. I won't look at the stock until it crosses above and sticks $16.10. The downside level I see was the previously mentioned $13.53, which was resistance but now looks destined for support and it would be a good stop loss level for those considering a trade now.
ASX: BSE - Base Limited
StockRank 93
Momentum Rank 67
QM Rank 81
VM Rank 90
A$0.245
A ghost from the Spotee Connect past has made its way to the most viewed list this week and it is any wonder given the price has shot up over 100%. It is Base Resources (ASX:BSE)

As mentioned previously, once corporate actions get involved the chart is always harder to look at.
And there definitely has been some activity. Know for Toliara, it's Madagascan Rare Earths project that is yet to receive government approval. The company received an offer from Canadian based Energy Fuels Inc for a cash and script offer of around 30 cents per share. Unsurprisingly the Board have unanimously accepted the offer and it looks like this deal will be done.
Prior the announcement though, it looked nothing like a stock like I would look at. It was a multi year lows, about to test all time lows and entrenched in a down tread. Despite the pop the price is only where it was at in September last year, and it was for too long in the too hard basket. This development is an ok outcome, for the believers.
Remember, the Quality score has been quite descent on account of Kwala project. Also the previous yield has been quite high. But if it can get Toliara off the ground and gain much awaited government approval it will be a multi decade resource that in this instance we have Energy Fuels who will be willing to take on the waiting game on behalf of inpatient investors despite the persistent positive rumblings from government.
Stocks in the Shine Zone
To learn about the Shine Zone and how to use it, you can read it here.
The rules for inclusion in this list are based on those I like to see in a stock before considering a trade in it:
QM Rank above 80
Price is above the 2.5x ATR
50d MA is above the 200d MA
Price is greater than the 200d MA
Market cap greater than $200M
This is a very important point: the “Shine Zone” are rules for possible buying. They are not for holding and/or selling. If a stock falls out of the shine zone, use support levels to set your stops, or instigate a parachute stop if necessary. With markets moving sideways, one expects frequent changes in these lists.
If you feel there is a stock that should be included but is missing please let us know. This is a manual process and occasionally one gets through the cracks
Also look at the market capitalisation and liquidity before making any decisions!
Data is at 27 April and is sorted by the stock code.
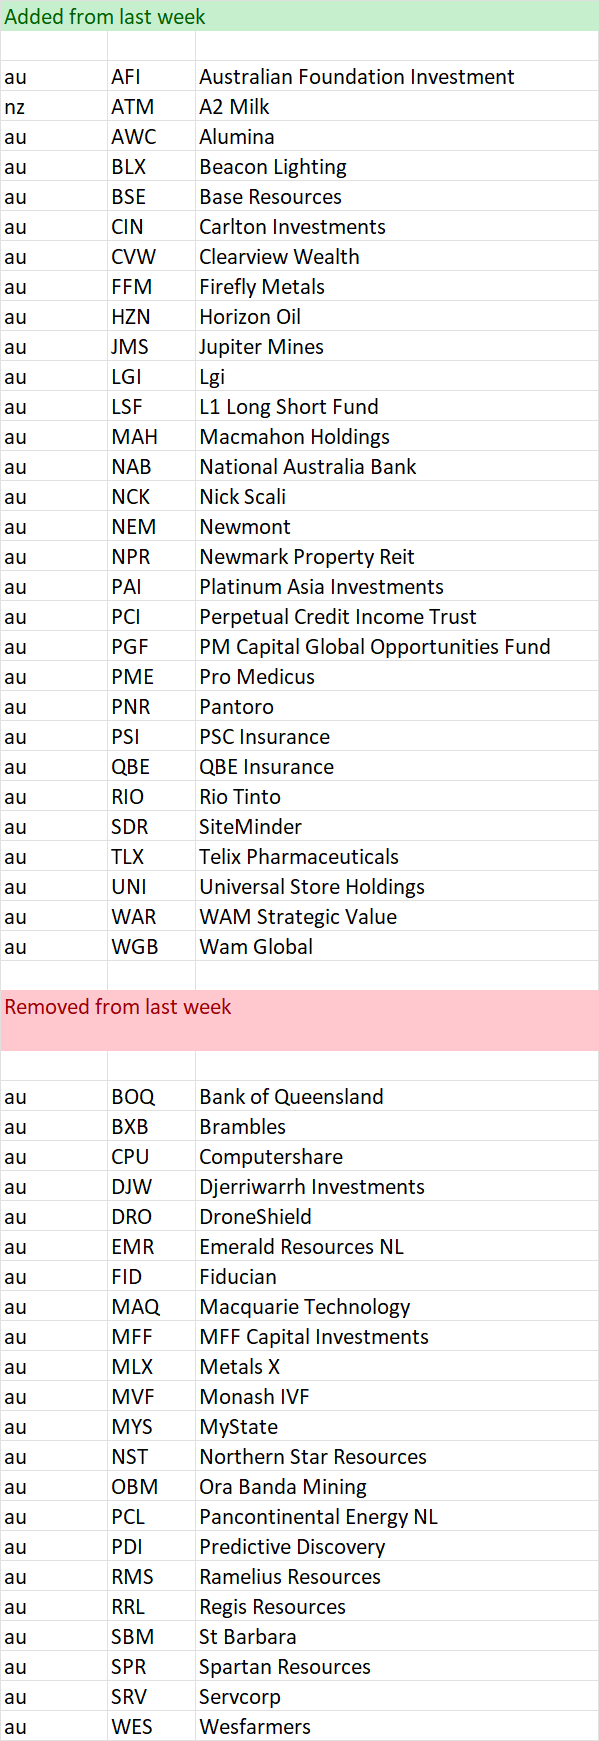
Changes from last week
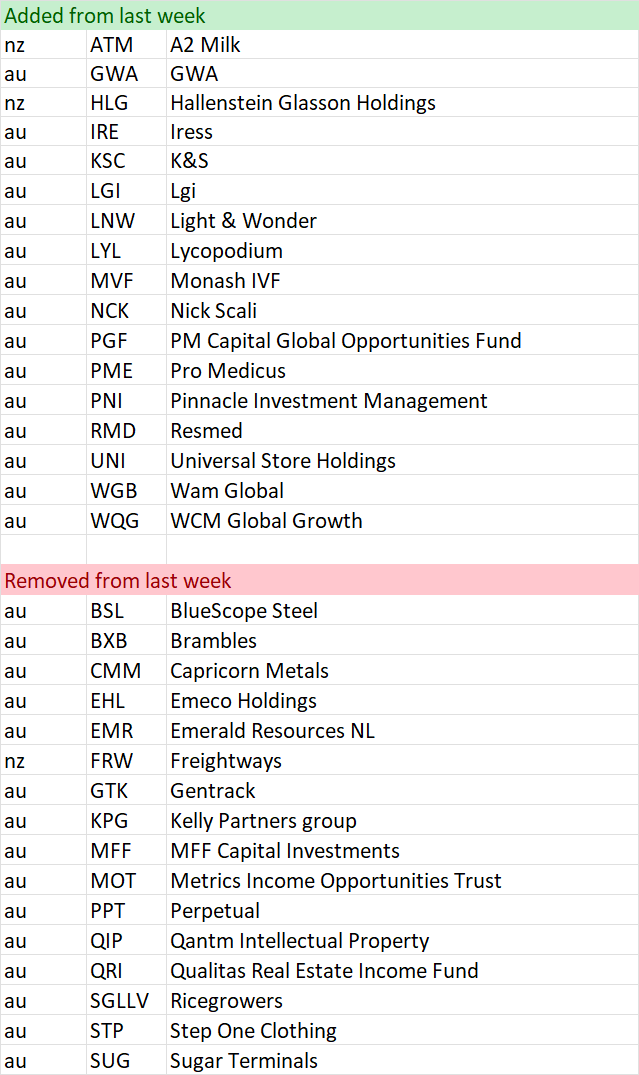
Shine Zone list as at 27 April
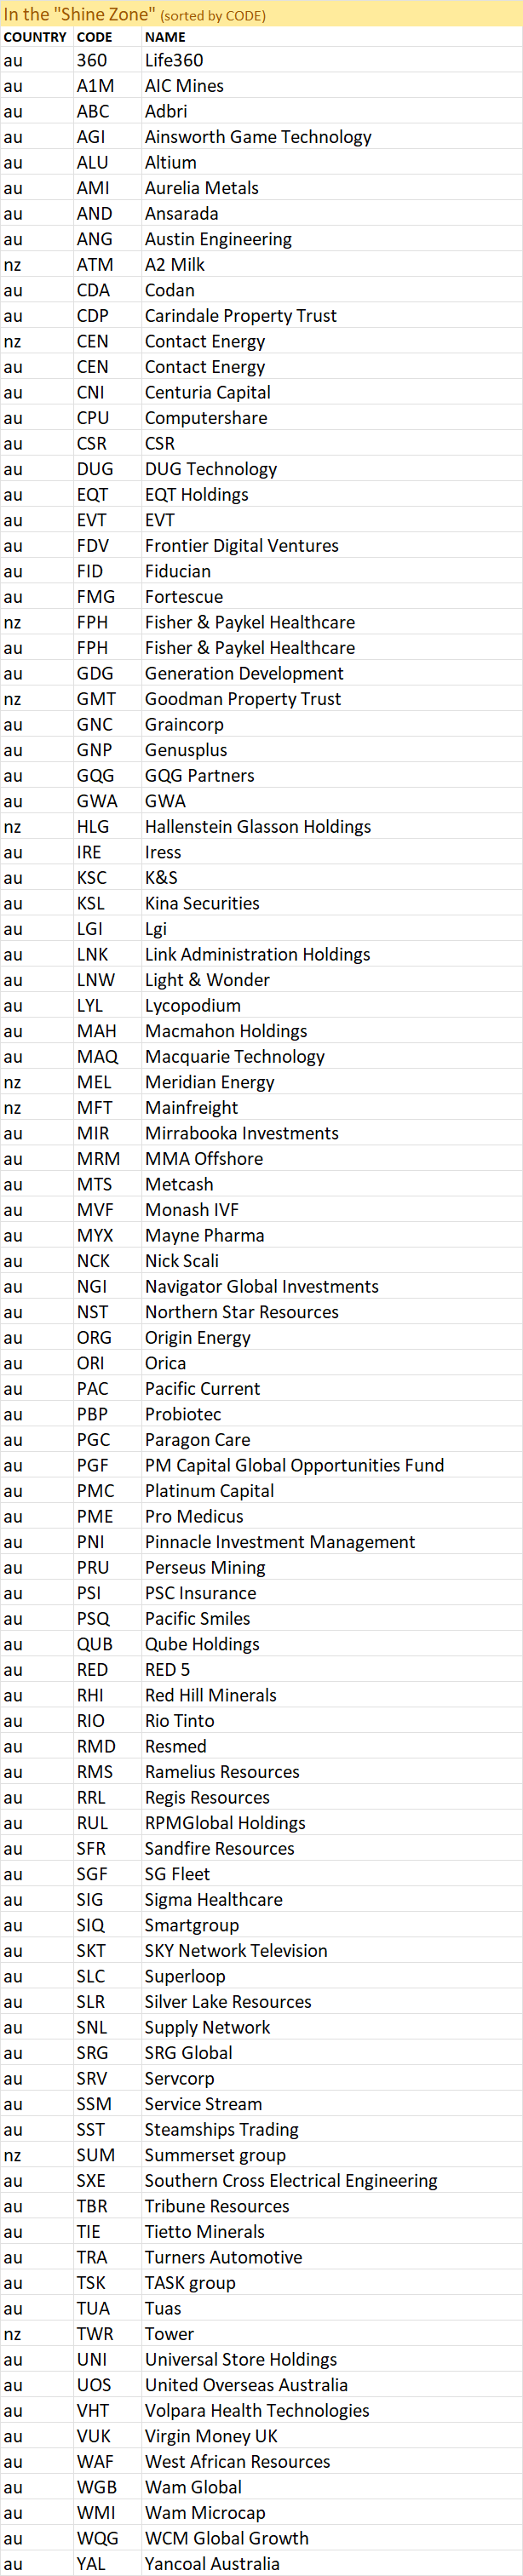
“Bus pulling out of the station”
To learn more about this screen read the following article on the objective of the screen
Here is a shortcut in understanding the reasons why a stock is removed:
Volume drop = Bus might be moving, but no one is on it
Price 1 mth < 0% = Bus has been cancelled
Price 3mths >= 3% = Bus has pulled out of the station
Also look at the market capitalisation and liquidity before making any decisions!
Data is at 27 April and is sorted by the stock code.
Changes from last week
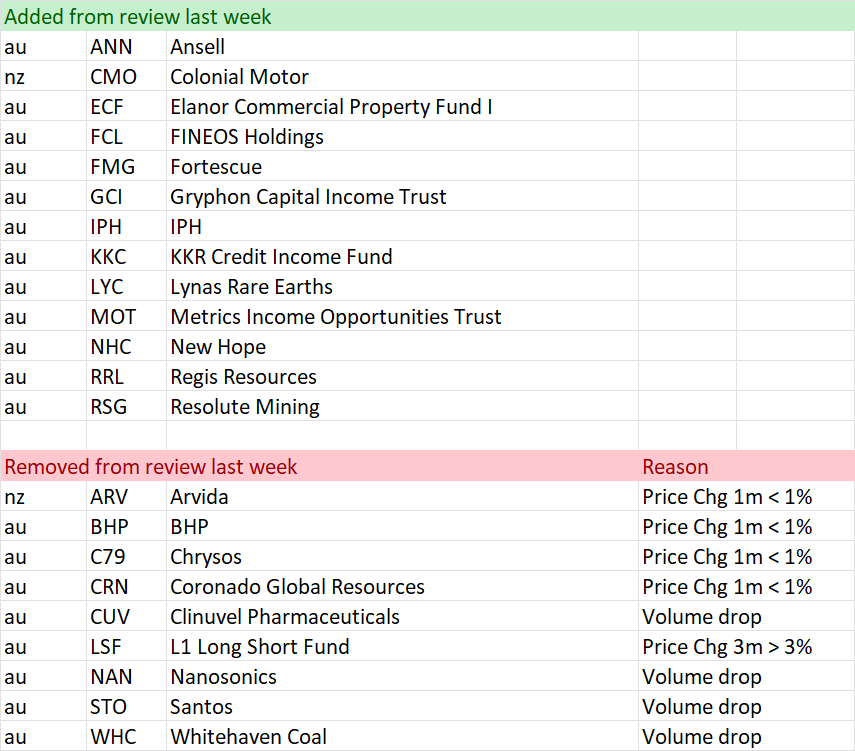
“Pulling out of the station” on 27 April
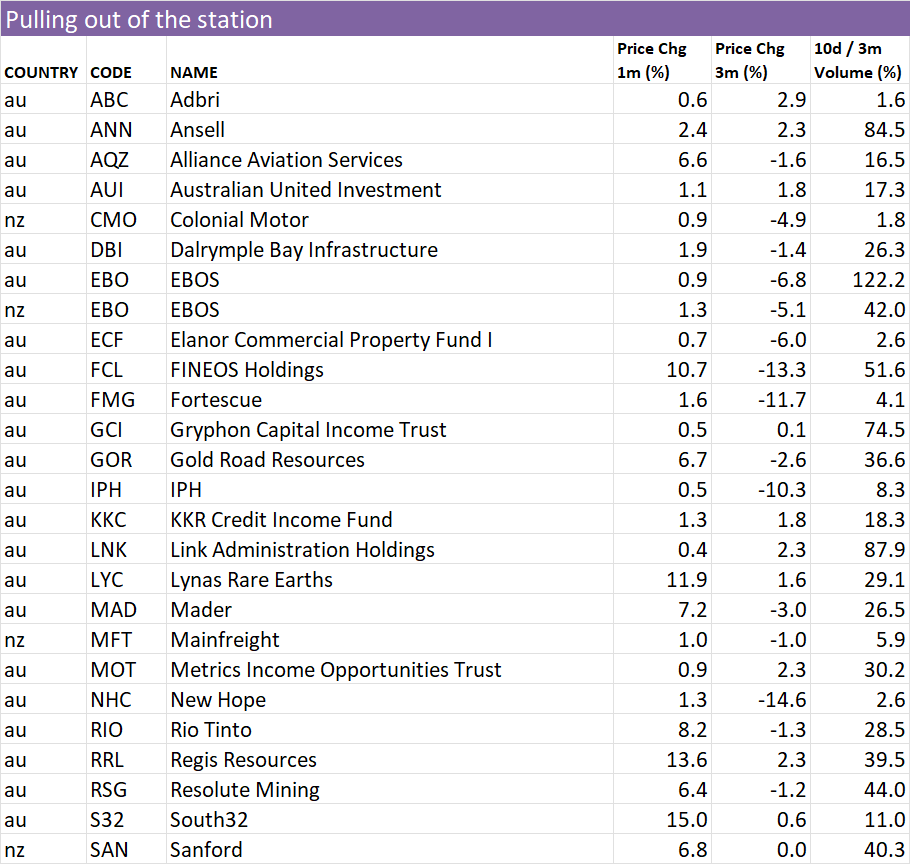
52 week high screen
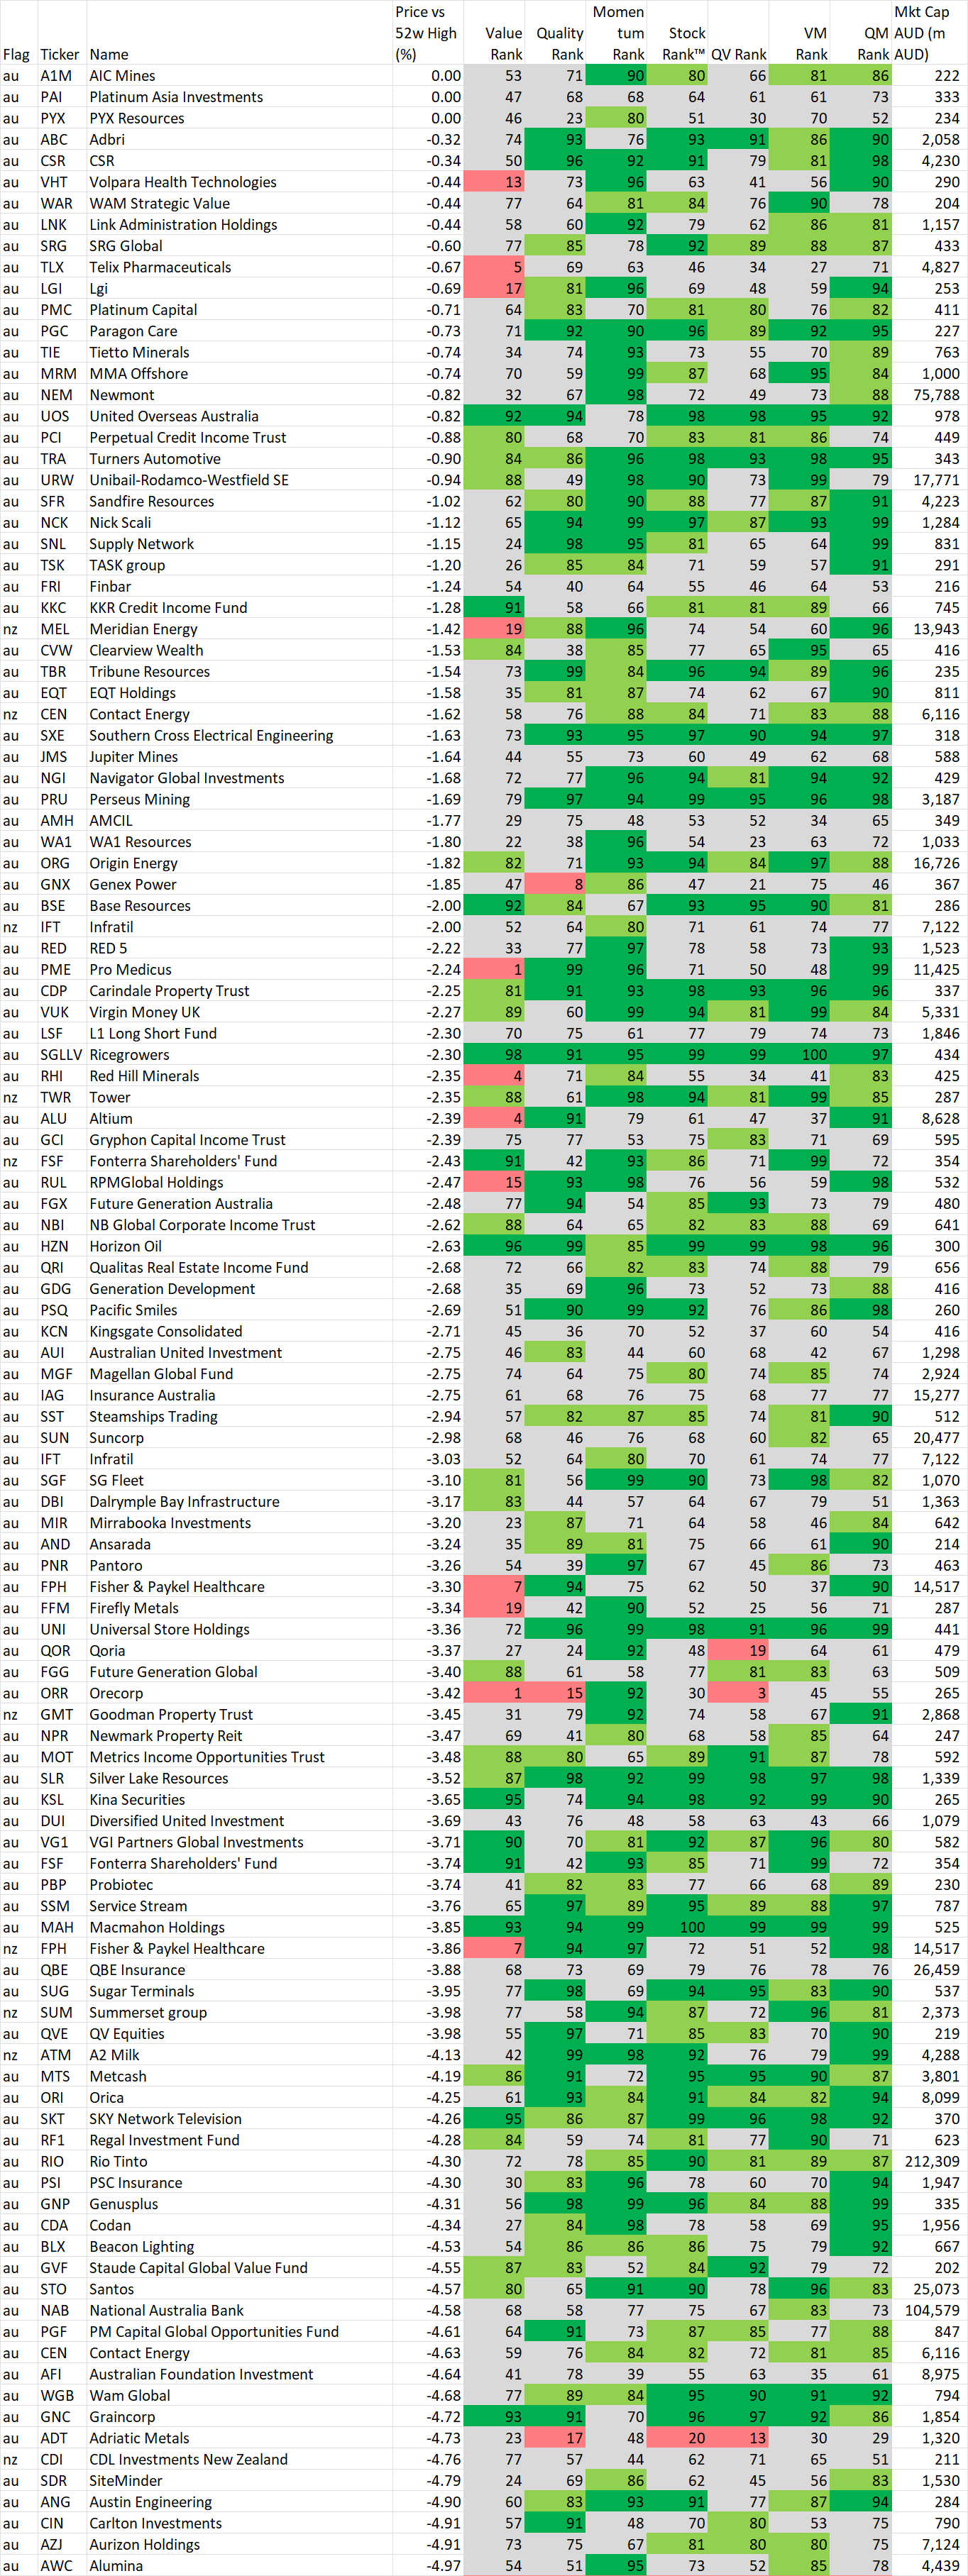
In this section we identify stocks within 5% of their 52 week intraday high based on the idea, supported by academic studies, that stocks close to their 52 week highs tend to outperform. Weekly changes to the list will also be noted.
If you wish to recreate this screen in the screener select "Price vs 52 high" greater than -5% and Mkt Cap greater than $200M
A stock coming onto the list is NOT an automatic buy, just as a stock that leaves the list is NOT an automatic sell. As with the shine list, assess every chart on its merits. However movements on this list may alert you to interesting charts so be sure to look at Stockopedia and the chart first.
Data is at 27 April and is sorted by the stocks closest to their 52 week intraday high.
Also look at the market capitalisation and liquidity before making any decisions!
And remember, past performance is no guarantee of future performance.
Changes from last week
Stocks within 5% of their 52 week high as at 27 April
Important Information: Stockopedia Ltd ABN 39 757 874 670 UK business registration number 0637267 (“Stockopedia”) is an Authorised Representative of Daylight Financial Group Pty Ltd ABN 77 633 984 773 (“DFGPL”) which is the holder of an Australian Financial Services Licence (AFS Licence No. 521404).
Information in this commentary is current as at date prepared unless otherwise stated. However, please bear in mind that investments can go up or down in value, and that past performance is not a reliable indicator of future performance. For more Important Information please refer to the Disclaimer section of this website.
This communication may contain general financial product advice. It has been prepared without taking into account your personal circumstances, and you should therefore consider its appropriateness in light of your objectives, financial circumstances and needs before acting on it.
If our advice relates to the acquisition or possible acquisition of a particular financial product, you should obtain a copy of and consider the Product Disclosure Statement (PDS) before making any decision.
The author holds interests in companies listed in the data tables . This position can and will change at any time without notice.
Disclaimer
This is not financial advice. Our content is intended to be used and must be used for information and education purposes only. Please read our disclaimer and terms and conditions to understand our obligations.
No comments yet
No one has commented here yet! Why not be the first one?