Momentum Monday 30th September 2024

Welcome to Momentum Monday.
Congratulations to fans of the Lions and their supporters for their win over the weekend and for creating your own bit of history. I hope it delivered the spring in your step that you need to tackle the week ahead.
And just like watching the Grand Final with your team in it, so too is making money as it is quite stressful isn’t it? Especially when you hold stocks going the wrong way when the market is at all time highs. Not for Momentum Investors of course. Such superficial feelings such as the “the need to be right all the time” are (or at least should not) be in the arsenal of someone that looks at Squiggle lines. So with so many stocks going in the right direction. Ask yourself… why? It better be a good excuse. Never stop questioning yourself. You should always be 100% comfortable and never 100% correct.
Interesting links
It is time to book your place at the virtual table for the next Friday Lunch ‘n Learn session. You can do so by clicking here and feel free to send us any early questions if you have them. Not too early though because things can change in an instant. Remember…. If you can’t tune in live book your place anyway and we will send you the recording
Don’t forget to “Empower Others”. There is no better time to refer the award winning platform which is Stockopedia than right now at our best ever rate. If you think there is someone who will benefit from this offer, please reach out and we will send you the link.
For any external commentary we make to the broader market, follow us on Social Media Facebook Linkedin Instagram or X (formerly Twitter) Some of you already have so ‘Thank You’ for that.
If you haven’t already signed up to Podbean or your favourite streaming channel to receive our morning ASX market reports. (ASsuming you know what I even mean)… Click here to signup for it
This week’s content is as follows:
Broader market sentiment
Member corner
Stocks in the “Shine Zone” (including changes)
Momentum Movers (weekly only)
52 week high screen (including changes)
A reminder that you don’t have to read all this contribution. Simply scroll to the area of interest.
Broader Market Sentiment
We look at the direction of both the US and ASX markets to gain an understanding of the broader sentiment at the minute. It is important to stress here that I DO NOT use this to time my entry or exit out of stocks. I prefer to use the individual charts of stocks to do that. However I find it useful in helping us determine how aggressive/cautious traders should be in their trading. In short the more positive the broader market is the more risks you can take and vice versa.
US / S&P500
Another positive week for the broader S&P500 means there is no change in sentiment for the moment.

S&P500 Weekly chart
It's fair to suggest that with the market over there closing on another weekly high, up around 0.6% for the week, that sentiment is strong, despite the weaker close on Saturday our time.
The continued talk of rates coming down even further has provided the impetus needed to ensure that markets remain at these elevated levels. However many it ends up being I am not exactly sure. But remember too many and it could be because we are headed for recession and we definitely don't want that.
If fact barring disaster it looks like this will be the 8th month of Nine this calendar year that the S&P500 will see a positive gain which is actually a good sign for the coming quarter as historically such performances have lead to solid gains for the remainder of the year.
My logic brain however tells me that I should not get my hopes up for similar gains in the next year as it would be hard pressed to not see the current market pricing in everything that it needs to. But fortunately in this commentary I have compartmentalized it away. For example, I would not have thought that Materials on their (and our) market would have been so strong. But doing so means that they are on the radar again even though we should all know by now that are cyclical in nature.
Less is more for a market trading at all time highs and there is really not much else to say.
I said last week that I would lift my review level above 5151 if we had a positive week. But I am not going to do it for now. Therefore it stays at 5151 for the moment. Surely the ,arket can’t keep going up… can it?
To be fair I am not super convinced of that level and I won't be trading on it… but as is the purpose of this contribution if it falls below it, I will look closer at my stocks and perhaps I may change my sentiment…. But it is not this week.
AUS S&P/ASX200
Another week and another weekly high… just. A public holiday here in Victoria was not even enough to dampen sentiment. Seriously if you are not outperforming a broad market index at the moment then what is the point? Note I am talking about the portfolio NOT each individual stock because of course that is why we diversify. Chasing the elusive 100% is a fool's hope. “Let your profits run and cut your losers” is a quote that Momentum Investors should know all too well. We don’t try to pick the tops and bottoms. Rather it is the chunky bits in the middle that we keep an eye out for.
S&P/ASX200 Weekly chart
Of course a closer analysis of the broader market showed, particularly later in the week, that many mining stocks did the heavy lifting. This was in direct response to the Chinese Government decreasing the amount of cash a lender had to have on hand and also cutting official cash rates. This is an attempt to salvage an already crucified property sector and get that going again.
It was interesting to see the big Iron Ore names see some strong flows into them, often at the expense of many of the big Banks. Is this the beginning of the cycle shift? Perhaps it may be. But we just have to watch and see what a lot of the miners do. It was the first time in a long time where mining companies did much of the heavy lifting this week. Whether it was Iron Prices returning to US$100 per tonne or short covering in the Lithium space? I don’t know. All I know is that sentiment is powerful at the moment with these price takers feeling the full extent of it this week.
Energy as a sector however started off strong as Uranium stocks jumped on news Microsoft would take all of 3 Mile Island’s production output if restarted. This was then further supported by the Chinese stimulatory move. But then it all came crashing down when reports surfaced that OPEC+ Giant Saudi Arabia may in fact ditch its dream of US$100 per barrel of crude and lift production cuts that have been in place since late 2022. Oil (and the Energy sector more broadly) continues to be a tough sector to pick.
The currency also responded as the RBA here in Australia decided to keep rates on hold for the seventh straight meeting. The real kicker came though when inflation was down lower than expected for August. Further a potential increase in the demand for our commodities from China and we saw a strong week for the dollar.
Also investors in Woolworths and Coles take note of the recent weakness in the price currently. Obviously sentiment is against you at the moment, but they are consumer staples for a reason. Therefore once sentiment has its way with the two major supermarkets, ignore them at your own peril should positive momentum return. Particularly that report from the ACCC which said Woolworths and Coles accounting for 67% of supermarket sales nationally. Which is two thirds… and given they are the two biggest…. Yes, I had to laugh too.
Then there was the Star Entertainment Group and the less said there the better. Even if you had landed from Mars yesterday… The chart told you all you needed to know. Especially when you consider the lists below are at a breaking point for the number of stocks to have a look at. You definitely don’t need a Finance degree to make money in this market!
Speaking of which, the XJO is eerily similar to where it was one week ago. I know last week I said that if we should see another positive week and I would lift that level (and I have left it on the chart for now). But seriously… a three basis point gain for the week, and much of that on Thursday, means I will leave my ‘watch and act' level at 7547 for the S&P/ASX200. Until then I remain aggressive in our market.
Member corner
In this section we will provide a detailed chart assessment, on a maximum of ten stocks weekly, on companies from those of you in the Gallery.
We welcome stock requests to be analysed from members. We will also be looking at the charts of some of the more actively researched stocks for the week. We will try to rotate through a selection so as to not make the charts stale, however we will likely not cover a stock within 2 months of when it was last discussed.
If you want to see what has been written about a stock recently, go to the discussion area.

We will not be making up suggestions. If there are no changes to the most viewed list and/or there are no suggestions from members, then no stocks will be covered.
To learn of the methods used to analyse companies in this section, refer to my Momentum Journey series that I articulate here in three parts.
They will help provide context on what I am writing about and the editorial angle of this report.
Also look at the market capitalisation and liquidity before making any decisions!
And again, if you have a stock you would like analysed from a momentum perspective, please write it into the comments section below or email us at support@stockopedia.com.au
IF NO ONE ASKS… HOW AM I SUPPOSED TO KNOW?!?
ASX:SKS - SKS Technologies
StockRank 75
Momentum Rank 88
QM Rank 93
VM Rank 63
A$1.485
A member has asked about SKS Technologies (ASX:SKS) and we are covering it for the first time from a Momentum perspective

ASX:SKS 1 year Daily chart
As the questioner pointed out, the stock had been on an absolute tear creating new higher highs and higher lows and growing exponentially in price. Much of that is due to the quantum shift in its operations as it moved more towards servicing data centres and in 2024 as evidenced by their annual report, this was a good move with 23% of all sales revenue now coming from data centres as opposed to zero the year before. Supported by an impressive client list and ROE of nearly 75% (hence its unsurprising the dividend yield is anaemic), this has not been enough to support the price in the very short term as it has pulled back from recent highs.
So the question is where to from now?
Well the good news (if there is any) in the recent pullback is that in my view this has created very firm levels of support and resistance for investors to watch.
On the negative side, if the price breaches the low of early September at $1.135 then I would be on an exit footing as this will entrench the recent short term downtrend and create a new lower low. A bounce back up by a little bit could create a more elegant exit, but the negative overall sentiment would remain.
Now the positive side. If I was not holding the stock and I believed in the long term story, then I would wait for a cross above the all-time high of $1.68 to show that the current uptrend is likely to continue. If you are impatient then crossing above $1.50 which is the level created a week ago may be prudent.
For me personally, the stock historically didn't trade enough, but congratulations to all holders as it has done incredibly well.
ASX:FMG - Fortescue
StockRank 86
Momentum Rank 35
QM Rank 72
VM Rank 72
A$20.10
Looked at a lot by members recently is Fortescue (ASX:FMG). I am not sure whether it was the bounce inIron Ore prices following the stimulus package from the Chinese Central Bank, or the fact that Gene Simmons was at the unveiling with Twiggy Forrest in Las Vegas when it was announced that $267 Million would be spent on electrifying the haulage fleet in WA in order to help the business meet its ambitious carbon targets.

ASX:FMG 1 year Daily chart
The chart shows the bounce in Iron Ore prices (likely not caused by the Gene Simmons appearance). However the price has been in a downtrend since making its all time high in February this year. I last commented on FMG from a Momentum perspective two months ago. You can read that commentary here. I said, “In my view this remains a clear avoid until the chart looks better” and from then it has created a new lower low, broken long-term support and is in a well entrenched downtrend. But also as I alluded to in that discussion, FMG is a price taker and with Iron Ore levels jumping off US$90 per tonne (Back then it was US$100 per tonne) we have seen some life in the price from a short term perspective.
So where to know? As a short-term trader, the aggressive move last Wednesday created a new short-term higher high meaning the price may be rebounding from here, therefore a nibble on any pullback may be recommended provided it stays above the low of a few weeks ago of $15.88. The first price target would be $22.59 where some profits would be taken.
From a longer term perspective, you would probably wait for the price to cross that $22.59 level. Here we would see the highest price in the stock since July. But I preferably would at least as a minimum want to see its price trade above its 200 day MA. The good news is that it would be around this price level. But all my comments regarding being a price taker ring true. The good news is that it is a lower cost producer and these things are cyclical. So they will stay in the game longer than most which when the dust settles may prove an opportunity. Its just not this week.
ASX:EGL The Environmental Group Limited
StockRank 90
Momentum Rank 98
QM Rank 98
VM Rank 78
A$0.39
It was noticed that members over the past week were looking at Environmental (ASX:EGL). We last covered the company as at June this year. Members can read that past commentary here

ASX:EGL 1 year Daily chart
Back then we said, “structural support I feel is at $0.245. Traders may feel $0.265 is more appropriate as a stop loss from these levels.” It never got there and has kept going up and as I said, “ultimately what I want to see is a break above $0.34” and it did that and has since continued into the Blue Sky that all-time highs brings. So what to do now?
My previous comments on its size and liquidity remain. Further, there has been no real change in the amount of revenue they receive which is recurring as stated in their Full Year result (though that was to be expected given the big jump in sales this year and their focus of upselling existing clients.) All that aside they expect EBITDA to grow by 25% in the year ahead,though this seems li,e a best guesstimate from here.
As far as the price chart goes, I mentioned that the sky is the limit and it is. On the downside that sentiment may start to change if if falls below $0.345.
ASX:WHC Witehaven Coal Limited
StockRank 57
Momentum Rank 36
QM Rank 42
VM Rank 64
A$7.09
Another stock discussed regularly from a Momentum perspective is Whitehaven Coal (ASX:WHC) which was last covered back in early July.

At that point the stock had created a new short term higher higher and I said it may be worth a nibble back down at around $7.40 and provided it stayed above $6.32 I would be in it.
Well I did just that and it ended up a losing trade as the stock fell to an intra day low of $5.45. But since the announcement of the China stimulus the stock has rocketed up and now is a little above where I sold it. Even the gap created following the stock going ex-div has been gobbled up quickly (oh well) . Problem though is now the stock is well and truly in a short term downtrend following the creation of the new lower low.
Therefore if I was true to my word, and I was not interested in trading the channel, then I would need either the previous higher high to be breached of $8.99, or more likely the stock will go up, pull back, and then create a new higher low. I see no immediate need to rush this trade, particularly given my positive disposition on the business in the past which you can read in my previous postings. Unforfutunately though as a price taker it is at the whim of the commodity cycle, and the state governments that use it as a royalty winner!
Stocks in the Shine Zone
To learn about the Shine Zone and how to use it, you can read it here.
The rules for inclusion in this list are based on those I like to see in a stock before considering a trade in it:
QM Rank above 80
Price is above the 2.5x ATR
50d MA is above the 200d MA
Price is greater than the 200d MA
Market cap greater than $200M
This is a very important point: the “Shine Zone” are rules for possible buying. They are not for holding and/or selling. If a stock falls out of the shine zone, use support levels to set your stops, or instigate a parachute stop if necessary. With markets moving sideways, one expects frequent changes in these lists.
If you feel there is a stock that should be included but is missing please let us know. This is a manual process and occasionally one gets through the cracks
Also look at the market capitalisation and liquidity before making any decisions!
Data is at 28 September and is sorted by the stock code.
Changes from last week
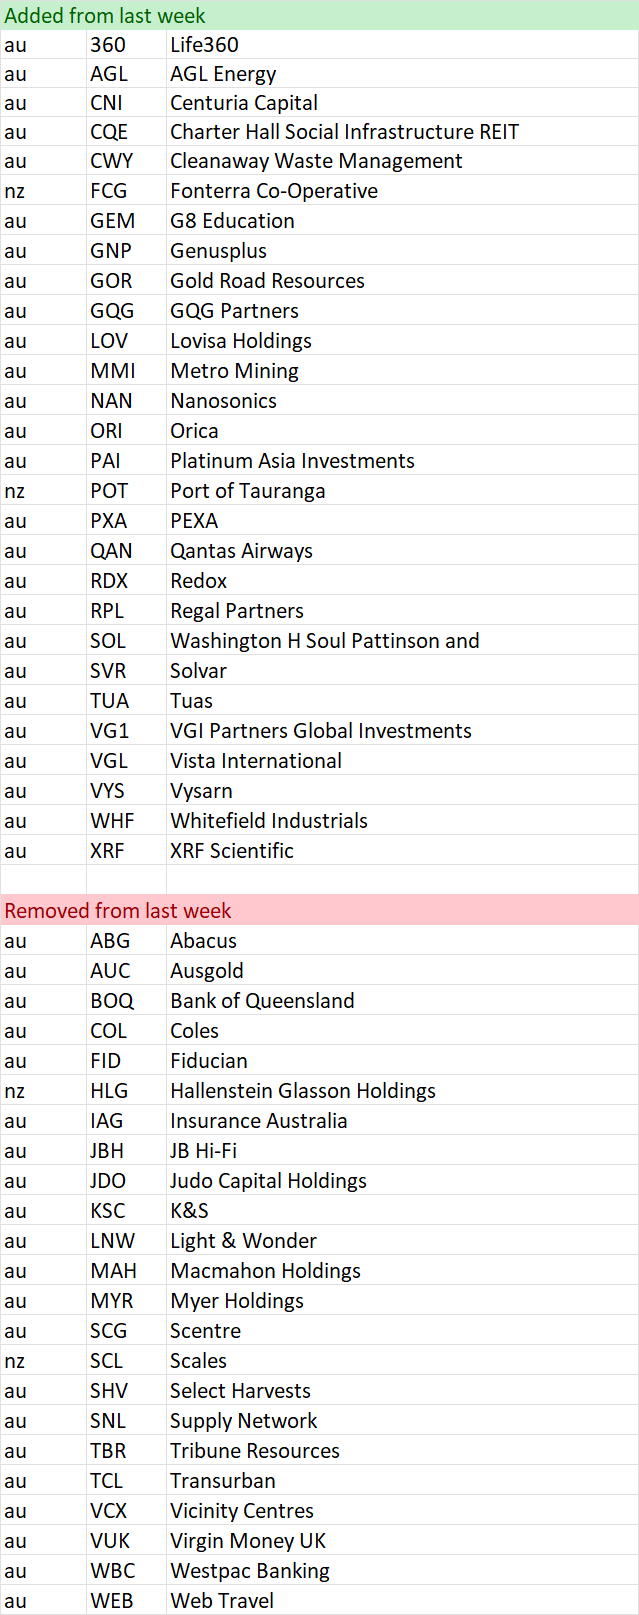
Shine Zone list as at 28 September

Momentum Movers
I have actually published an article discussing my thinking with these tables. You can read about it here.
In summary, there is a school of thought that the change in something is just as important as the absolute number itself. Momentum is our most volatile ranking. This section is intended to bring to readers attention the big moves from a Momentum Perspective. As with other lists this is not designed to be a list of stocks that are replicated. Rather it can be a starting point of investigation for further consideration. Initially it will record weekly changes. This will include a monthly change when enough time has elapsed. This section is divided into two lists.
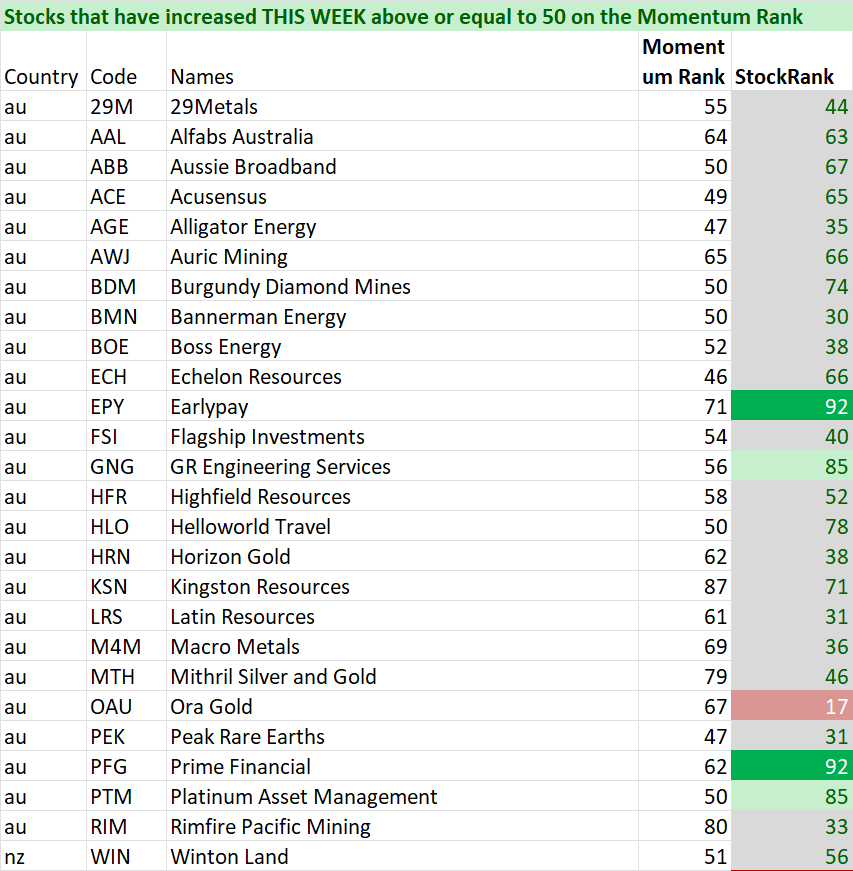
First is a list of stocks that have just crossed above 50 from a Momentum perspective. By definition, these will be stocks that have improved over the past week and month and may warrant further investigation. As a bare minimum a look at liquidity and market cap.
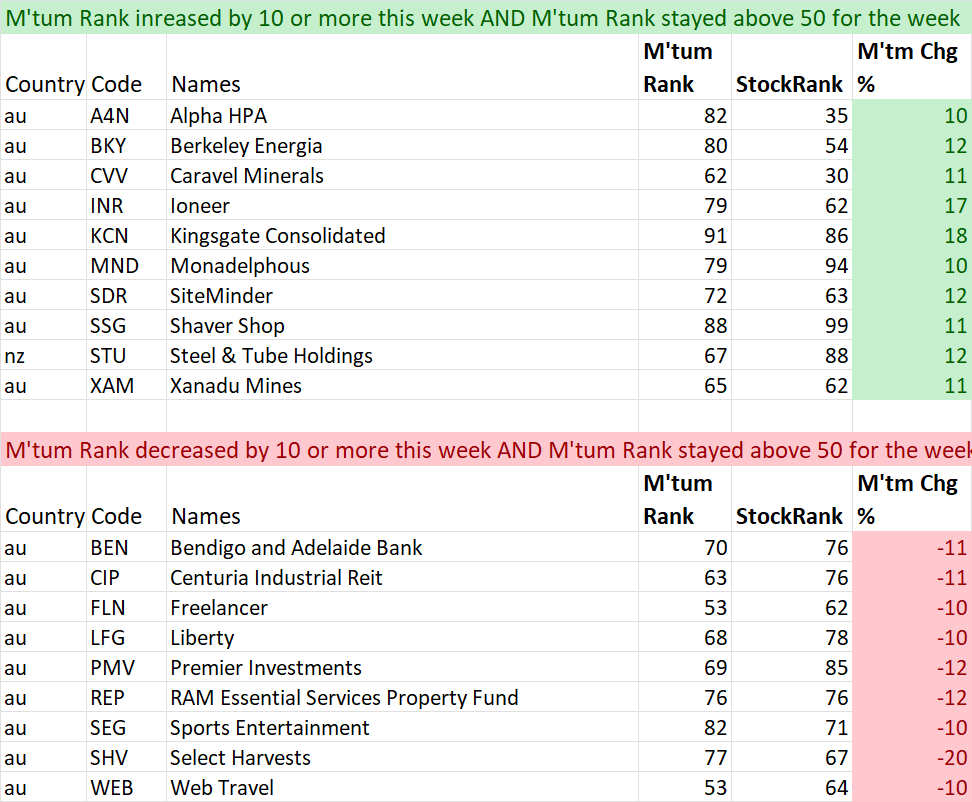
The second list measures all stocks that are currently ranked above 50, have remained above 50 during the time periods analysed (ie not just added or removed) AND whether they have improved or worsened by more than 10 points on the Momentum Rank.
With all filters a minimum market cap of $50 Mil has been included to help ensure investability from a small perspective. Be sure to check liquidity relative to your preferences.
Note: Some of the changes are due to the market cap now rising above $50M. Be sure to double check.
Data is on 28 September and is sorted by their code.
And remember, past performance is no guarantee of future performance.
Weekly Tables (the past week)
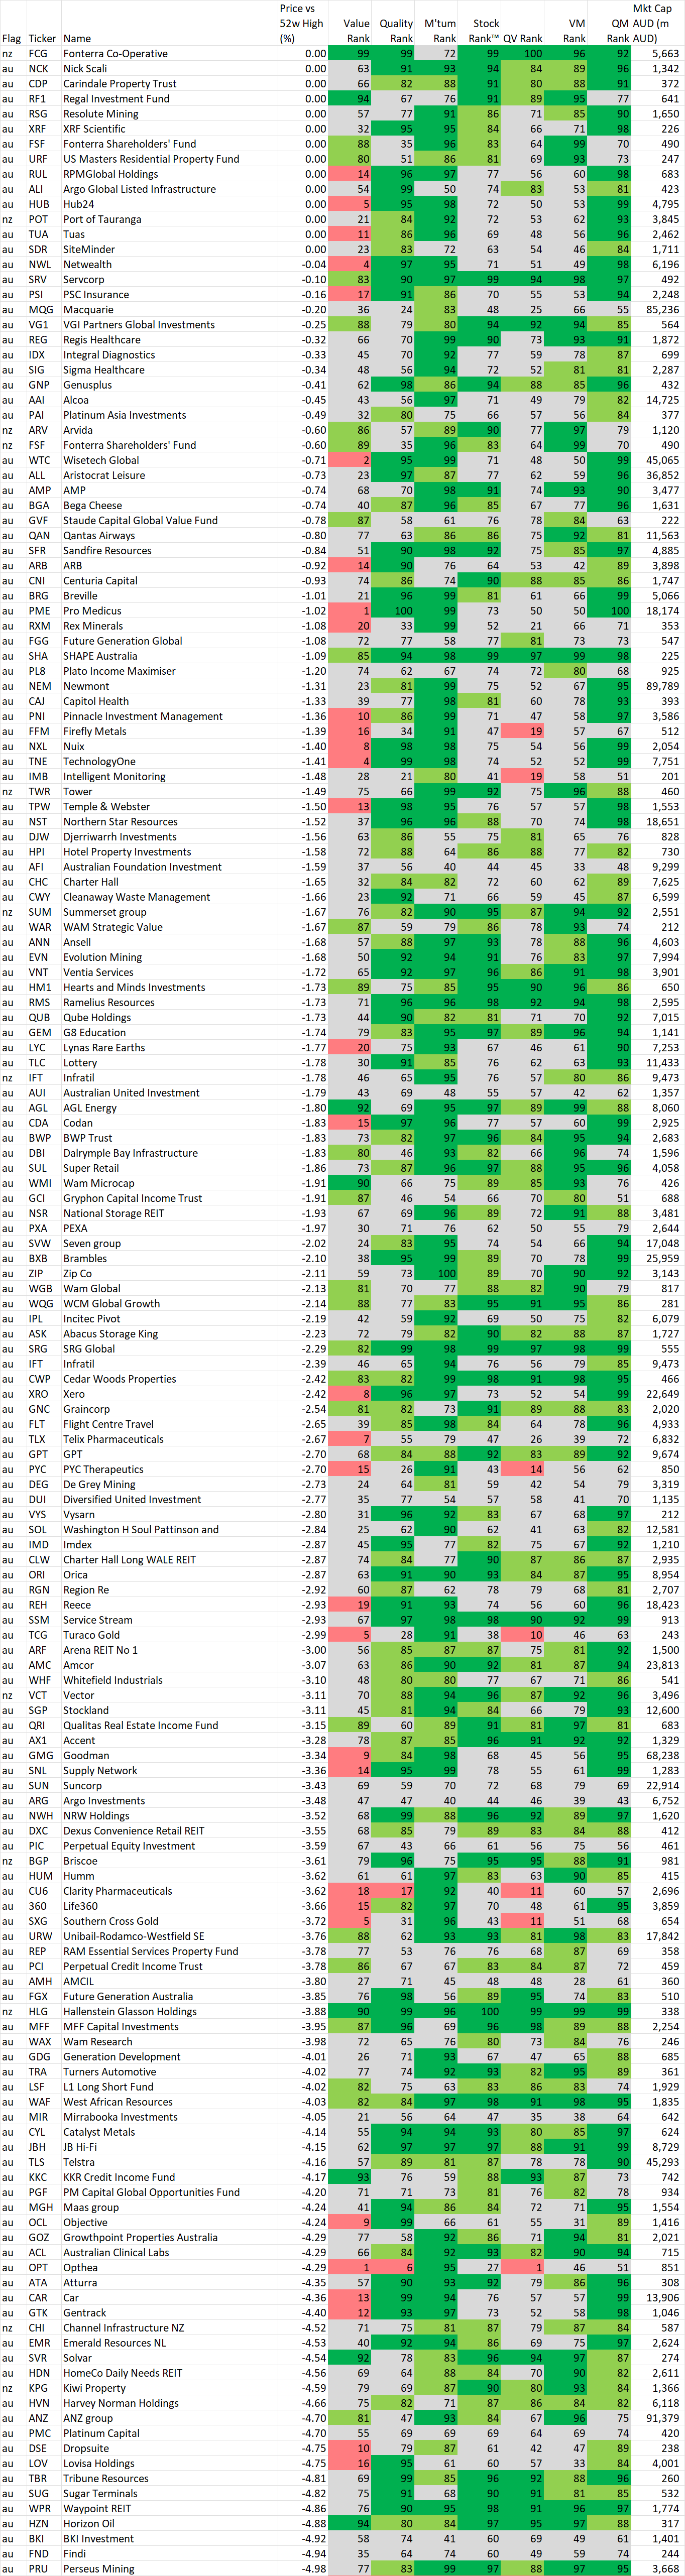
52 week high screen
In this section we identify stocks within 5% of their 52 week intraday high based on the idea, supported by academic studies, that stocks close to their 52 week highs tend to outperform. Weekly changes to the list will also be noted.
If you wish to recreate this screen in the screener select "Price vs 52 high" greater than -5% and Mkt Cap greater than $200M
A stock coming onto the list is NOT an automatic buy, just as a stock that leaves the list is NOT an automatic sell. As with the shine list, assess every chart on its merits. However movements on this list may alert you to interesting charts so be sure to look at Stockopedia and the chart first.
Data is at 28 September and is sorted by the stocks closest to their 52 week intraday high.
Also look at the market capitalisation and liquidity before making any decisions!
And remember, past performance is no guarantee of future performance.
Changes from last week
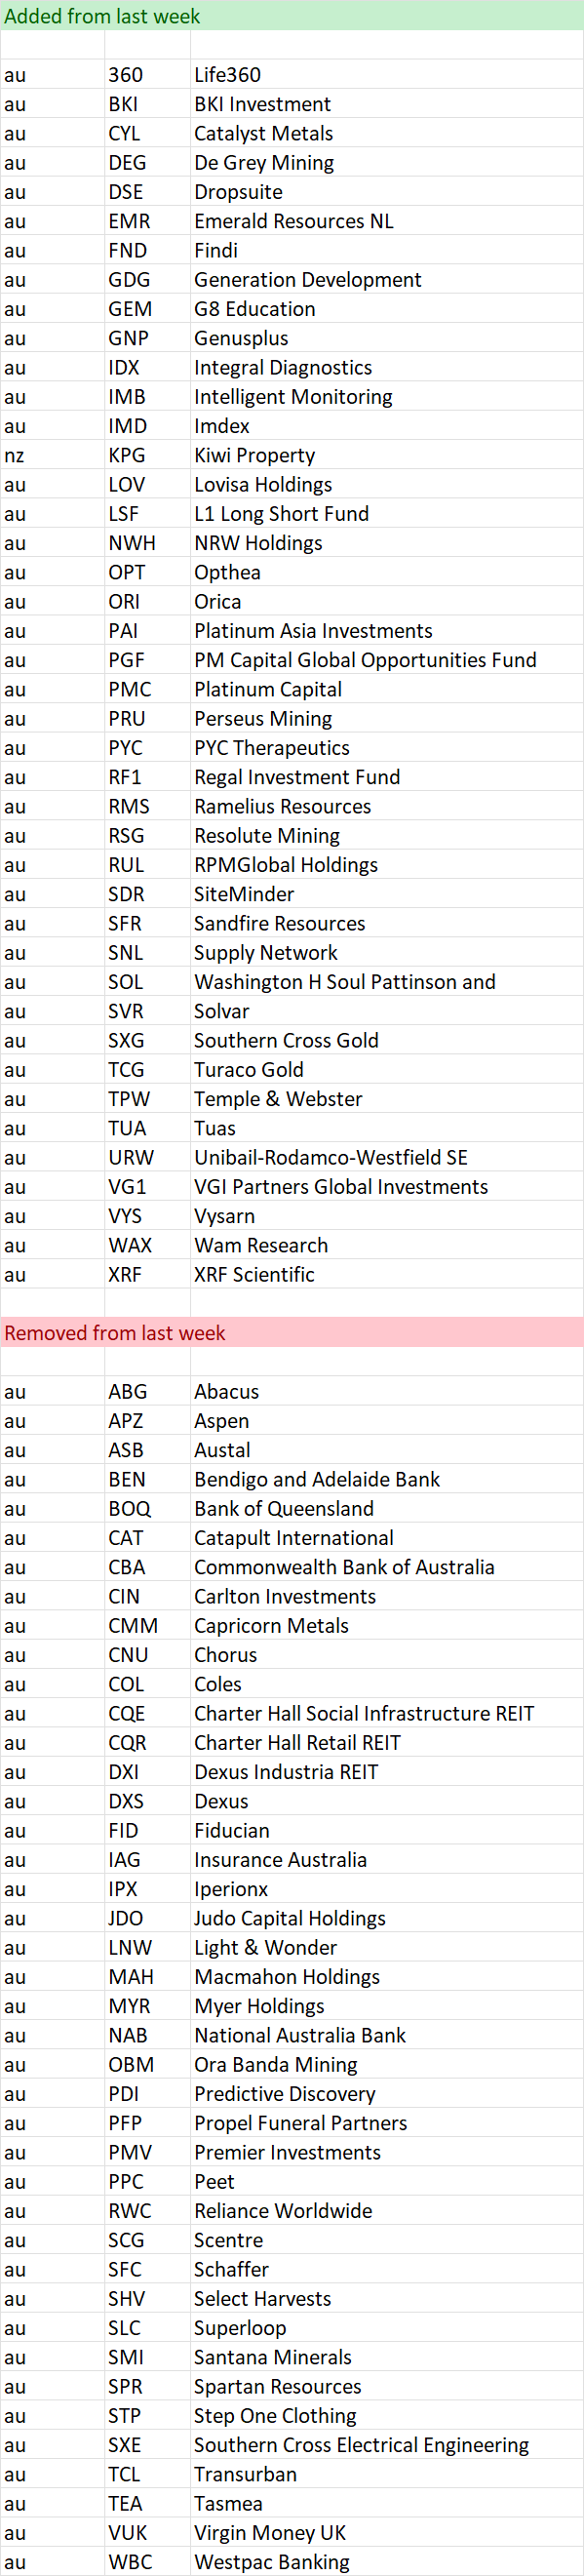
Stocks within 5% of their 52 week high as at 28 September
Important Information: Stockopedia Ltd ABN 39 757 874 670 UK business registration number 0637267 (“Stockopedia”) is an Authorised Representative of Daylight Financial Group Pty Ltd ABN 77 633 984 773 (“DFGPL”) which is the holder of an Australian Financial Services Licence (AFS Licence No. 521404).
Information in this commentary is current as at date prepared unless otherwise stated. However, please bear in mind that investments can go up or down in value, and that past performance is not a reliable indicator of future performance. For more Important Information please refer to the Disclaimer section of this website.
This communication may contain general financial product advice. It has been prepared without taking into account your personal circumstances, and you should therefore consider its appropriateness in light of your objectives, financial circumstances and needs before acting on it.
If our advice relates to the acquisition or possible acquisition of a particular financial product, you should obtain a copy of and consider the Product Disclosure Statement (PDS) before making any decision.
The author holds direct interests in companies listed in the data tables . This position can and will change at any time without notice.
Disclaimer
This is not financial advice. Our content is intended to be used and must be used for information and education purposes only. Please read our disclaimer and terms and conditions to understand our obligations.
No comments yet
No one has commented here yet! Why not be the first one?