Momentum Monday 4th March

Welcome to Momentum Monday.
What a great week to focus on anything ‘but’ the market. I turn my back, and it melts up. I was told never to mistake a bull market for brains” - but I have to tell you it feels nice.
A big hello and welcome to recent new members. In this current climate I would love to suggest the value of Stockopedia is enhanced significantly.The truth is, the value of our service turns up when things are uncertain and we need the surreity that our companies will survive and ultimately, thrive. These times will come again, they always do. At least you have a tool that will be by your side through the ups and downs, and keeping you in control is what we are here for.
Further Chris and I will be here every step of the way.
Interesting links
Weekend Watchlist with Shares for Beginners this week is we talk of a Stock where we have to pay to play its Audinate (ASX:AD8). Listen here to the replay
This coming Friday we have our regular Lunch ‘n Learn session. Register here and remember to bring a virtual plate (or if you can’t make it, book anyway and we will send you a recording.
“Empower Others” referral program Learn more here
There has been a number of external commentary. So follow us on Social Media Facebook Linkedin Instagram or X (formerly Twitter)
This week’s content is as follows:
Broader market sentiment
Member corner
Stocks in the “Shine Zone” (including changes)
Buses pulling out of the station (volume + price movers)
52 week high screen (including changes)
A reminder that you don’t have to read all this contribution. Simply scroll to the area of interest.
Broader Market Sentiment
We look at the direction of both the US and ASX markets to gain an understanding of the broader sentiment at the minute. It is important to stress here that I DO NOT use this to time my entry or exit out of stocks. I prefer to use the individual charts of stocks to do that. However I find it useful in helping us determine how aggressive/cautious traders should be in their trading. In short the more positive the broader market is the more risks you can take and vice versa.
US / S&P500
I open this week’s commentary in exactly (word for word) the same way I started last week, “It’s another record high for the broad S&P500. What more can I say?”

S&P500 Weekly chart
It was even a record for the NASDAQ which surpassed 2021 highs. In a place where opinions are common, there is a sheepish side reference to eventually we have to see a pullback. But that chorus is quietening down.
Inflation numbers were released in the US supporting rate cuts soon rather than later (though forget rates getting down to the emergency levels of COVID). Earnings season has been a good one. On a weekly basis, the Nasdaq added 1.74%, while the S&P 500,advanced 0.95%. Both indexes notched their seventh positive week over the last eight

NASDAQ Composite Weekly Chart
Structurally for those looking for a level where the narrative may change for the S&P500, again I say 4117 is it. But that is unacceptable given current levels. Rather focus on the past high of 4766 achieved in late 2021.
But for now, there is no reason to change my tune (not that it changes much anyway). I am in equities globally.
AUS S&P/ASX200
The marginal close of last week was quickly forgotten, with renewed optimism coming into shares and the market. It closed on record high (at the end February) and rose once again on the Friday to make it positive for the week.

S&P/ASX200 Weekly chart
For the week, the benchmark rose 1.3%, with the strong close on Friday contributing about half of that. If you can't be aggressive now, when can you be? Everything else is surely noise. Well, that is unless your company is engaged in fraudulent activity, or you are just a bad business. Even DMP has bounced a bit over the last two weeks.
On the sentiment front, we are done with the reporting season and overall it is fair to say the market was pleased. After all, if it wasn't… surely we wouldn't be at all time highs? Continued sales growth and cost controls the big issues which emerged (though Margins always are a big deal.) We will be talking more of the reporting season at our coming Lunch n Learn session this Friday (see above how to book)
Macro-wise there was more uncertainty (which at the moment is a good thing) when inflation came in. Stubbornly high, but bang on forecast. So should we care? Especially when we are on the coat-tails of a strong US rally.
The only thing I will say is that if the market rises again, there may be a change in my sentiment stop loss level. But despite that, for now I remain exposed to domestic equities.
Member corner
In this section we will provide a detailed chart assessment, on a maximum of ten stocks weekly, on companies from those of you in the Gallery.
We welcome stock requests to be analysed from members. We will also be looking at the charts of some of the more actively researched stocks for the week. We will try to rotate through a selection so as to not make the charts stale, however we will likely not cover a stock within 2 months of when it was last discussed.
If you want to see what has been written about a stock recently, go to the discussion area.

We will not be making up suggestions. If there are no changes to the most viewed list and/or there are no suggestions from members, then no stocks will be covered.
To learn of the methods used to analyse companies in this section, refer to my Momentum Journey series that I articulate here in three parts.
They will help provide context on what I am writing about and the editorial angle of this report.
Also look at the market capitalisation and liquidity before making any decisions!
And again, if you have a stock you would like analysed from a momentum perspective, please write it into the comments section below or email us at @stockopedia.com.au">support@stockopedia.com.au
IF NO ONE ASKS… HOW AM I SUPPOSED TO KNOW?!?
ASX: SRG - SRG Global
StockRank 93
Momentum Rank 80
QM Rank 88
VM Rank 91
A$$0.77
A member this week has asked about SRG Global (ASX:SRG) after what would appear on the surface an uneventful year.

ASX:SRG 1 year Daily chart
But that would be unfair as the company has been quite active and truth be known, they are approaching an all-time high (that is never boring). Personally I find that chart a little more difficult to pick. What shakes the confidence is the false break we saw in late September, all of October. I would have said this stock has entered a downtrend, but fast forward to today and the market’s positivity has supported the run.
I like this business. (I liked Global Construction Services more - the business they acquired in 2018.) The only problem I have is the market consistently downgrades these styles of businesses over time.
If you look at the company's website and their announcements, it is obvious that their clients are big hitters. The financials also look good when viewing the StockRank score. They will also go ex-dividend this month and the yield is impressive.
From a chart perspective my eye looks to that $0.805 all time high in 2023. I would like to see it eventually breached and then look to buy on a pullback from there. But older investors may point to the long term chart and note the consistent retesting of support in 2022 (around $0.68 - $0.70) that was created following the daily gap at that time.

ASX:SRG 3 year Daily chart
Therefore there is a risk that price retests that level again. The breach in Sep/Oct doesn’t fill me with confidence either, so there is a risk the stock is range bound. I'm going to wait and see what happens this month, but I am looking for a clean break.
ASX: SXE - Southern Cross Electrical Engineering
StockRank 99
Momentum Rank 94
QM Rank 97
VM Rank 99
A$$0.89
A commonly viewed stock this week was Southern Cross Electrical Engineering (ASX:SXE) which also is included in the 2024 NAPS Portfolio. From a Momentum perspective the stock was last discussed in September last year. I said the buy zone would be about 75,5 - 76 cents. A level it hit two weeks later, and has been running ever since.

ASX:SXE 1 year Daily chart
This stock is in an uptrend, though it’s not so clear at this stage what happens next. The activity of the last few weeks introduces the possibility of a double top (where two similar peaks occur at similar times). Often this can be a possible reversal pattern and the target would be 79 cents if that was the case.
Pleasingly that would see the price stay above (or very close) to the 200d MA. Therefore there may be better buying at around this lower level. AS always a parachute stop needs to be set post getting in. Structurally, that price is $0.82 therefore a retrace back to here may be sound as it coincides with other significant levels (as discussed).
Of course the price could do the opposite and create a new high continuing the uptrend.
If I was holding now my stop would be $0.89
ASX: SGF - SG Fleet
StockRank 92
Momentum Rank 98
QM Rank 83
VM Rank 99
A$2.77
Another stock requested is SG Fleet (ASX:SGF). This will be the first time we talk about it from a momentum perspective, though Chris did write about it in February 2023. The drivers of fleet management and salary packaging businesses haven’t changed much since then (is they have been good) though some investors may query that looking at SGF’s share price

ASX:SGF 1 year Daily chart
Again another very interesting chart. On a short term basis the stock has broken the range, and therefore is in an uptrend. If I play the role of scrooge here (and it doesn’t make much of a difference) longer term investors could wait for a break above $2.94 (the high of early 2022)

ASX:SGF 3 year Weekly chart
But what can’t be denied is the long-improving pattern which has been taking place since the COVID lows. A series of higher lows is promising, and whilst an ultra conservative trader may wait for a break above $3.0, to confirm the downtrend is over,the fact it is seeing life return at this time has to be a good thing and I couldn’t fault anyone from being more aggressive
To me, current support structurally is at $2,25, my parachute stop would be tighter.
ASX: ACF - Acrow
StockRank 89
Momentum Rank 82
QM Rank 91
VM Rank 82
A$1.28
We last spoke of Acrow (ASX:ACF) from a Momentum perspective last year in September. You can reacquaint yourself with the commentary here

We talked of how it would have been appearing on people’s screens given its qualities and a good yield.
We said the chart was up, so “Thinking less, making more money” we were in. We said the price had to hold $0.79 short term, $0.73 long-term. Fast forward to today and the price is still up. Further, both those levels held, and at $1.22 today this has been a good trade.
So given the buy commentary is the same, on the sell side I see $1.08 as structural support for short term traders, $1.03 for longer term
ASX:LAU Lindsay Australia
StockRank 97
Momentum Rank 78
QM Rank 92
VM Rank 92
A$1.075
A stock which was also included in the NAPS 2024 for a second consecutive year was Lindsay Australia (ASX:LAU) . But from a Momentum perspective it has not been talked about since November last year. You can read that commentary here This excludes a discussion on the fundamental qualities of the business that you can read at your own leisure.

In it, we pointed to a comment in September and nothing had occurred which changed that view. Fast forward to today and unfortunately again, nothing has changed that view either, particularly as the stock has tracked sideways.
I feel that either the creation of a new short term higher high or lower low will do much to provide an indication of where this business may be headed price wise. Until then, the company continues to sit on the precipice, and we await some clear direction.
ASX:DRO DroneShield
StockRank 44
Momentum Rank 61
QM Rank 65
VM Rank 31
A$0.685
Members of the old Spotee Connect will remember DroneShield (ASX:DRO) as we had the CEO Oleg Vornik in the program talking about his business. Now within the confines of Stockopedia, this is the first time we are talking about the company from a Momentum perspective.

At the time of the interview, the conflict in the Ukraine was making its way to our airwaves and we covered a range of issues including how the current situation would aid the business (all tough to do in hard times).
The stock had a run, but then a strong resistance level of $0.42 was formed from the peak in early 2023. That was until an upbeat presentation and the fact the company achieved its first profit in its history has seen it take off again.
For many after such a strong run the previous resistance turning into support at $0.42 cents would not be acceptable and after such sharp runs, stocks need to take a breath as they have the last two days. This is further compounded by the fact that it is a story stock, I always have tight stops on stocks like this and watch them if I am out of them to keep an eye on what is going on.
For those looking for a structural level of support from here I would say $0.65 which coincides with the low in mid February. Other than that the behaviour of the price reflects that of a thematic stock. What Oleg and the team will have to prove to keep the price around here is that the run is sustainable moving forward.
ASX: HCL - Highcom
StockRank 58
Momentum Rank 09
QM Rank 32
VM Rank 56
A$0.15
A stock like Highcom (ASX:HCL) (formally Xtec) that had an all time in 2019, and is currently trading at all time lows is generally not a stock we like on Momentum Monday, but there are good lessons here.

The first is that the price hadn’t been above the ATR this year. Further with the exception of a respite later on in the 2023 calender year, the stock spent most of 2023 trading below the 200d MA. But the clincher is the stock has been in a downtrend from its highs in early 2023.
I am not going to enter a discussion at this point as to what was said, and ultimately what was delivered. Though the gap down on 13th Feb 2024 to all time lows tells me that this result was a big miss.
The microcap nature of the stock also means I don’t feel charts work as well with such companies. But there are significant problems here that the market has cottoned onto it, and it is going to take a lot to restore the faith.
Stocks in the Shine Zone
To learn about the Shine Zone and how to use it, you can read it here.
The rules for inclusion in this list are based on those I like to see in a stock before considering a trade in it:
QM Rank above 80
Price is above the 2.5x ATR
50d MA is above the 200d MA
Price is greater than the 200d MA
Market cap greater than $200M
This is a very important point: the “Shine Zone” are rules for possible buying. They are not for holding and/or selling. If a stock falls out of the shine zone, use support levels to set your stops, or instigate a parachute stop if necessary. With markets moving sideways, one expects frequent changes in these lists.
If you feel there is a stock that should be included but is missing please let us know. This is a manual process and occasionally one gets through the cracks
Also look at the market capitalisation and liquidity before making any decisions!
Data is at 02 March and is sorted by the stock code.
Changes from last week
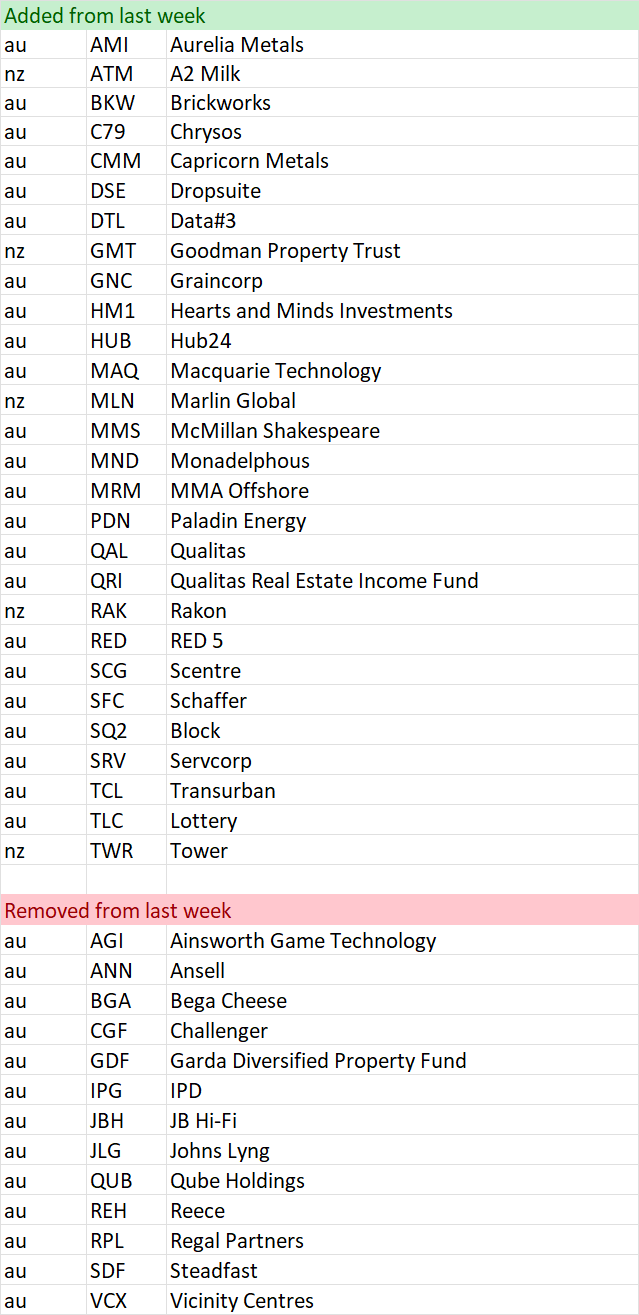
Shine Zone list as at 02 March

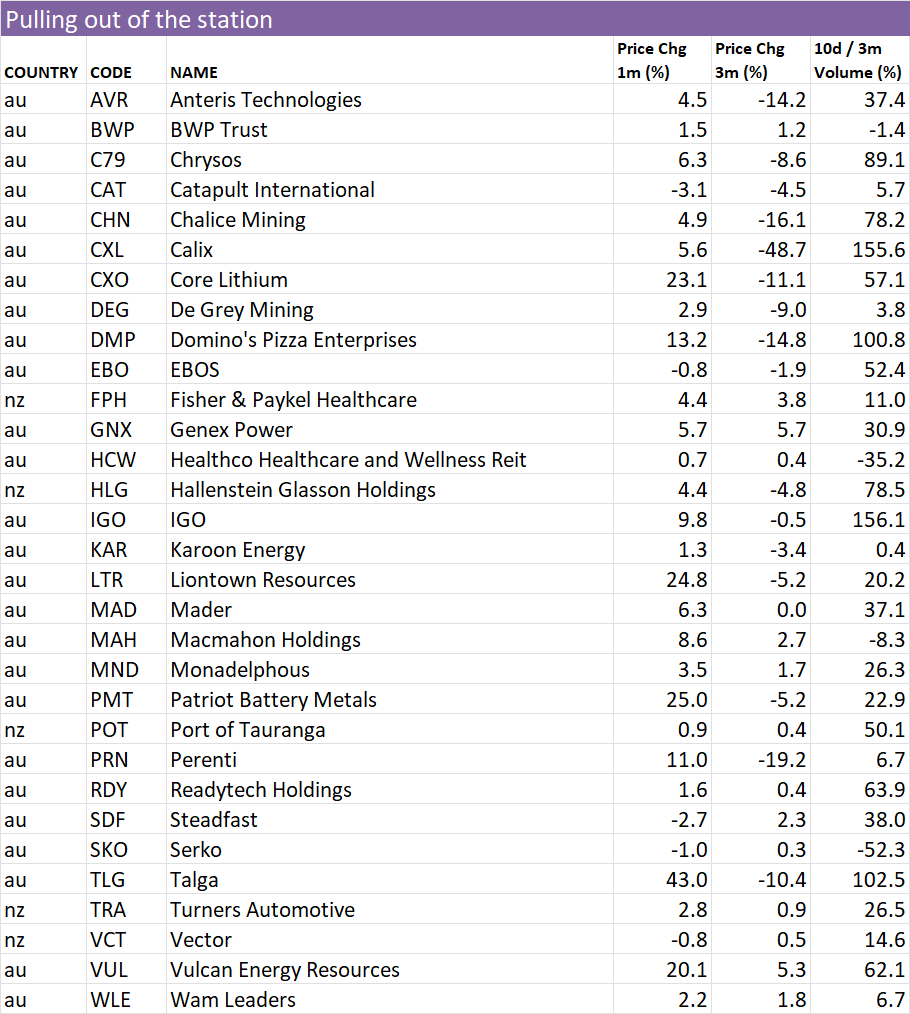
“Bus pulling out of the station”
To learn more about this screen read the following article on the objective of the screen
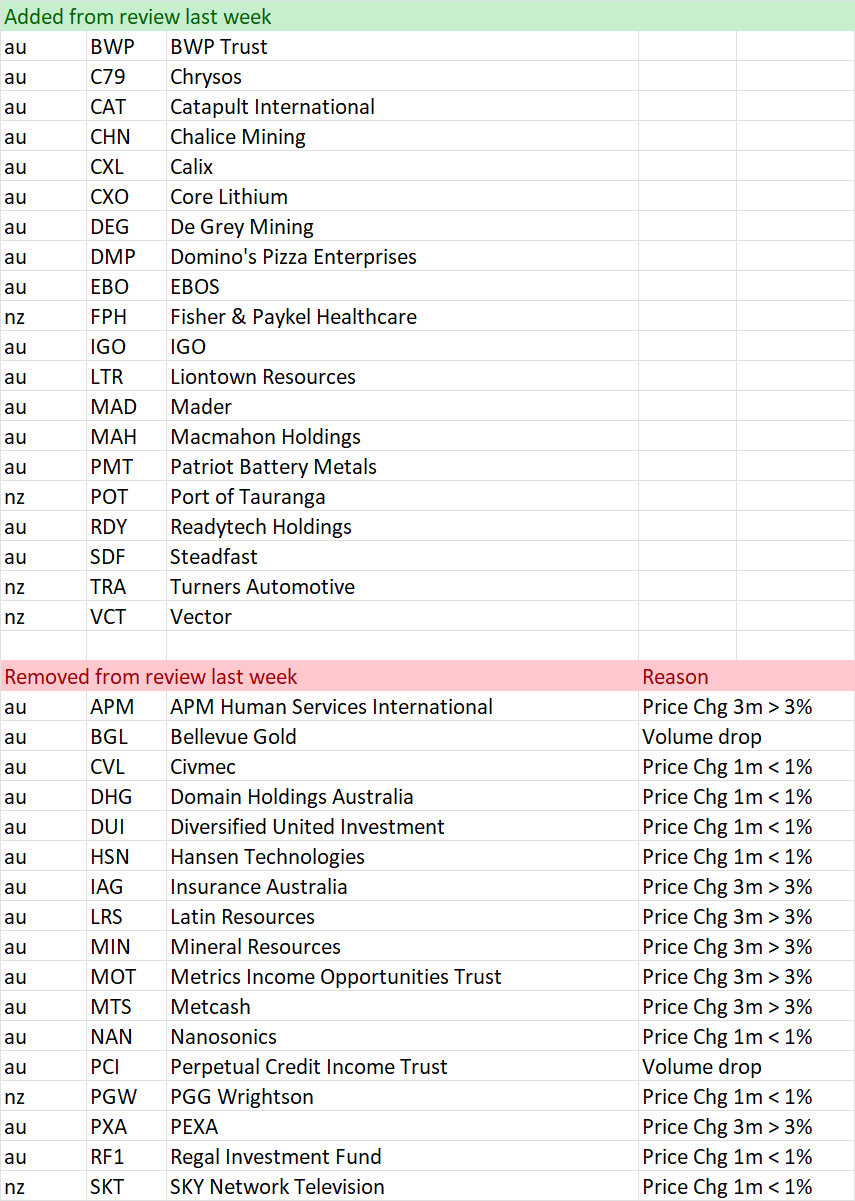
Here is a shortcut in understanding the reasons why a stock is removed:
Volume drop = Bus might be moving, but no one is on it
Price 1 mth < 0% = Bus has been cancelled
Price 3mths >= 3% = Bus has pulled out of the station
Also look at the market capitalisation and liquidity before making any decisions!
Data is at 02 March and is sorted by the stock code.
Changes from last week
“Pulling out of the station” on 02 March
52 week high screen
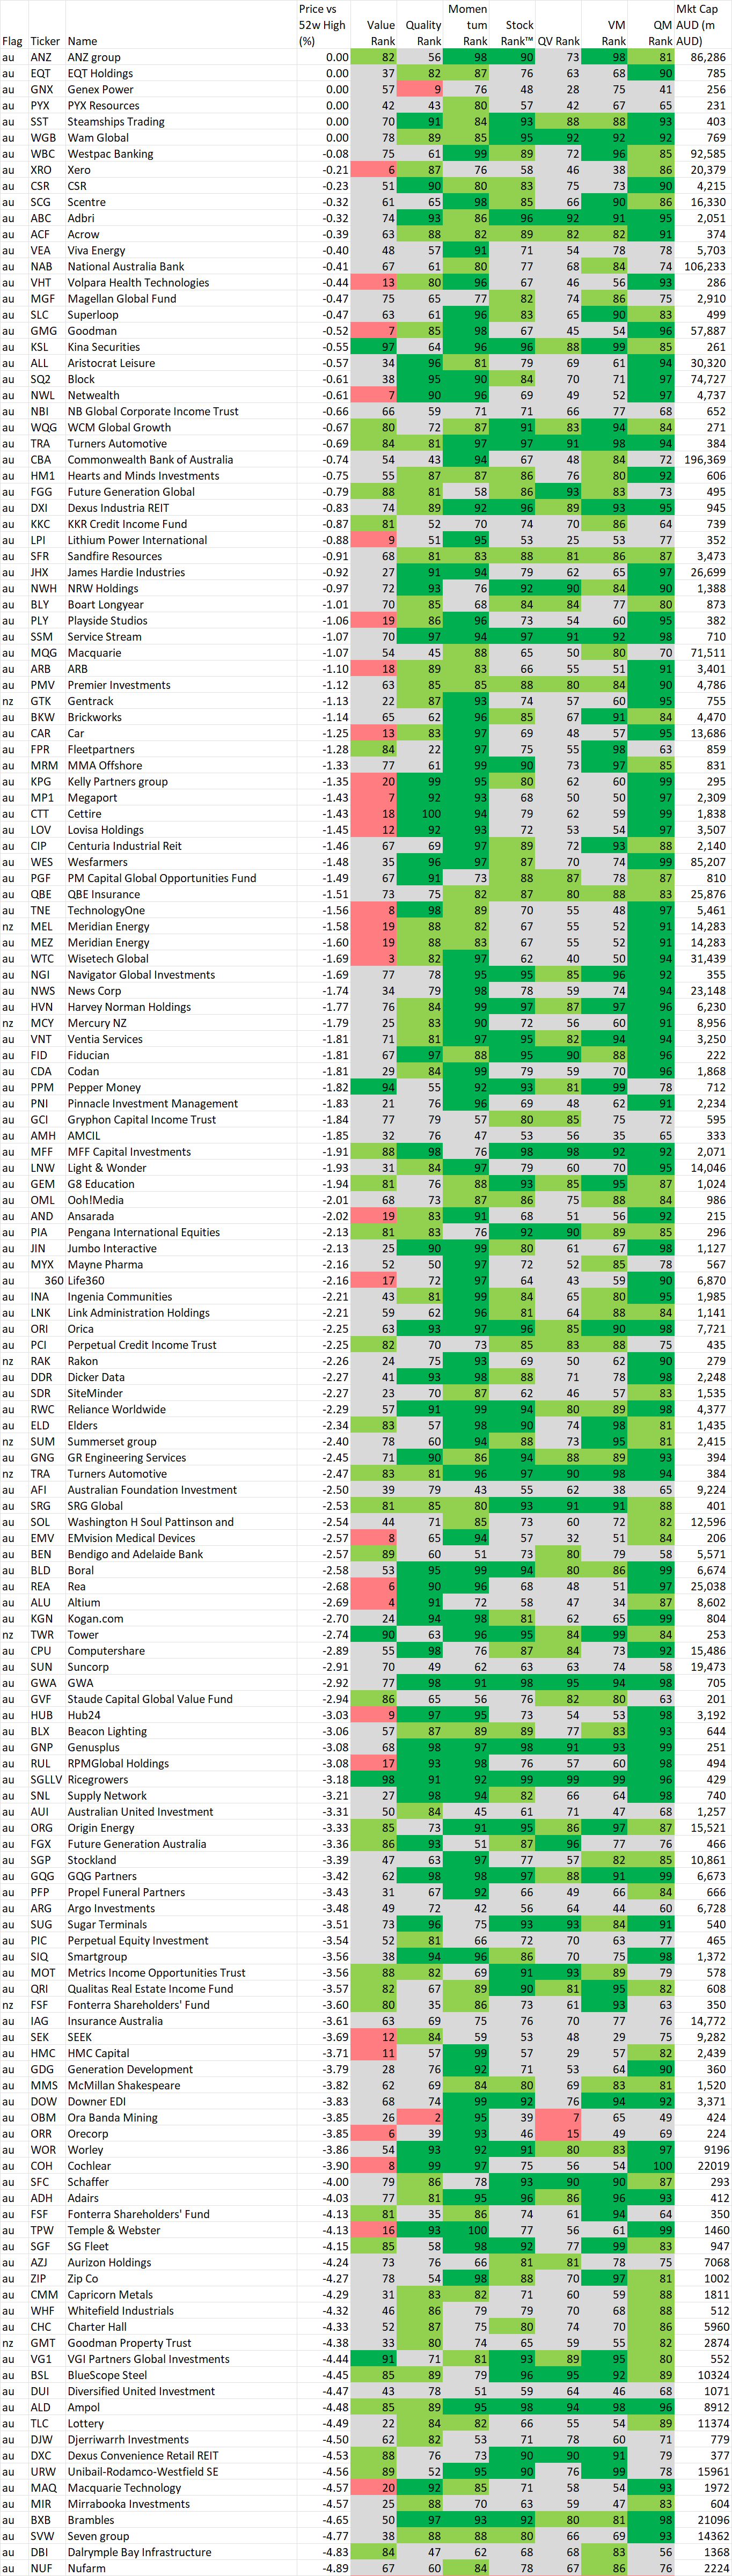
In this section we identify stocks within 5% of their 52 week intraday high based on the idea, supported by academic studies, that stocks close to their 52 week highs tend to outperform. Weekly changes to the list will also be noted.
If you wish to recreate this screen in the screener select "Price vs 52 high" greater than -5% and Mkt Cap greater than $200M
A stock coming onto the list is NOT an automatic buy, just as a stock that leaves the list is NOT an automatic sell. As with the shine list, assess every chart on its merits. However movements on this list may alert you to interesting charts so be sure to look at Stockopedia and the chart first.
Data is at 02 March and is sorted by the stocks closest to their 52 week intraday high.
Also look at the market capitalisation and liquidity before making any decisions!
And remember, past performance is no guarantee of future performance.
Changes from last week
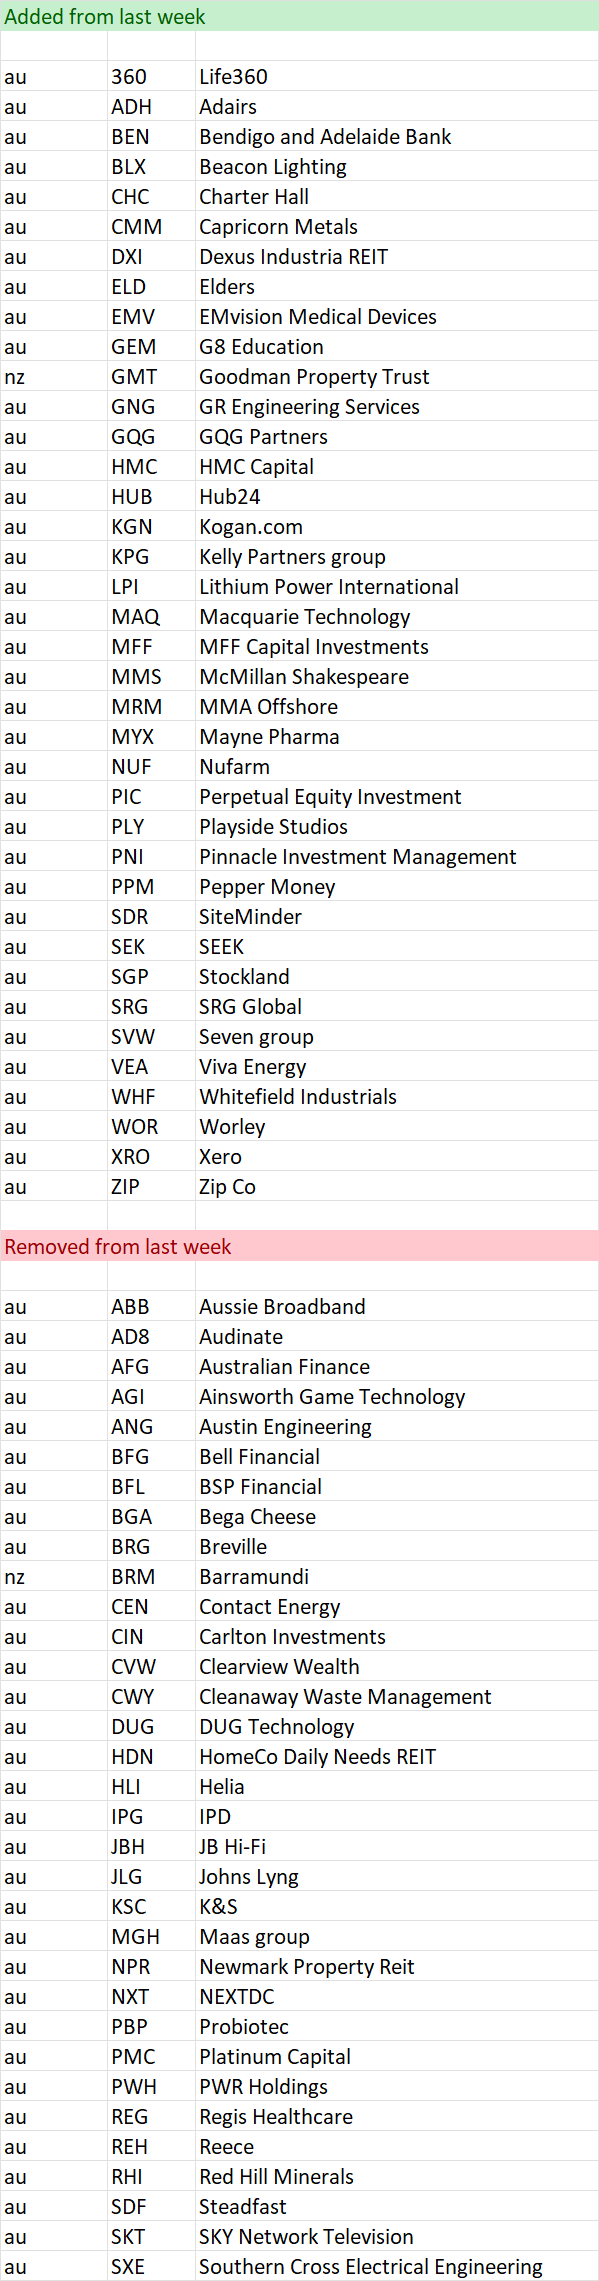
Stocks within 5% of their 52 week high as at 02 March
Important Information: Stockopedia Ltd ABN 39 757 874 670 UK business registration number 0637267 (“Stockopedia”) is an Authorised Representative of Daylight Financial Group Pty Ltd ABN 77 633 984 773 (“DFGPL”) which is the holder of an Australian Financial Services Licence (AFS Licence No. 521404).
Information in this commentary is current as at date prepared unless otherwise stated. However, please bear in mind that investments can go up or down in value, and that past performance is not a reliable indicator of future performance. For more Important Information please refer to the Disclaimer section of this website.
This communication may contain general financial product advice. It has been prepared without taking into account your personal circumstances, and you should therefore consider its appropriateness in light of your objectives, financial circumstances and needs before acting on it.
If our advice relates to the acquisition or possible acquisition of a particular financial product, you should obtain a copy of and consider the Product Disclosure Statement (PDS) before making any decision.
The author holds interests in ACF and other companies listed in the data tables . This position can and will change at any time without notice.
Disclaimer
This is not financial advice. Our content is intended to be used and must be used for information and education purposes only. Please read our disclaimer and terms and conditions to understand our obligations.
5 comments
I'd be interested in your comments on EBOS (ASX:EBO) from a momentum perspective. I'm considering an entry on a break of $35.
Thanks also for the reviews of SRG and SXE, the chart based analysis is not my area of expertise but adds to my knowledge of these holdings.
I have been watching my holding in Mader (ASX:MAD) gently softening over the past several weeks which appears to run counter to its continuing strong performance. Is this a general concern in the resources sector or does it have a specifically MAD component?
Are there significant competitors in its space?Supply Network (ASX:SNL) seems to have continued to advance and I surmise that it may in some areas compete with MAD but I find it difficult to get the “feel” of these trends from the UK
What news on Shaver Shop (ASX:SSG) ? Thanks...
If you haven't already, you may like to.listen to the results briefing https://event.choruscall.com/m...
To me it seems like a great business at a good price. Management certainly sounds upbeat regarding the company's prospects.
Their goal is to achieve $1 billion in revenue by FY26. At current growth rates, it's hard to see them not hitting this mark earlier.
Not sure why the share price is going sideways either. I may top up when it hits the bottom of the current channel.