Momentum Monday 4th November 2024

Welcome to Momentum Monday.
It's two consecutive down weeks for the main indices we cover and it would look on the surface there is more to talk about. Issue is the talking points have literally been around for months (if not years). Therefore again, it is a timely reminder that we will move once the chart tells us too, because trying to predict an outcome not just in reality, but then in price moves, is a fools gold in my view.
Finally "Good Luck" if you try to pick a winner on Tuesday. But just remember the more horses running the juicier the odds, but the harder it is to pick a winner. It's just maths.
Interesting links
Shares for Beginners this week looks at a Gold Miner who is also in our NAPS portfolio for 2024 . It's RSG Resolute Minerals Click here to be taken to the link of the recording.
It’s a new month after a negative one in October, so I implore with you all to “Empower Others”. Our offer to your friends, colleagues and family members is better than what they will get on Black Friday. It is simply our best ever rate. If you think there is someone who will benefit from this offer, please reach out and we will send you the link.
For any external commentary we make to the broader market, follow us on Social Media Facebook Linkedin Instagram or X (formerly Twitter) Some of you already have so ‘Thank You’ for that.
If you haven’t already signed up to Podbean or your favourite streaming channel to receive our morning ASX market reports. (Assuming you know what I even mean)… Click here to signup for it - Signing up for Podbean is the quickest way you will get it.
This week’s content is as follows:
Broader market sentiment
Member corner
Stocks in the “Shine Zone” (including changes)
Momentum Movers (both weekly and monthly)
52 week high screen (including changes)
A reminder that you don’t have to read all this contribution. Simply scroll to the area of interest.
Broader Market Sentiment
We look at the direction of both the US and ASX markets to gain an understanding of the broader sentiment at the minute. It is important to stress here that I DO NOT use this to time my entry or exit out of stocks. I prefer to use the individual charts of stocks to do that. However I find it useful in helping us determine how aggressive/cautious traders should be in their trading. In short the more positive the broader market is the more risks you can take and vice versa.
US / S&P500
Notwithstanding the positive close on Friday, it was the second consecutive down week for the index, after what was also a tough October, particularly following the sell off the day before.
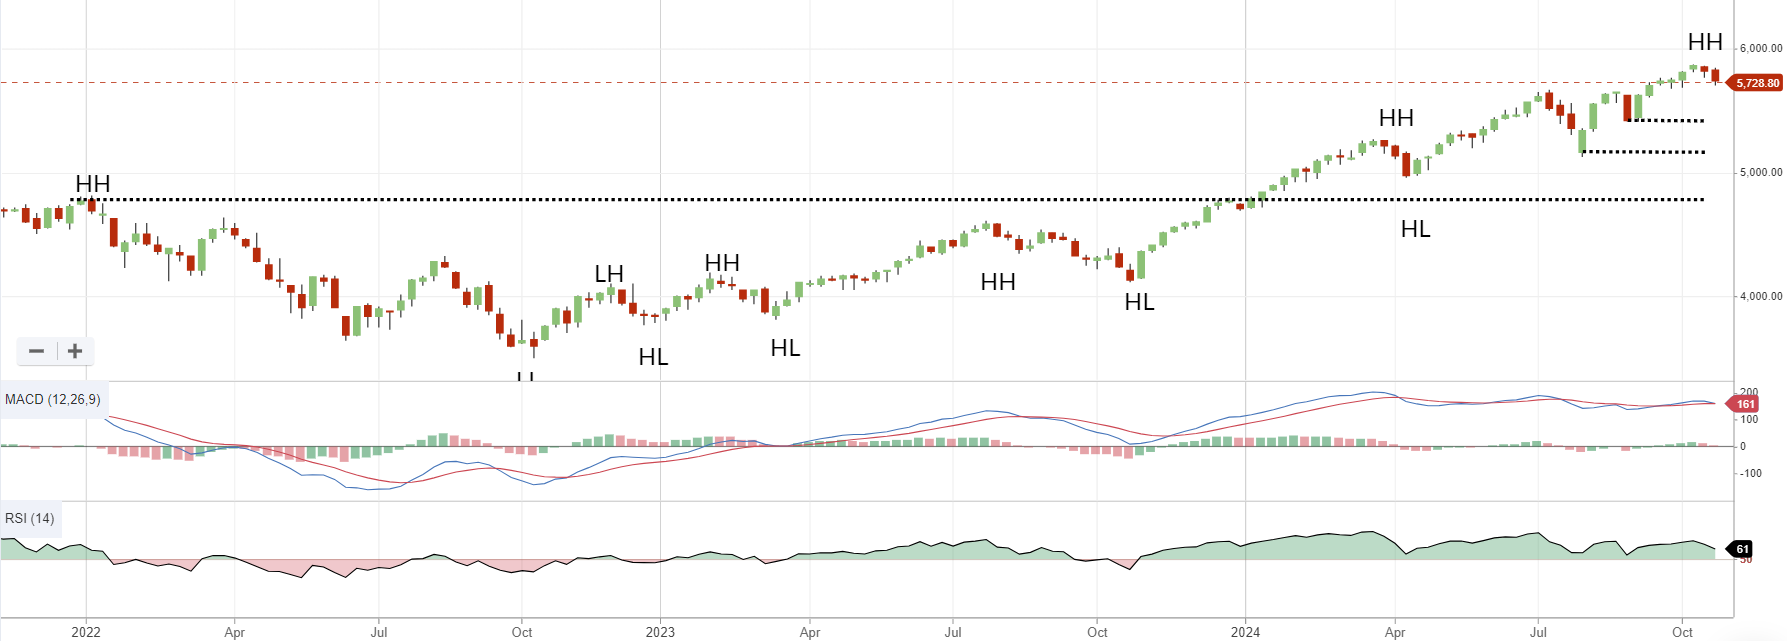
S&P500 Weekly chart
For the record, the broader S&P500 lost about 1.4% over the week. It was down about 1% for the month. Much of that negativity was captured on Thursday 31 October, where the market gapped down a little. Excluding the price move on Halloween the US market was up for the month. Hopefully we won't start hearing about how risky the day is for traders because of it. (Actually I still haven't figured out why the day is celebrated as much as it is???)
On the sentiment front it feels like we are now all waiting for the outcome of the US election that the Polls have on a knife edge. But I think it is a cautionary reminder to us all that “It doesn't matter who wins,” Regardless of the outcome, our trade with the US is minimal and their market is at an all-time high under the stewardship of our oldest ever elected President… and he is a Democrat. So don't make the mistake of altering your portfolio to suit an outcome… I hate to be brutally honest… but it just won't affect us as Australians beyond commanding much of the media headline space.
It was our busiest week of the quarterly reporting season for the S&P500 with over 160 companies reporting, including 5 of the “Magnificent 7” stocks. I know it would appear that a lot of attention is given to these mega cap businesses but there is a reason for it. The S&P500 (as is even the S&P.ASX200) is a market cap weighted index. This means that the companies in it are weighted by their market capitalisation, resulting in larger companies having a more significant impact on the index's movements than smaller ones. Hence why the focus seems to be always on the larger cap stories.
On the macro front we got a read on some GDP figures for the September Qtr and we read that the world’s largest economy grew by 2.8% which was slightly less than expected but at least it is going the right way. Again, jobs data out of the US was also somewhat mooted with only 12,000 jobs created, however again… it is moving in the right direction.
What is also going the right way is the price of Gold which rose further to record highs during the week. While US$2,800 per ounce is not to be sneezed at,,the journey here has been just as impressive. That said, as we have been consistently reminding investors who will listen, being invested in a miner is not the same as holding the physical commodity in itself as it carries more risks. For that you want increased rewards and we have seen that with a number of stocks outperforming the commodity in recent times, but it is a double edged sword and could go the other way. Investors must be aware of operational, currency and all other associated risks at all times.
Oil prices took a bit hit at the start of the week as news emerged that Iran was sedate in its response to Israeli airstrikes that are said to have deliberately avoided major Iranian oil fields. The was even talk starting to emerge that OPEC+ may reverse it's decision and keep production halts on for longer than first thought. Oil prices saw a bit of a rebound on that news, but overall it is still in a downward trend.
Back to the idea of stereotypes and conspiracy theories, the Governing Labour Party in the UK have just passed an additional £40 billion package of tax increases in their budget, which is designed to lift taxation as a percentage of gross domestic product to a record 38.2 per cent. You couldn’t say you didn’t see that coming.
The trend remains up despite the down week. A solid Friday did help settle the nerves. And I still wait for a breach below 5408 before I position myself differently.
AUS S&P/ASX200
It was another down week for the S&P/SAX200. Though it looks like the market is behaving normally, there are some turn-arounds in the chart.There is no need to overreact just for the moment. But we can see these things coming so it is best to share.

S&P/ASX200 Weekly chart
The signs to watch that I talked about earlier (c’mon, let’s face it… it’s what captured your notice first) is that MACD is about to see its moving averages cross. And the RSI is heading to the 50 point (which is sign of positivity if it remains above that,and vice versa)

MACD and RSI in 2024
But before we get too excited, the MACD has whipsawed before and we still got to all-time highs. Further the Weekly RSI this year has not fallen below 50 therefore there is no need to panic yet. (Coincidently the MACD Moving Average Crossover has never fallen below the “0” point, also indicating a continued positive trend overall.)
Hence why I feel the market is behaving normally. But as I have said many a time when it comes to investing, “never say never.”
Actually for the month of October we were down -1.3%, but no matter. It still felt positive and there were particular points of value that I hope you were all able to benefit from (assuming you were.) For the week however we were down -1.13% with much of that to do with Wednesday through to Friday.
We actually received inflation numbers for the September quarter and while the headline rate of 2.8% looked impressive, it was quickly picked apart as being lead by the failing price of petrol and an electricity rebate that we all received. Core inflation – the Reserve Bank of Australia’s preferred measure as it excludes some more volatile items – gained 0.8 per cent quarter-on-quarter, meaning the measure cooled to 3.5 per cent, which though it was in line with expectations, is above the target 2% - 3% range. The net sum of all this talk is that it is unlikely that we will see a rate cut until sometime next year.
While the US election commands much of the headlines, what affects us more is what occurs in China, and it was pleasing to see tht manufacturing activity rose to 50.3 in October from 49.3 the previous month. A greater than 50 result in the index (in this case the Caixin PMI) shows a slight expansion which came as a nice surprise given estimates were for a tiny contraction this month. Further, it leaves the impression in some eyes that the stimulus engaged by the Chinese government is actually working. This includes reports this week that I read that said the Chinese Central Government had this month put in 500 Billion Yuan (US $70 Billion) via a mechanism that allowed companies to use their less liquid assets as collateral in exchange for highly liquid assets such as treasury bonds and central bank bills.
While some may argue that this is just ‘kicking the can down the road’, particularly given the continued property market downturn and record-low consumer confidence, its impact here was significant as the Materials sector did an about face on Friday and went from starting Negative to finishing Positive for the day (and week)
I am still watching 7547 for the ASX/S&P200, and I remain quite aggressive in the markets. But I stress again that markets move in zig and zags, therefore in my view this is the market behaving normally. But the length of the zag has not yet been determined.
Member corner
*Note: We were aware of an error which emerged in the service where it was displaying UK stocks instead of Australian stocks. We hope to have this rectified soon. We apologise for any inconvenience.
In this section we will provide a detailed chart assessment, on a maximum of ten stocks weekly, on companies from those of you in the Gallery.
We welcome stock requests to be analysed from members. We will also be looking at the charts of some of the more actively researched stocks for the week. We will try to rotate through a selection so as to not make the charts stale, however we will likely not cover a stock within 2 months of when it was last discussed.
If you want to see what has been written about a stock recently, go to the discussion area.

We will not be making up suggestions. If there are no changes to the most viewed list and/or there are no suggestions from members, then no stocks will be covered.
To learn of the methods used to analyse companies in this section, refer to my Momentum Journey series that I articulate here in three parts.
They will help provide context on what I am writing about and the editorial angle of this report.
Also look at the market capitalisation and liquidity before making any decisions!
And again, if you have a stock you would like analysed from a momentum perspective, please write it into the comments section below or email us at support@stockopedia.com.au
IF NO ONE ASKS… HOW AM I SUPPOSED TO KNOW?!?
ASX:WDS Woodside Energy Limited
StockRank 95
Momentum Rank 78
QM Rank 88
VM Rank 92
A$24.05
I keep dismissing it, yet it keeps coming up. It is Woodside Energy (ASX:WDS) and it has been two months since we discussed it from a momentum perspective. (Read it here.)

ASX:WDS 1 year Daily chart
For a long time I have said I see structural support at $20. Unfortunately the price keeps getting closer to there. It ended up making the lower low on September 11, 2024 and has bounced a little since. But it is still clearly in a downtrend just like the commodity it extracts.
I still say it is a clear avoid. I still say I won’t look at this business until it gets closer to $20 or rises above $39. It would seem that the former is more likely. Though there is still a bit to play out yet on the chart. For those with itchy fingers (and there must be a bunch of you given it is looked at so frequently by mani of you) a sustained break above $26.64 is what you are looking for.
ASX:RSG Resolute Limited
StockRank 89
Momentum Rank 95
QM Rank 92
VM Rank 88
A$0.795
Resolute Mining (ASX:RSG) is one of our NAPS stocks in2024, however from a Momentum perspective it has been discussed before and you can read it here. You can also hear about it in the recent Weekend Watchlist (link is above.)

ASX:RSG 1 year Daily chart
With the Gold price at record high levels and in the latest quarterly the company confirming that AISC are at $1,452/oz, this means there is a lot of profit to be had. Provided of course you can stomach the fact it is based out of Africa.
On the chart the stock had a good day when it released its full year result. Notwithstanding AISC coming in at the top end of guidance, the company shared more plans on its Mako expansion and inevitable coming online of their Guinea (Mansala) operation to commence at the end of this year.
From what was said last time, I flagged at that point that 49 cents was support level and that for short term traders if you weren’t holding them yet, you should look for a cross above 66.5 cents and even if you wanted to wait you could see a longer term at 74 cents. Now that the price has breached those levels, with a rising cash balance, and with solid production upside my upper target of $1.35 comes into play and for those with the risk appetite “Congratulations!”
From here, aside from any parachute level you may set yourself, structurally I see support on the downside at 0.665-0.685 range.
ASX:SXE - Southern Cross Electrical Engineering Limited
StockRank 92
Momentum Rank 77
QM Rank 90
VM Rank 85
A$1.62
Another one of our NAPS portfolio that I briefly saw members viewing was Southern Cross Electrical Engineering (ASX:SXE). It was actually last commented from a Momentum perspective back in July and members can read it here.

ASX:SXE 1 year Daily chart
Back then I said if I was getting in today I would have my stop loss at $1.505. Following the creation of the new higher high, that level is now raised to $1.59. In terms of entry you can see that the $1,91 - $1.935 range is quite solid resistance. Therefore a clean break above that level would be preferred in this author’s view.
Especially as the price following Friday’s close is right on the bottom of that sideways channel that I have highlighted. At least, ”you won’t have to wait long to know if you are wrong” with this one.
Pleasingly though, in its recent AGM the company confirmed that operationally things remain on track which is important in establishing a base for the business moving forward.
Stocks in the Shine Zone
To learn about the Shine Zone and how to use it, you can read it here.
The rules for inclusion in this list are based on those I like to see in a stock before considering a trade in it:
QM Rank above 80
Price is above the 2.5x ATR
50d MA is above the 200d MA
Price is greater than the 200d MA
Market cap greater than $200M
This is a very important point: the “Shine Zone” are rules for possible buying. They are not for holding and/or selling. If a stock falls out of the shine zone, use support levels to set your stops, or instigate a parachute stop if necessary. With markets moving sideways, one expects frequent changes in these lists.
If you feel there is a stock that should be included but is missing please let us know. This is a manual process and occasionally one gets through the cracks
Also look at the market capitalisation and liquidity before making any decisions!
Data is at 02 November and is sorted by the stock code.
Changes from last week
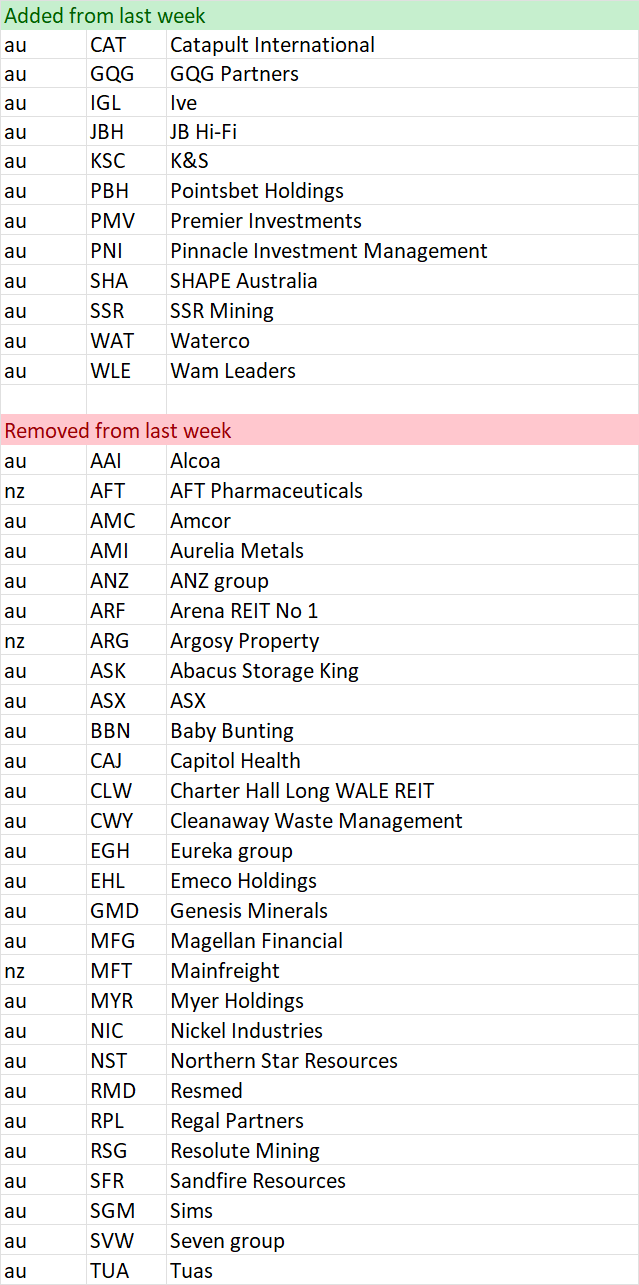
Shine Zone list as at 02 November

Momentum Movers
I have actually published an article discussing my thinking with these tables. You can read about it here.
In summary, there is a school of thought that the change in something is just as important as the absolute number itself. Momentum is our most volatile ranking. This section is intended to bring to readers attention the big moves from a Momentum Perspective. As with other lists this is not designed to be a list of stocks that are replicated. Rather it can be a starting point of investigation for further consideration. Initially it will record weekly changes. This will include a monthly change when enough time has elapsed. This section is divided into two lists.
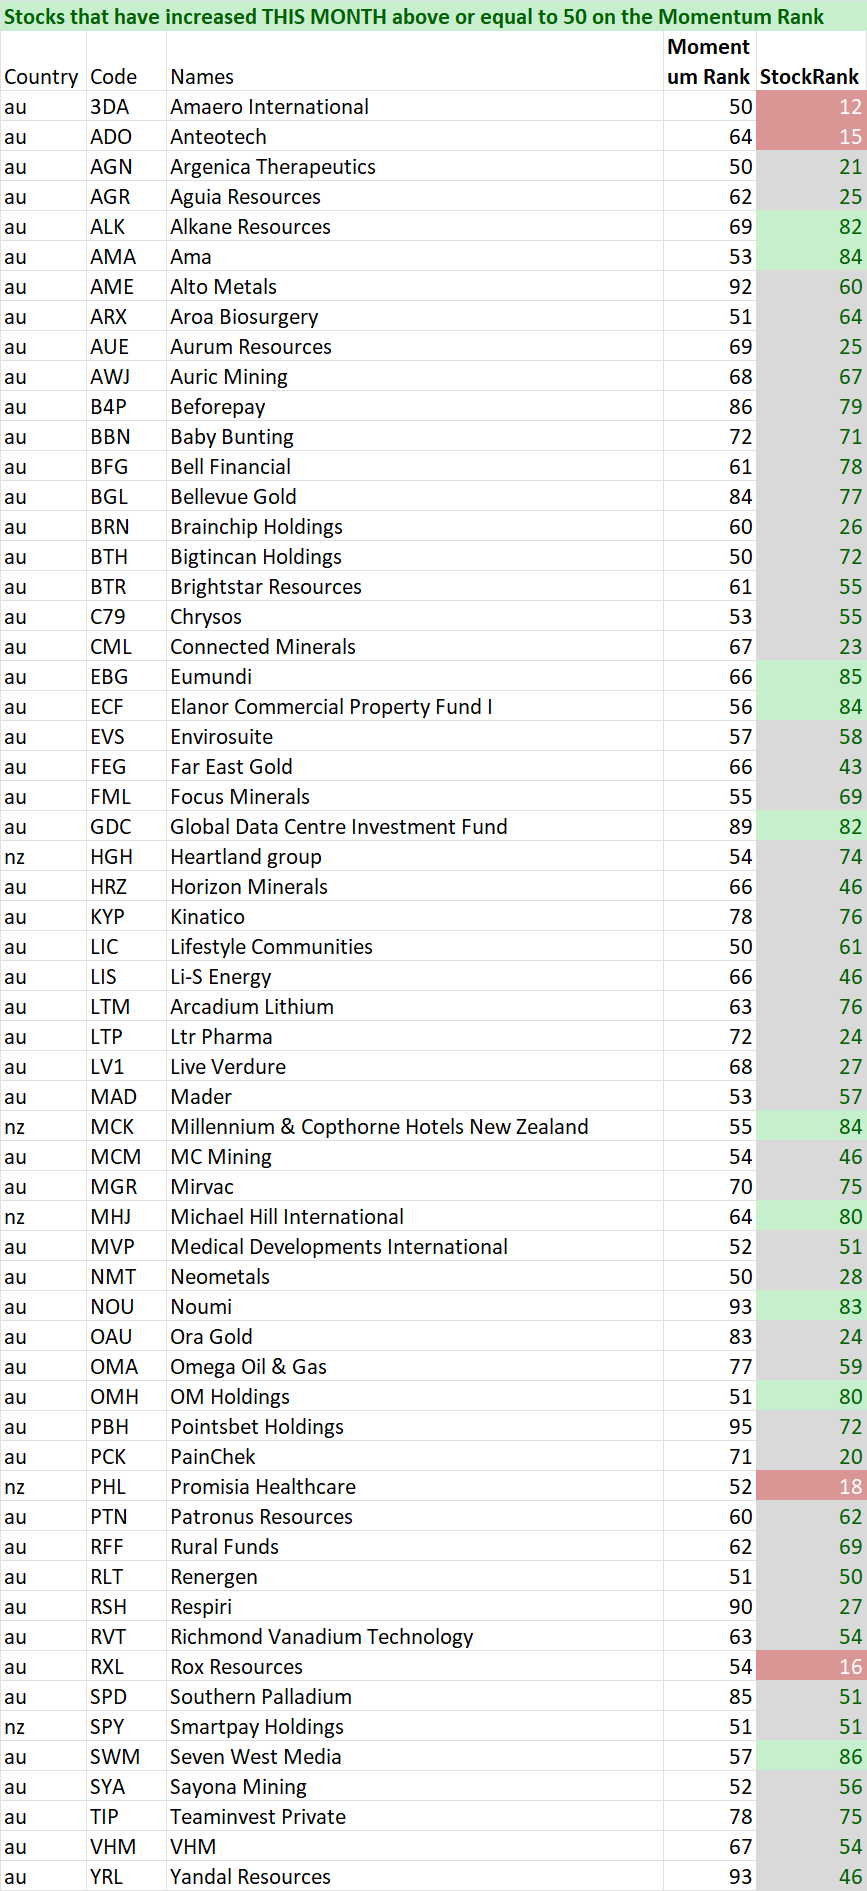
First is a list of stocks that have just crossed above 50 from a Momentum perspective. By definition, these will be stocks that have improved over the past week and month and may warrant further investigation. As a bare minimum a look at liquidity and market cap.
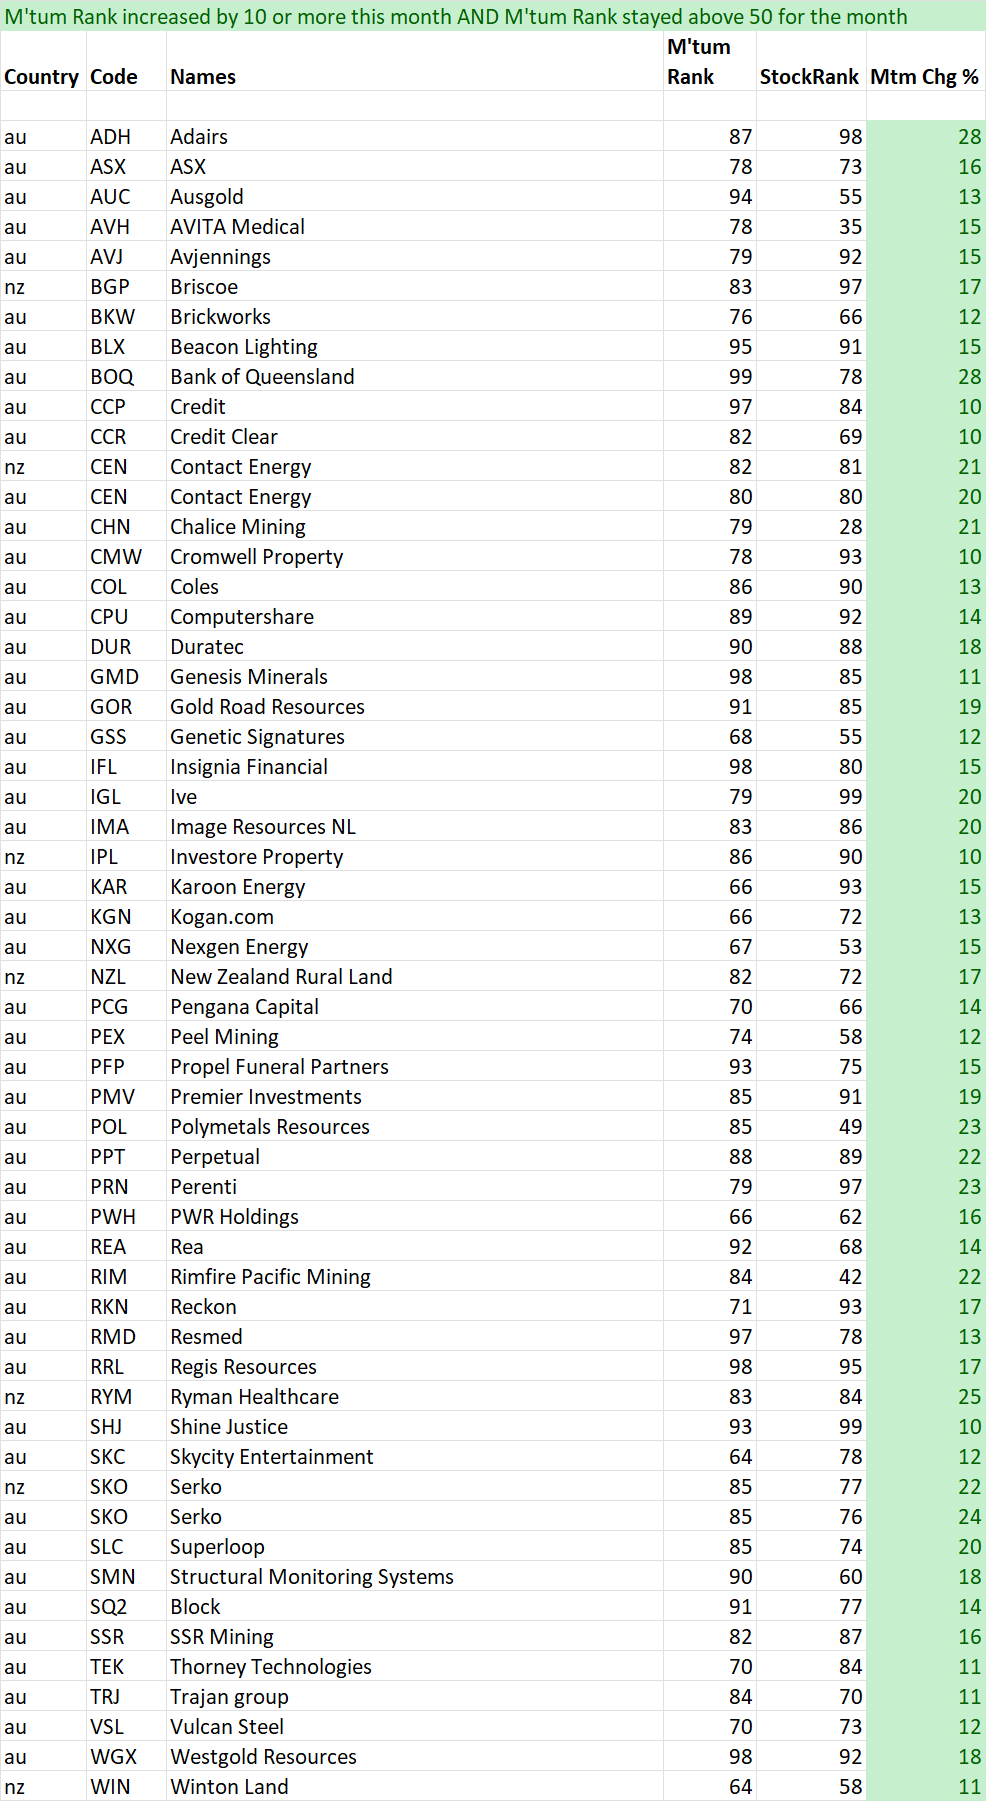
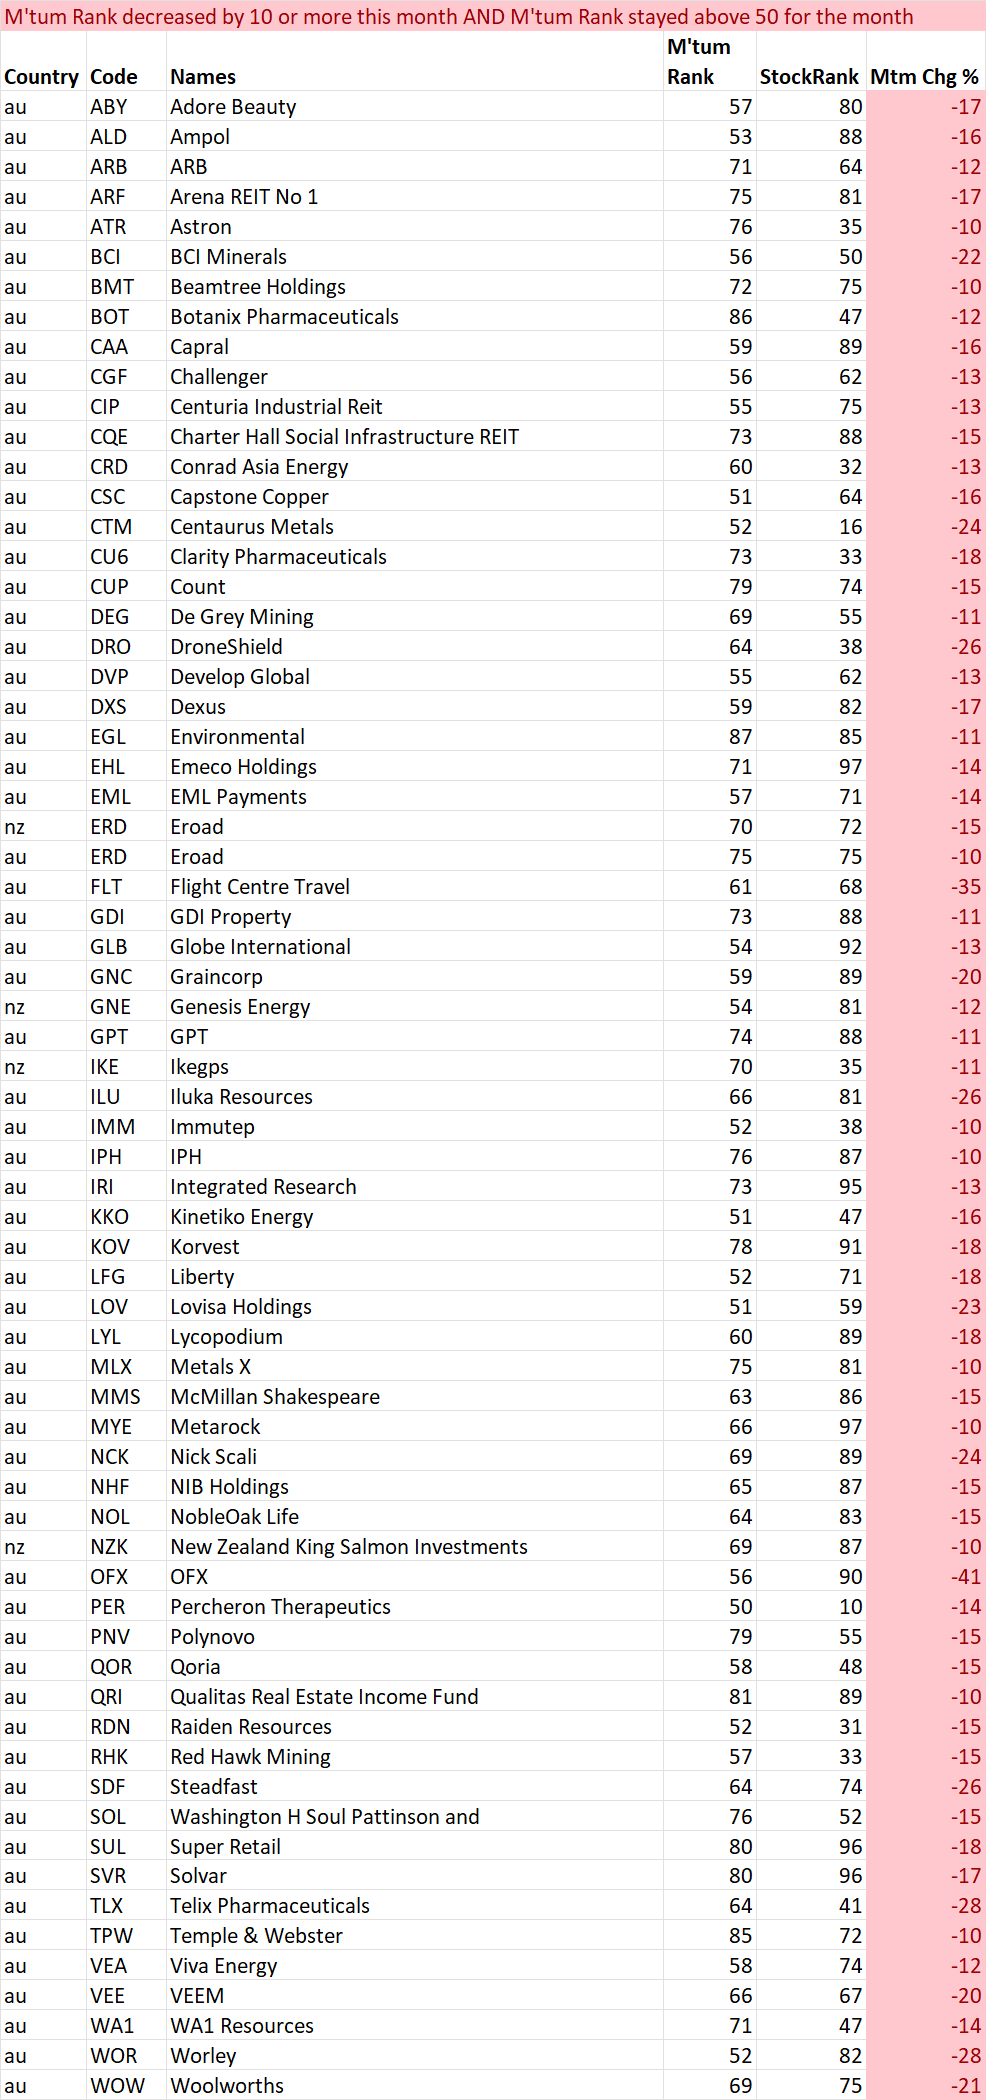
The second list measures all stocks that are currently ranked above 50, have remained above 50 during the time periods analysed (ie not just added or removed) AND whether they have improved or worsened by more than 10 points on the Momentum Rank.
With all filters a minimum market cap of $50 Mil has been included to help ensure investability from a small perspective. Be sure to check liquidity relative to your preferences.
Note: Some of the changes are due to the market cap now rising above $50M. Be sure to double check.
Data is on 02 November and is sorted by their code.
And remember, past performance is no guarantee of future performance.
Weekly Tables (the past week)
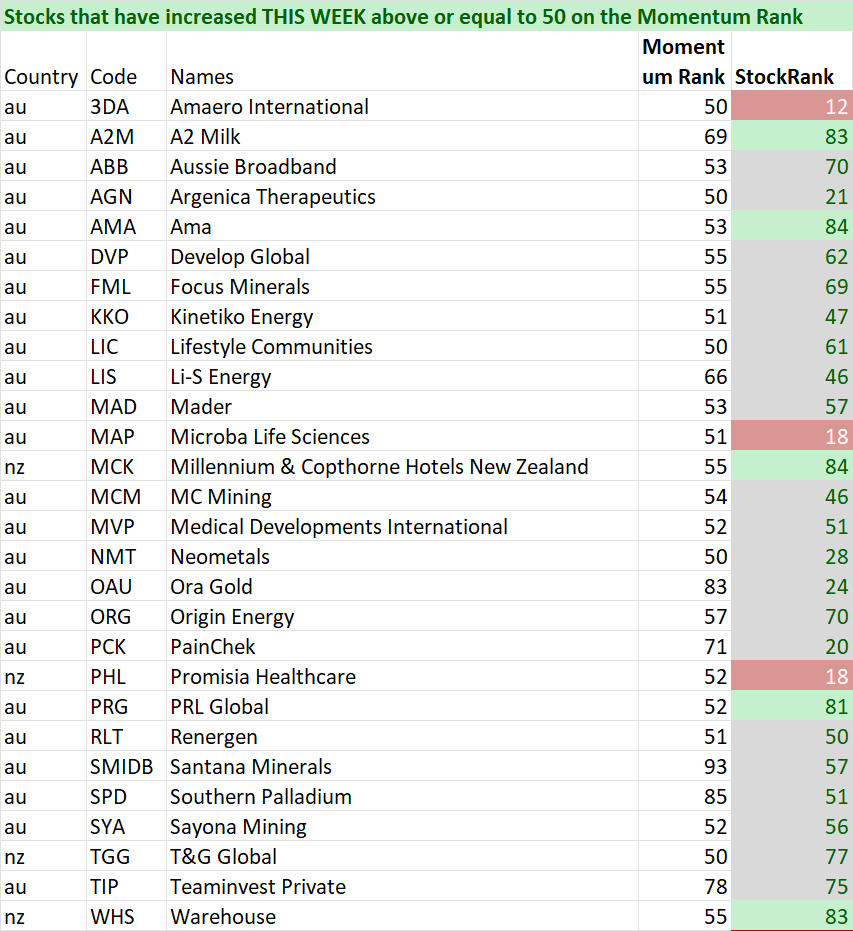
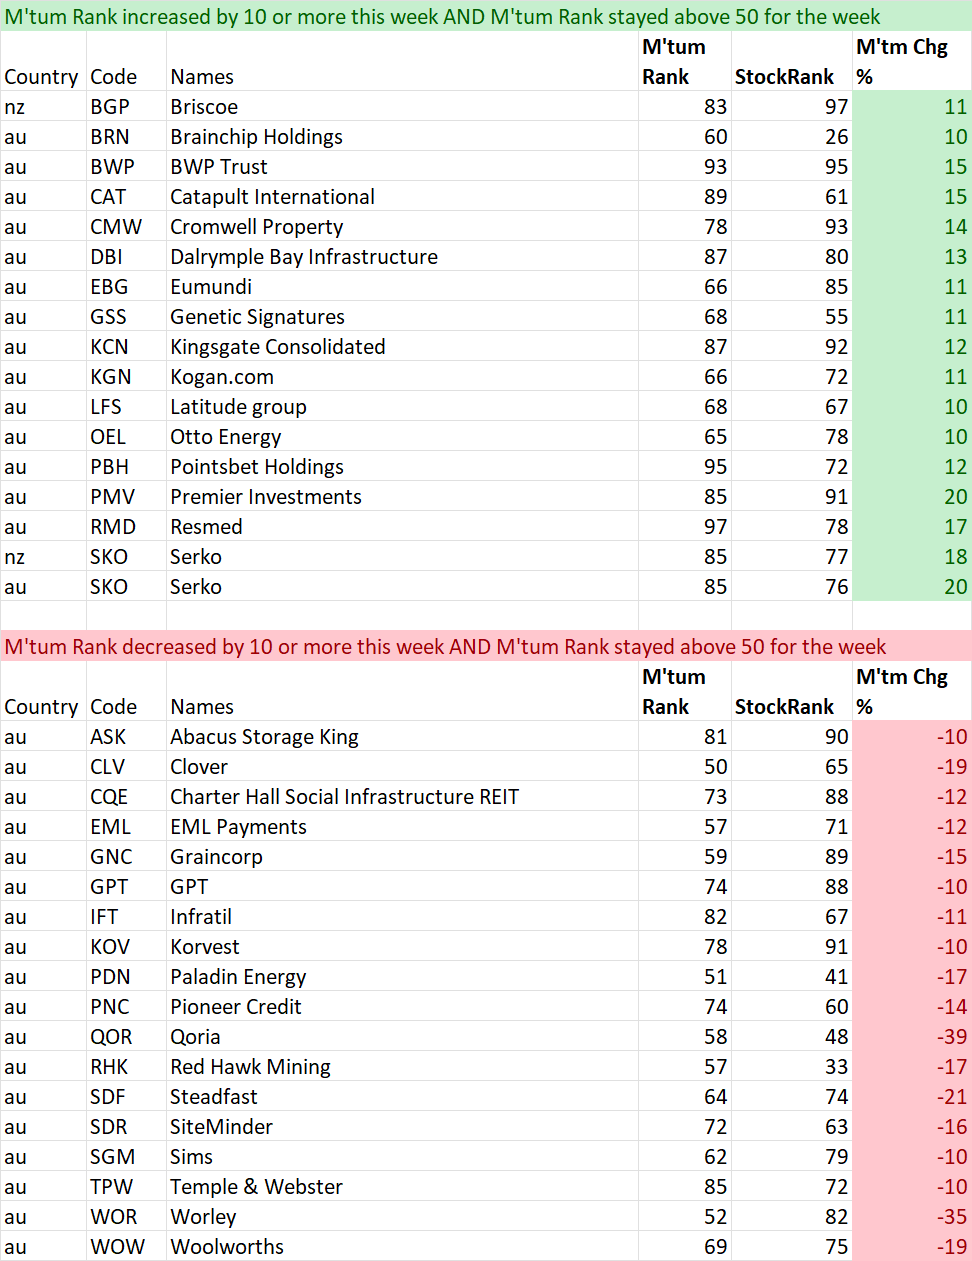
Monthly Tables (from published 05 Oct to 02 Nov) Note: though shorter than last month, these lists are huge. I will be monitoring the size of these very closely as large lists are unwieldy and difficult to use in practicality. Feel free to let us know if you believe otherwise.
52 week high screen
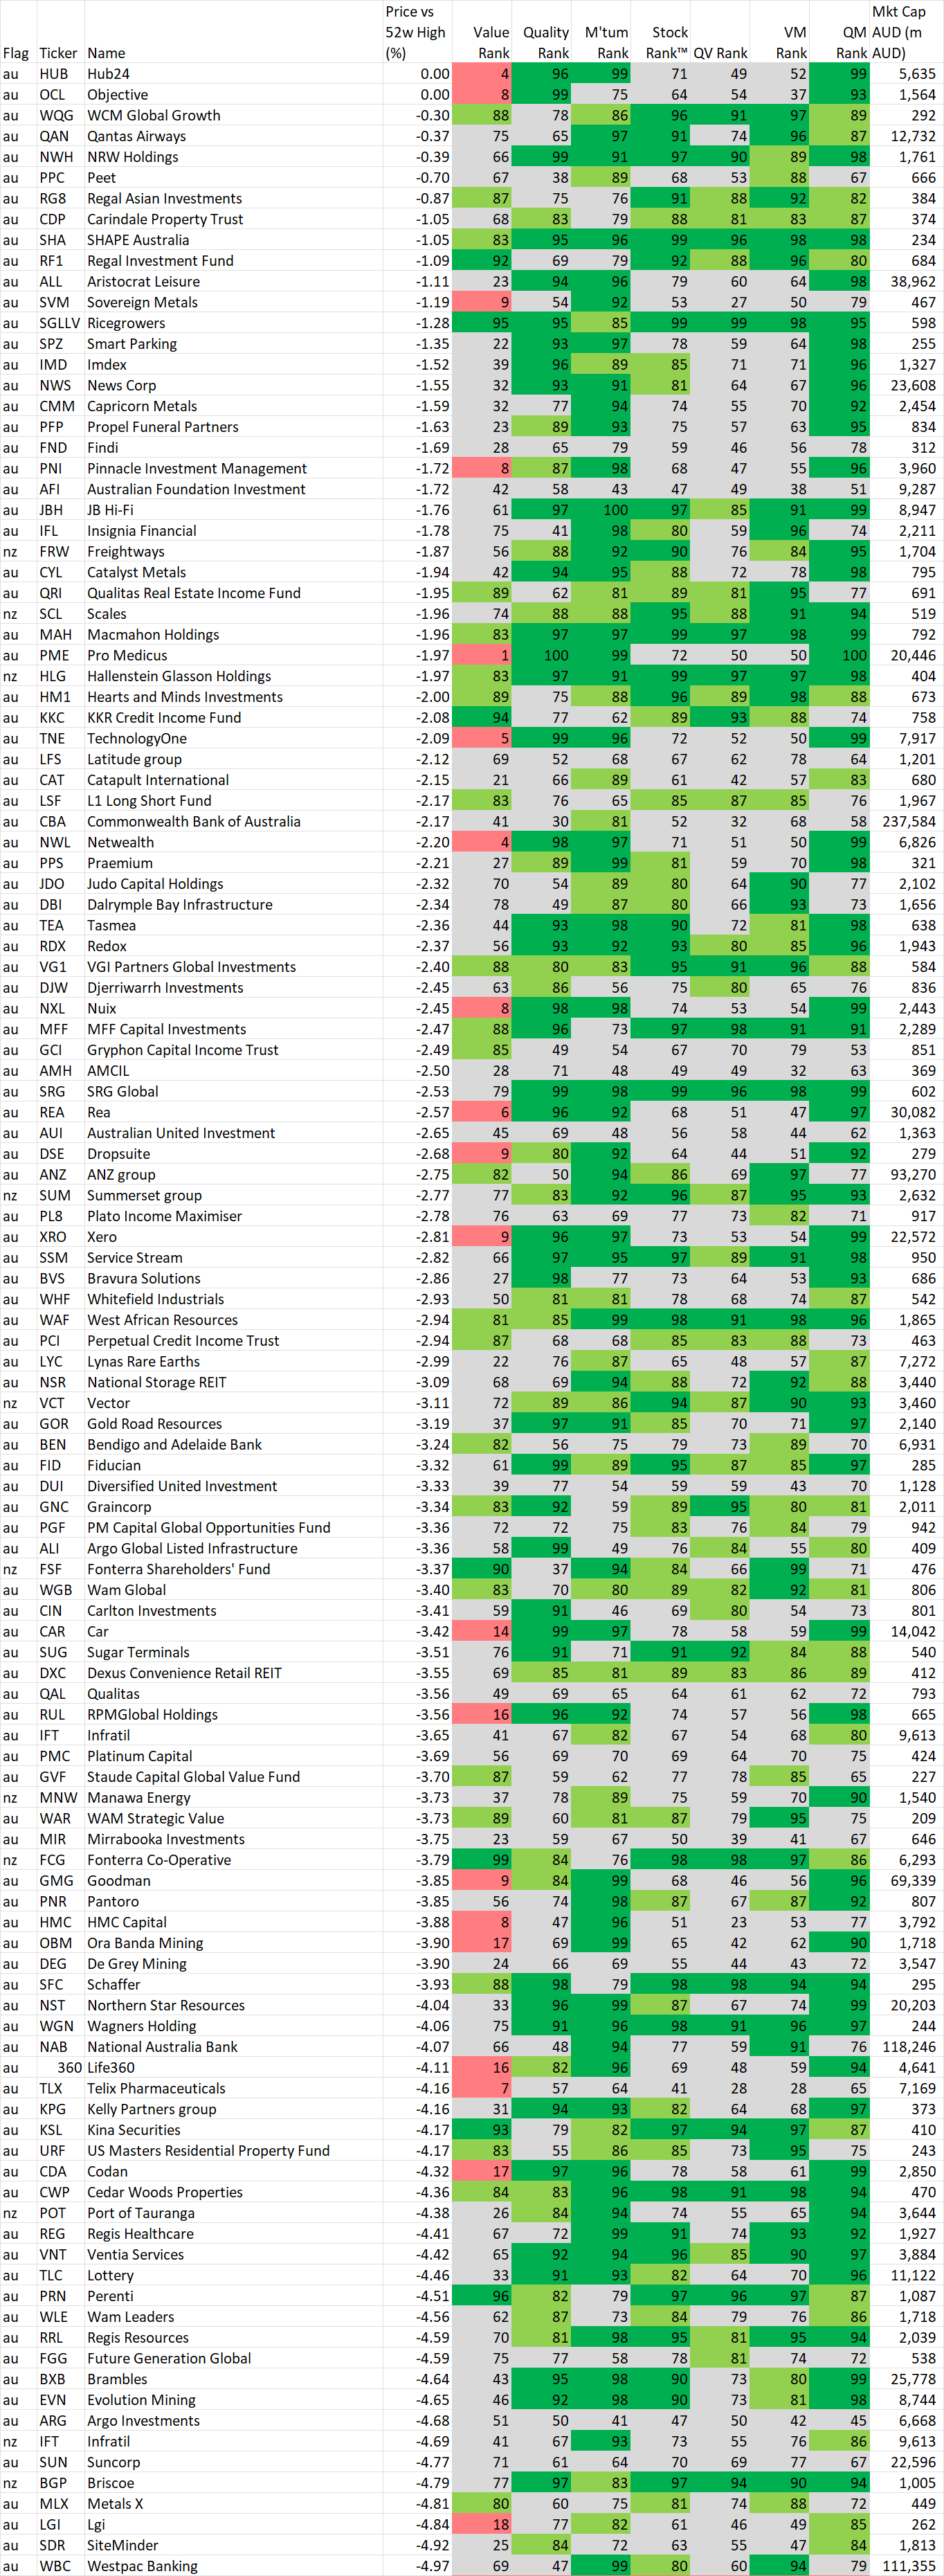
In this section we identify stocks within 5% of their 52 week intraday high based on the idea, supported by academic studies, that stocks close to their 52 week highs tend to outperform. Weekly changes to the list will also be noted.
If you wish to recreate this screen in the screener select "Price vs 52 high" greater than -5% and Mkt Cap greater than $200M
A stock coming onto the list is NOT an automatic buy, just as a stock that leaves the list is NOT an automatic sell. As with the shine list, assess every chart on its merits. However movements on this list may alert you to interesting charts so be sure to look at Stockopedia and the chart first.
Data is at 02 November and is sorted by the stocks closest to their 52 week intraday high.
Also look at the market capitalisation and liquidity before making any decisions!
And remember, past performance is no guarantee of future performance.
Changes from last week
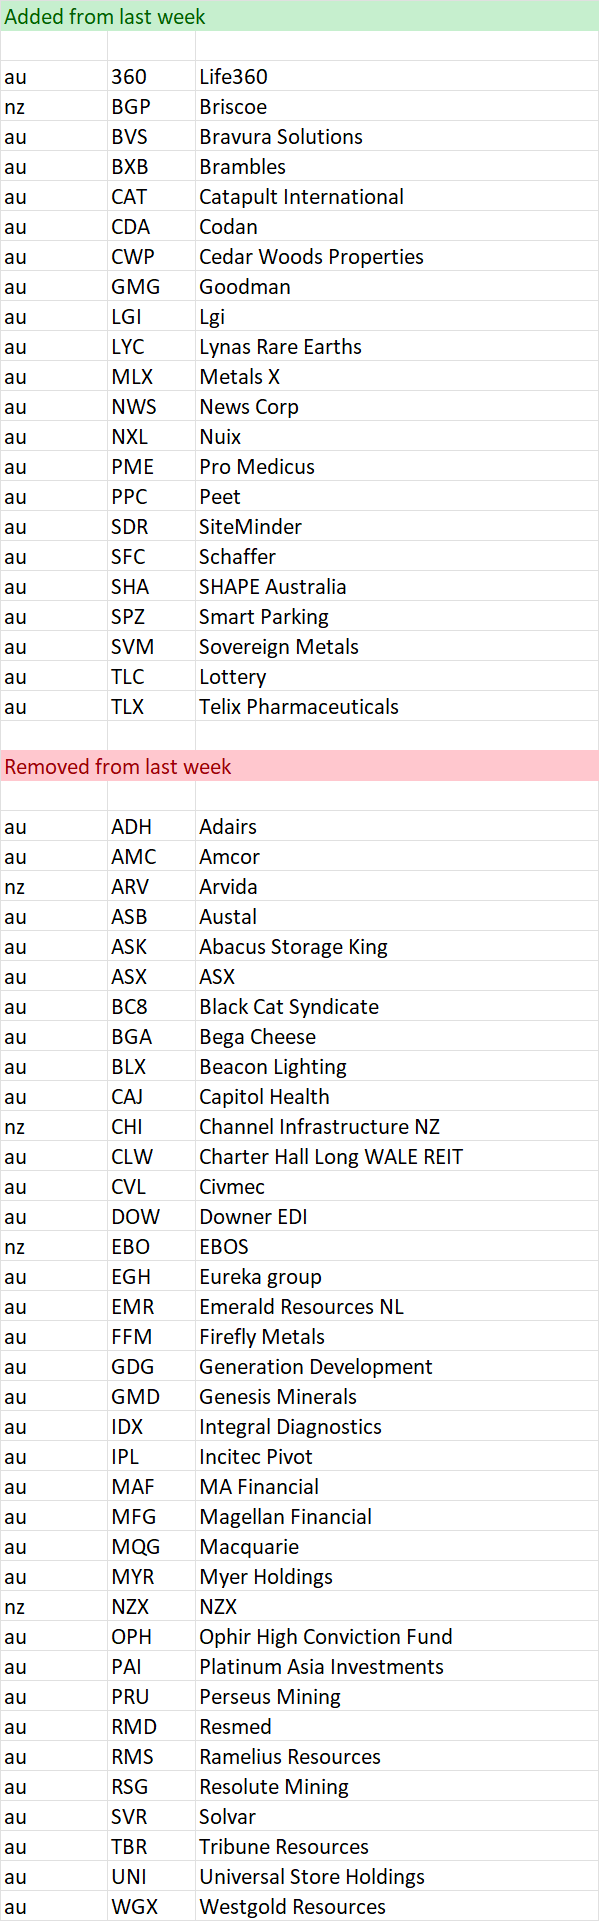
Stocks within 5% of their 52 week high as at 02 November
Important Information: Stockopedia Ltd ABN 39 757 874 670 UK business registration number 0637267 (“Stockopedia”) is an Authorised Representative of Daylight Financial Group Pty Ltd ABN 77 633 984 773 (“DFGPL”) which is the holder of an Australian Financial Services Licence (AFS Licence No. 521404).
Information in this commentary is current as at date prepared unless otherwise stated. However, please bear in mind that investments can go up or down in value, and that past performance is not a reliable indicator of future performance. For more Important Information please refer to the Disclaimer section of this website.
This communication may contain general financial product advice. It has been prepared without taking into account your personal circumstances, and you should therefore consider its appropriateness in light of your objectives, financial circumstances and needs before acting on it.
If our advice relates to the acquisition or possible acquisition of a particular financial product, you should obtain a copy of and consider the Product Disclosure Statement (PDS) before making any decision.
The author holds direct interests in SXE and companies listed in the data tables . This position can and will change at any time without notice.
Disclaimer
This is not financial advice. Our content is intended to be used and must be used for information and education purposes only. Please read our disclaimer and terms and conditions to understand our obligations.
No comments yet
No one has commented here yet! Why not be the first one?