Momentum Monday 5th August 2024

Welcome to Momentum Monday.
I had a sick feeling in the stomach leading into the weekend (and it had nothing to do with my football team Carlton, or the Olympics.)
We start a new month of August with trepidation - which is totally normal for an Australian and New Zealand investor. Just to reiterate… when the market goes down we are obviously worried. When the market goes up we worry because it will likely fall. When the market is going sideways we worry because if it is going to go anywhere it will likely go down.
So I have spent a working career trying to convince investors not to worry about the things they can’t control. And hence why the charts appealed to me. Can’t fight City Hall in my view. So why try to?
Interesting links
This week on Weekend Watchlist run in conjunction with Shares for Beginners, we cover a business that often leaves many scratching their head. It is WHC Whitehaven Coal. Listen here to the replay
We are taking bookings for the next Friday “Lunch ‘n :Learn” Session. Book your place at the virtual table here.
We also have the next instalment of our Investing Mastermind series. Its with Tony Kynaston and he will talk about Identifying Quality at Value and how he goes about investing. If you want to register click here.
As a reminder, we were once again ranked as the Gold Standard by the Investing Newsletter Group. Go to https://www.tinglive.com.au/ to learn more. Given that we are consistently up there, what better time to “Empower Others” than now. Sorry, but it is a no brainer. To Learn read more here

For any external commentary we make to the broader market, follow us on Social Media Facebook Linkedin Instagram or X (formerly Twitter)
This week’s content is as follows:
Broader market sentiment
Member corner
Stocks in the “Shine Zone” (including changes)
Momentum Movers *New section*
52 week high screen (including changes)
A reminder that you don’t have to read all this contribution. Simply scroll to the area of interest.
Broader Market Sentiment
We look at the direction of both the US and ASX markets to gain an understanding of the broader sentiment at the minute. It is important to stress here that I DO NOT use this to time my entry or exit out of stocks. I prefer to use the individual charts of stocks to do that. However I find it useful in helping us determine how aggressive/cautious traders should be in their trading. In short the more positive the broader market is the more risks you can take and vice versa.
US / S&P500
Well it’s going to be tough onMonday. Another down week, the third consecutive in a row, means many are starting to panic about the S&P500.

S&P500 Weekly chart
So is this the start of the end? Maybe - I will wait for the charts to tell me. In the meantime the three consecutive down bars are known as a reversal pattern (or three black - or red - crows) so there is an argument we are starting to run out of puff. But you don’t need me to tell you that. Just reading the media and there is definitely a growing chill in the air. Even the once untouchable IT sector is starting to see cracks as Amazon failed to excited and many calling the demise of Apple. The others have just gone up too fast and needed to pull back. To keep things in some perspective, the broader S&P500 is 5.7% from its recent all time highs despite the three down weeks.
For little old me in the North-West of Melbourne I just see it all as zig and zags. And for the last three weeks in the US we have Zagged. I talked about the rise if the small caps vs the Magnificent 7 in recent weeks. All of that is forgotten of course when there is a broad sell off. The action on Friday alone suggests a pause in festivities. But I take heart that it is nowhere near as what Japan was at the their open. But again, I don’t have to guess one way or the other whether I am right (though me tendency would be to stay long). I will just let the index tell me when to be less aggressive, and the charts of my individual stocks will tell me the rest.
The volatility of Friday was being blamed on a weaker than expected Jobs report released on Friday which showed growth in the U.S. slowed more than expected, while the unemployment rate rose to the highest since October 2021. Now once upon a time quite recently that would have been considered good news as it would mean a rate cut coming was more likely. But here is the thing. Everyone now expects rate cuts on slowing inflation - so supposedly bad news is bad news again. But here is the thing. A rising rate cycle means the economy is doing well. A falling rate cycle means it ids doing bad. So now that everyone had realised this to some degree we are seeing what we are. Some have even raised the dreaded “R” word (ie Recession) but again… what is little old me going to do about it.
And I am sure the emergence of a credible Presidential threat is adding to volatility. Not the ‘uncertainty’ is more the issue, given the market’s performance under the current administration.
It’s not going to be fun on Markets globally on Monday, but the positive trend remains in play for now despite the 3 red crows and its flag as a possible reversal pattern.I remain unwavering for now for as long as the index stays above 4967. Note that this is the current position. It doesn’t mean it can’t change.
AUS S&P/ASX200
It certainly didn’t feel like it given the sell off on Friday, and the fact the Japanese market opened down with its biggest one day fall since Black Monday 1987, but our market actually closed up for the week.

S&P/ASX200 Weekly chart
In fact had it not been for the sell off on Friday, we would have closed at all time high levels. Therefore as you can tell, I am not panicking yet. But I say, and you know, that prices zig and zag and the Asian selloff on Friday may be the precursor to something bigger. But for now until the charts tell me otherwise, things are still going up.
And I mentioned the market was up. And that was fuelled in large part by what happened on Wednesday when we received CPI data for June and it was lower than expected (about 1% for the quarter) and by extension the market took it that it is now less likely that the RBA raise rates next week. This supported by June retail turnover that posted a 0.5% increase, seasonally adjusted. It was higher than expected. So the narrative of doing nothing on interest rates grows louder and as the economy appears headed for a softer landing soon, traders took a breath. But this was all eroded by Friday of course. It was also not unsurprising to see some of the biggest sell-offs occurring in the stocks with a significant interest in Asia and those that had bounced most aggressively in recent times.
And let’s face it, the ASX 200 reset its record high at 8148 points. just two trading days ago.
Now the lists below are quite large. And that is to be expected in a Bull Market. Their size will often tell us what is happening out there. Of most interest is when they diverge. If this week is a down week as many 'expect' then expect these lists to reduced. Especially stocks in the shine zone and those 5% away from recent highs. As Momentum Rank is relative the middle tables shouldn't change 'too much.'
It is also just the start of the reporting season over here and the very early indications are that our well established quality businesses are holding their own, and the rest are left to their own devices. We will learn more in the coming week, as well as receive some more guidance of using Stockopedia during this business period during this busy time.
It is going to be tough on Monday (most likely) but that will only be one day of five so I am not prepared to throw the baby out with the bath water just yet. But a reminder, while I remain positive, it doesn’t mean that view can’t change. In my view it is less about predicting tops and bottoms and more about the chunky bits in the middle. To that I see no change in sentiment in Local markets until the S&P/ASX 200 falls below 7547, however it does ‘feel’ different. This ‘feeling’ though I have had for the last two decades so I will ignore it for now. I think I may take a long walk.
Member corner
In this section we will provide a detailed chart assessment, on a maximum of ten stocks weekly, on companies from those of you in the Gallery.
We welcome stock requests to be analysed from members. We will also be looking at the charts of some of the more actively researched stocks for the week. We will try to rotate through a selection so as to not make the charts stale, however we will likely not cover a stock within 2 months of when it was last discussed.
If you want to see what has been written about a stock recently, go to the discussion area.

We will not be making up suggestions. If there are no changes to the most viewed list and/or there are no suggestions from members, then no stocks will be covered.
To learn of the methods used to analyse companies in this section, refer to my Momentum Journey series that I articulate here in three parts.
They will help provide context on what I am writing about and the editorial angle of this report.
Also look at the market capitalisation and liquidity before making any decisions!
And again, if you have a stock you would like analysed from a momentum perspective, please write it into the comments section below or email us at support@stockopedia.com.au
IF NO ONE ASKS… HOW AM I SUPPOSED TO KNOW?!?
ASX:SGLLV - Ricegrowers
StockRank 98
Momentum Rank 76
QM Rank 91
VM Rank 96
A$8.76
I commented on Ricegrowers (ASX:SGLLV) two months ago. I flagged that it had broken the sideways channel it had perennially been in, Investors can read that commentary here .

Back then I also reminded everyone that it was one of inclusions for the NAPS portfolio this year and that it receives coverage regularly.
But from a Momentum perspective the stock is not just at a 52 week high, but it is also an all-time high as well. Thepull back post the breakout saw the price fall back into the channel, but it held above the previous higher low. This has since provided the springboard for the price to go one a run now to these new all time highs.
As previously mentioned and I am sure observed by you a thousand times, prices zig and zag and if were waiting to enter this stock, all I can say is don’t chase. Rather, just wait for it to come back a bit. Provided it holds $7 then it is in an uptrend. However if you are holding and that drawdown is too steep for you at these current levels then a stop around $8.22 may be appropriate give the strength of the recent run.
ASX:RSG - Resolute Mining Limited
StockRank 96
Momentum Rank 99
QM Rank 95
VM Rank 97
A$0.66
It was good to see another NAPS portfolio inclusion monitored by members this week in Resolute Mining (ASX:RSG). Though we have covered it quite a bit fundamentally, we last looked at it from a Momentum perspective back in April last year. You can read the commentary here.

ASX:RSG 1 year Daily chart
Back then it was on a tear due to a rebounding Gold price, but then took a breather as Investors preferred stocks with less geo political risk (please read other comments for more detail). That said it has experienced a renaissance of sorts as investors seek further value deeper into the market.
As this is well covered fundamentally with risks clearly highlighted, I will stick with strategic levels here. On the downside that level is 49 cents. If you can’t wait, then short term there is a trade if the price gets above 66.5 cents. Looking further back, we can see a structural level from where long term lower low was established from 2020 that is about to be breached (at 74 cents).

ASX:RSG 5 year Weekly chart
Therefore if the price goes above that it could be off to the races with the first target at $1.35.
Stocks in the Shine Zone
To learn about the Shine Zone and how to use it, you can read it here.
The rules for inclusion in this list are based on those I like to see in a stock before considering a trade in it:
QM Rank above 80
Price is above the 2.5x ATR
50d MA is above the 200d MA
Price is greater than the 200d MA
Market cap greater than $200M
This is a very important point: the “Shine Zone” are rules for possible buying. They are not for holding and/or selling. If a stock falls out of the shine zone, use support levels to set your stops, or instigate a parachute stop if necessary. With markets moving sideways, one expects frequent changes in these lists.
If you feel there is a stock that should be included but is missing please let us know. This is a manual process and occasionally one gets through the cracks
Also look at the market capitalisation and liquidity before making any decisions!
Data is at 03 August and is sorted by the stock code.
Changes from last week
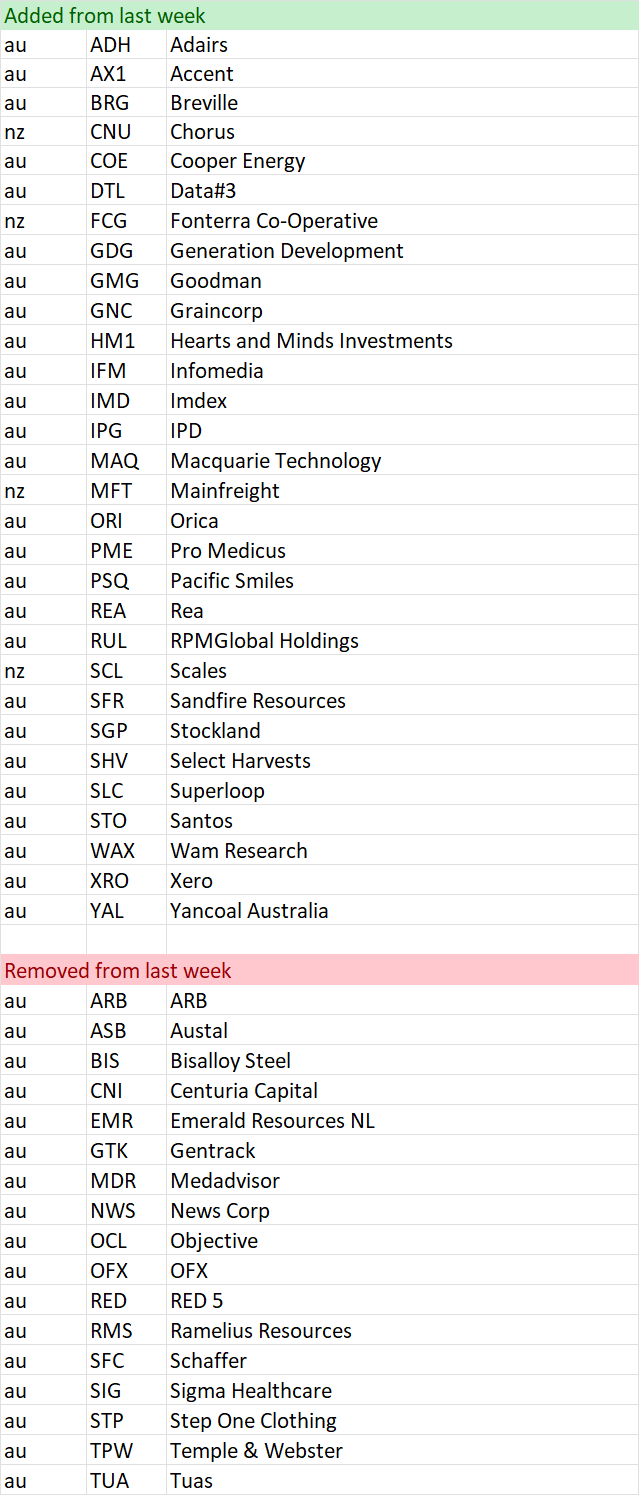
Shine Zone list as at 03 August

Momentum Movers *New Section*
I have actually published an article discussing my thinking with these tables. You can read about it here.
NOTE: THERE IS A SMALL CHANGE TO THE SCREEN. PLEASE READ BELOW.
ALSO THERE WAS A CRITICAL ERROR IN THE SCREENER WHERE DUAL LISTED STOCKS WERE EXCLUDED, THIS MEANS THE MONTHLY COMPARATIVE FIGURES WON’T APPEAR UNTIL THE FOLLOWING MONTH (Start of September). SORRY FOR THE INCONVENIENCE
In summary, there is a school of thought that the change in something is just as important as the absolute number itself. Momentum is our most volatile ranking. This section is intended to bring to readers attention the big moves from a Momentum Perspective. As with other lists this is not designed to be a list of stocks that are replicated. Rather it can be a starting point of investigation for further consideration. Initially it will record weekly changes. This will include a monthly change when enough time has elapsed. This section is divided into two lists.
First is a list of stocks that have just crossed above 50 from a Momentum perspective. By definition, these will be stocks that have improved over the past week and month and may warrant further investigation. As a bare minimum a look at liquidity and market cap.
The second list measures all stocks that are currently ranked above 50, have remained above 50 during the time periods analysed (ie not just added or removed) AND whether they have improved or worsened by more than 10 points on the Momentum Rank.
With all filters a minimum market cap of $50 Mil has been included to help increase the likelihood they are investable from a small cap perspective. Be sure to check liquidity relative to your preferences.
As this is a new list we welcome any feedback you may have. If we have missed anything do let us know.
Data is at 03 August and is sorted by their code.
And remember, past performance is no guarantee of future performance.
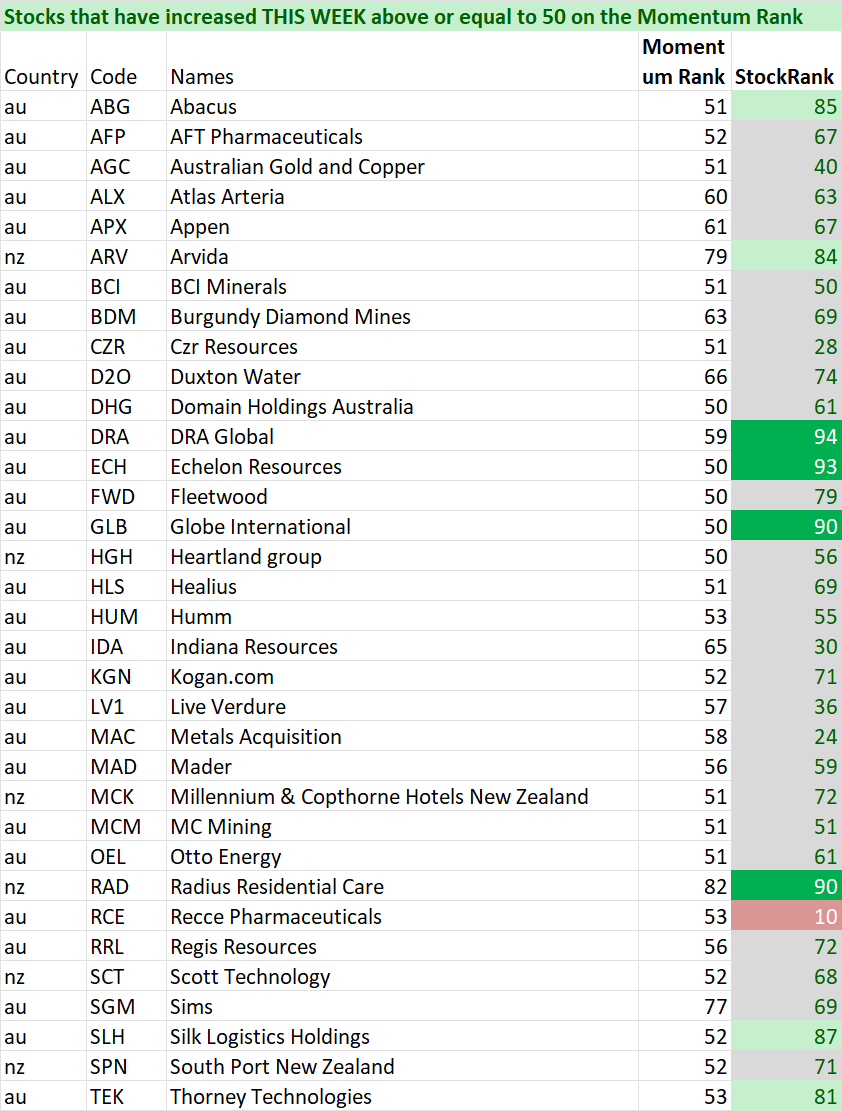
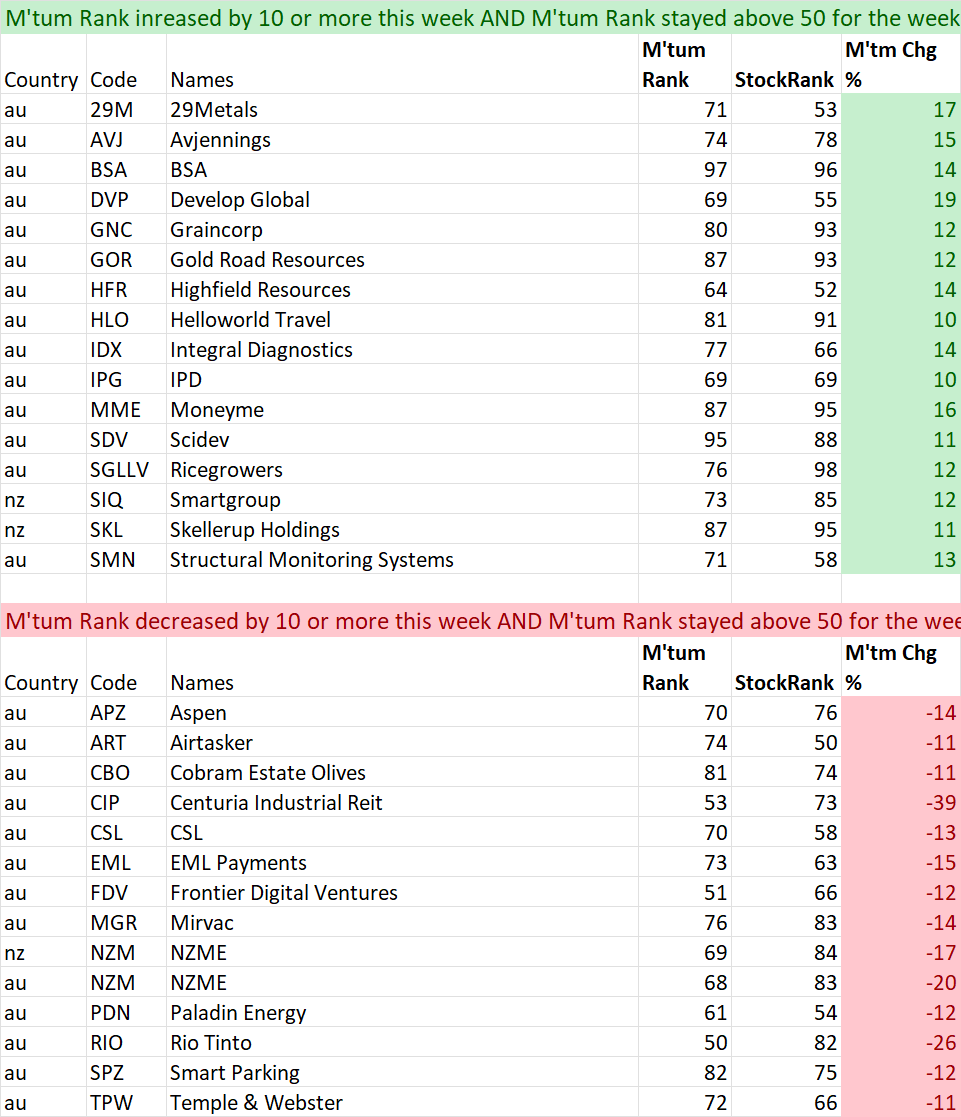
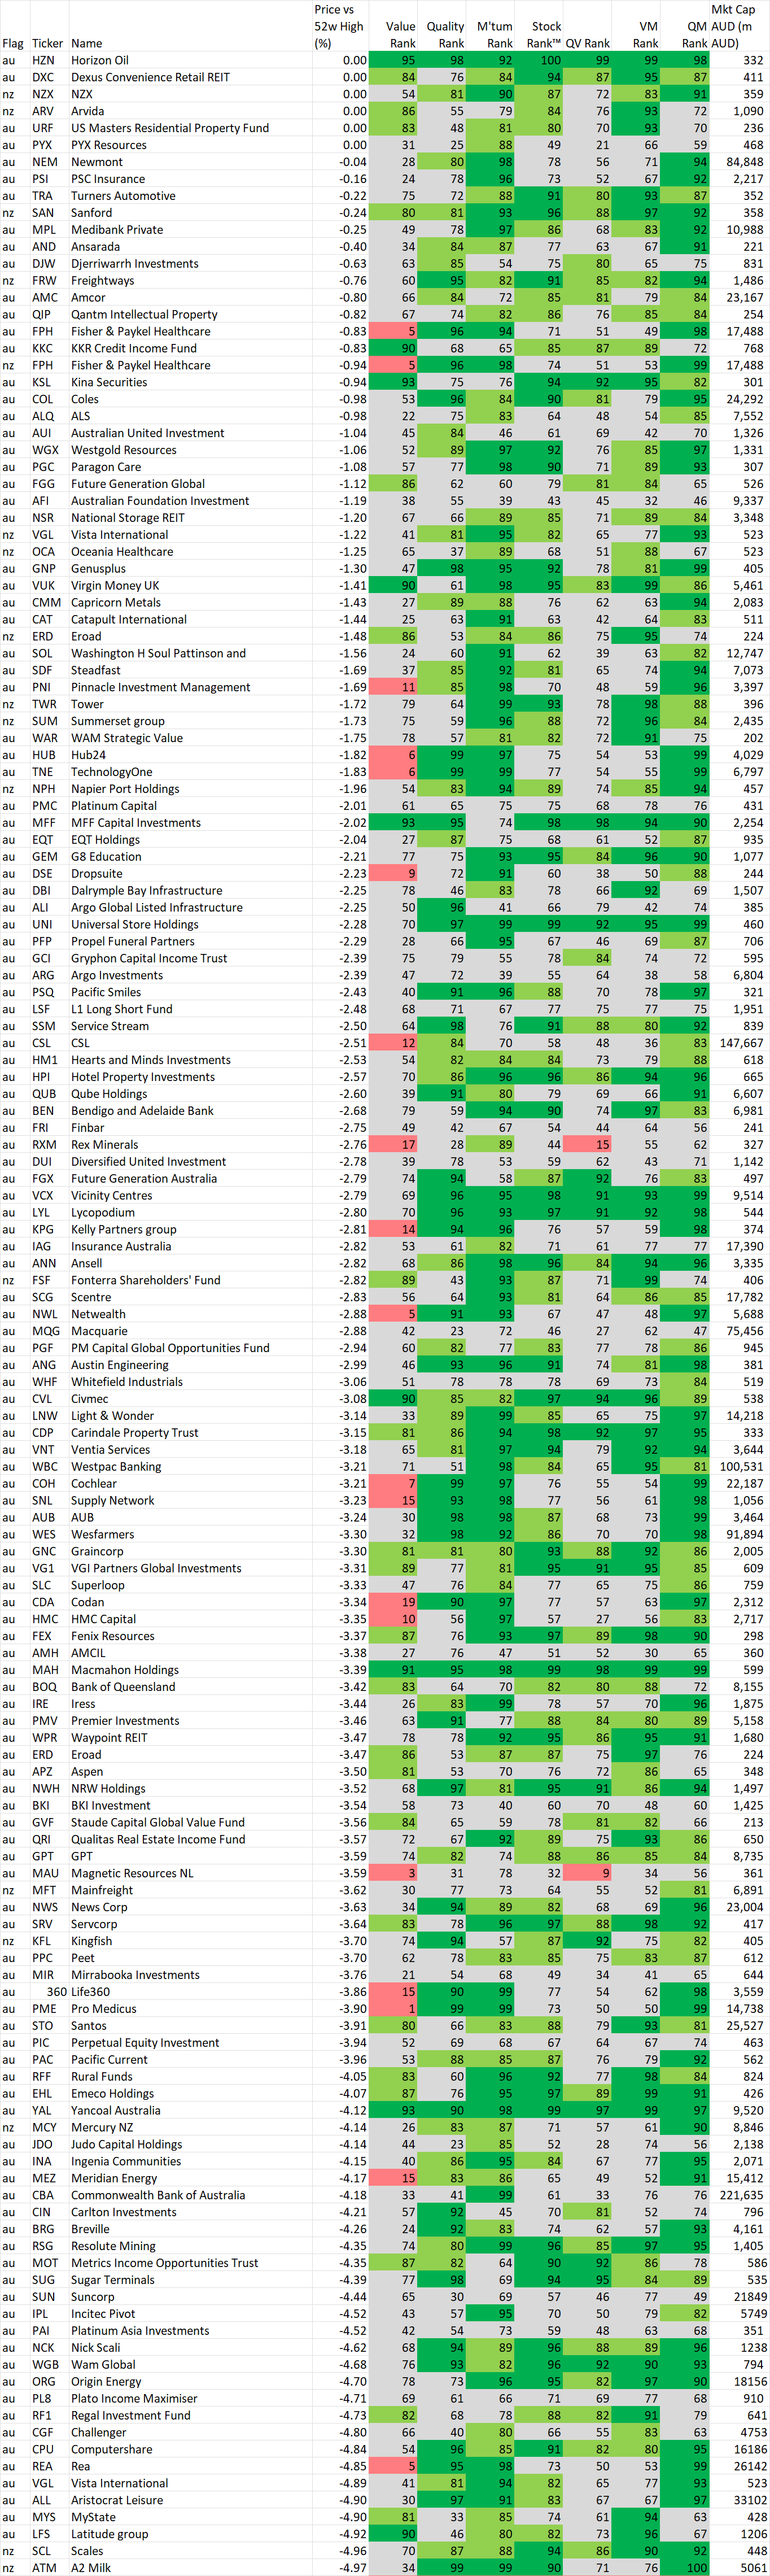
52 week high screen
In this section we identify stocks within 5% of their 52 week intraday high based on the idea, supported by academic studies, that stocks close to their 52 week highs tend to outperform. Weekly changes to the list will also be noted.
If you wish to recreate this screen in the screener select "Price vs 52 high" greater than -5% and Mkt Cap greater than $200M
A stock coming onto the list is NOT an automatic buy, just as a stock that leaves the list is NOT an automatic sell. As with the shine list, assess every chart on its merits. However movements on this list may alert you to interesting charts so be sure to look at Stockopedia and the chart first.
Data is at 03 August and is sorted by the stocks closest to their 52 week intraday high.
Also look at the market capitalisation and liquidity before making any decisions!
And remember, past performance is no guarantee of future performance.
Changes from last week
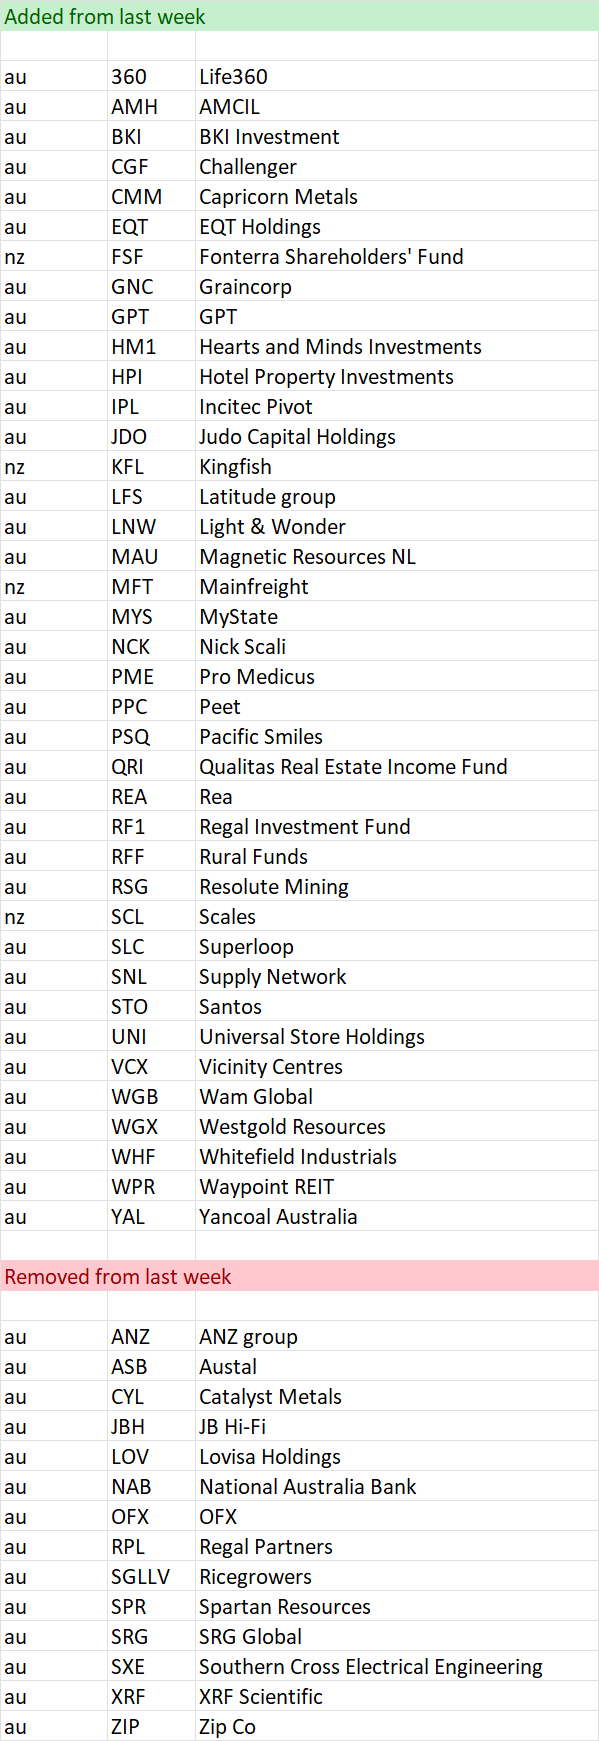
Stocks within 5% of their 52 week high as at 03 August
Important Information: Stockopedia Ltd ABN 39 757 874 670 UK business registration number 0637267 (“Stockopedia”) is an Authorised Representative of Daylight Financial Group Pty Ltd ABN 77 633 984 773 (“DFGPL”) which is the holder of an Australian Financial Services Licence (AFS Licence No. 521404).
Information in this commentary is current as at date prepared unless otherwise stated. However, please bear in mind that investments can go up or down in value, and that past performance is not a reliable indicator of future performance. For more Important Information please refer to the Disclaimer section of this website.
This communication may contain general financial product advice. It has been prepared without taking into account your personal circumstances, and you should therefore consider its appropriateness in light of your objectives, financial circumstances and needs before acting on it.
If our advice relates to the acquisition or possible acquisition of a particular financial product, you should obtain a copy of and consider the Product Disclosure Statement (PDS) before making any decision.
The author holds interests in companies listed in the data tables . This position can and will change at any time without notice.
Disclaimer
This is not financial advice. Our content is intended to be used and must be used for information and education purposes only. Please read our disclaimer and terms and conditions to understand our obligations.
No comments yet
No one has commented here yet! Why not be the first one?