Momentum Monday 5th June

Welcome to the latest Momentum Monday installment.
Before we get into this week’s content, just a reminder that last week (on Wednesday) we sent you a notice introducing our referral program, where for every Australia based member who refers a client, that person will receive 10% off their first year. Further, should they stay beyond their 30 day money back guarantee period, either Chris or I will have a 30 minute discussion with you over the phone about stocks, your portfolio or anything that tickles your fancy.
Also for Victorian members, specifically in the Eastern suburbs of Melbourne, you would have also received an email about one of our members wanting to establish an investor chat group (just to clarify... this is not an official Stockopedia event). If you are interested and willing to contribute, again check your emails (sent Monday) and follow up if you are keen.
If you are keen to learn a bit more about any of these initiatives, or more, simply click on the Green question box in the Stockopedia application, or email support@stockopedia.com.au
And just a reminder that the ASX will be closed next Monday on account of the King's Birthday in most states (ex Qld & WA) therefore the next Momentum Monday will be published on a Tuesday.
The content for this week's edition is:
Broader market sentiment
Member corner
Stocks in the “Shine Zone”
52 week high screen (including changes)
A reminder that you don’t have to read all of it. Simply scroll to the area of interest.
If you have any suggestions for us, please be sure to include them in the comments below.
Broader Market Sentiment
We look at the direction of both the US and ASX markets to gain an understanding of the broader sentiment at the minute. While this analysis is not to time specific entry into or exit out of stocks, they are useful in helping us determine how aggressive/cautious traders should be in their trading.
US S&P500
The strong rally on Friday saw the S&P500 close the week at 52 week highs (note: intraday there have been higher closes - however this weekly close surpass the previous 52 week high of August 2022.
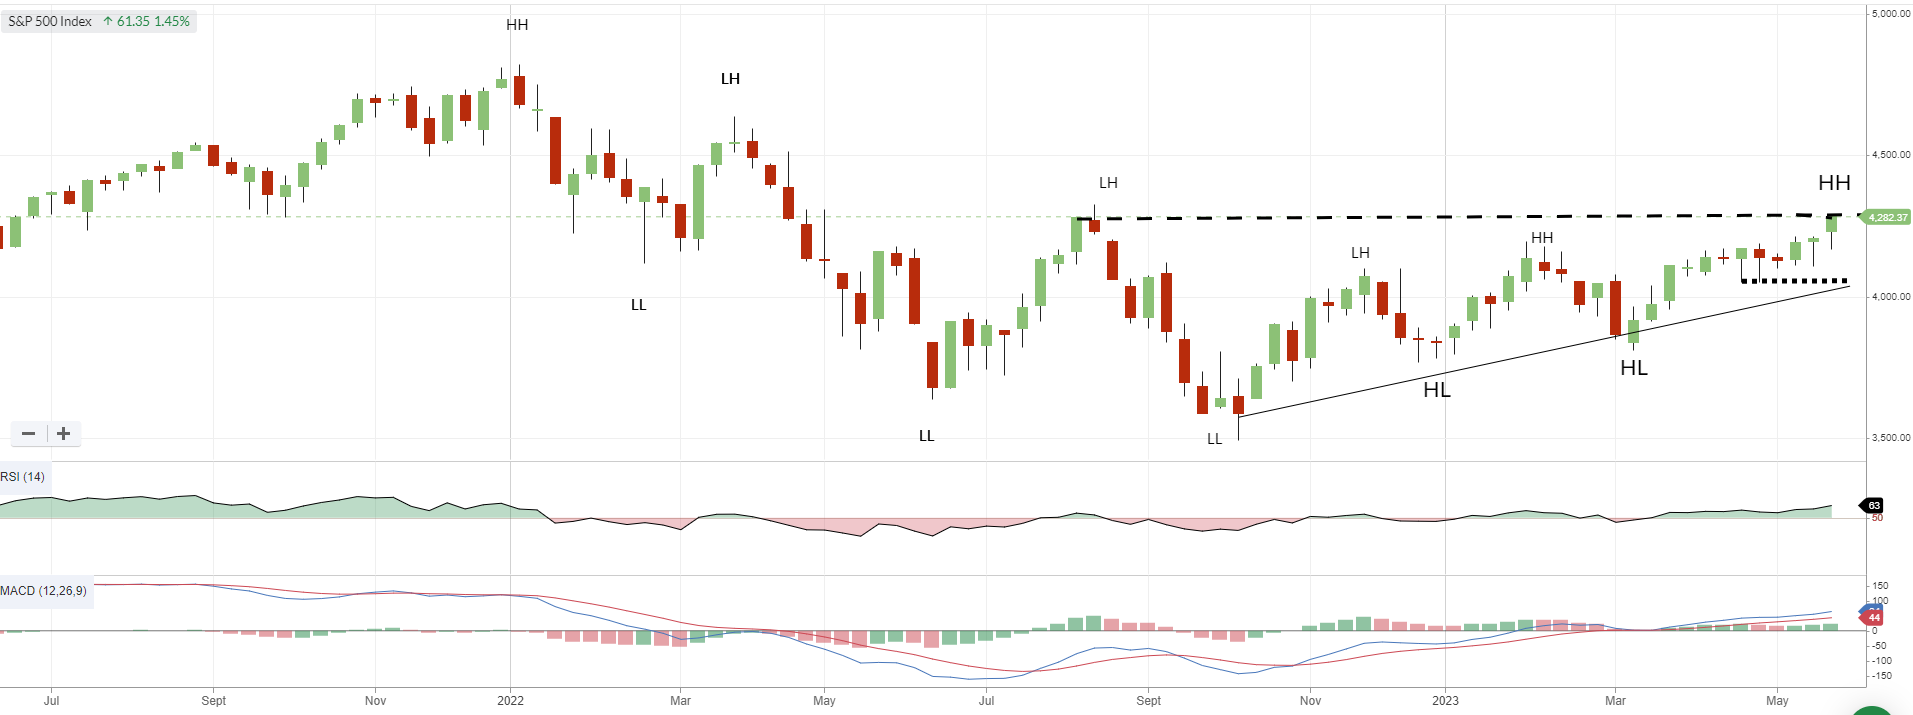
S&P500 Weekly chart
A few things for keen Momentum Monday readers to note.
I have removed the downward channel from the previous 2021 high. The performance for the last six months for the S&P500 means keeping it on the chart will be for the sake of simply drawing lines. Future levels of support and resistance from here on in will be governed by what happens from here
I still maintain support for the S&P500 is at 3840 as it makes for a nice convergence of the uptrend line and March low. As mentioned last week, traders who are particularly gitterish may still use 4056 for immediate comfort. Fingers crossed we don’t need these levels.
The weekly indicators also look support of this move. The RSI in particular that is at levels not previously see since the start of 2022. The MACD likewise has not been above the zero lines with both MA’s in the right spot AND rising this strongly since 2021.
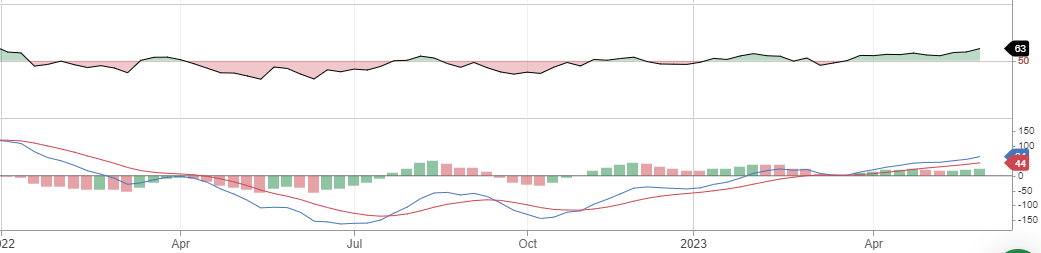
S&P500 RSI and MACD since start of 2022
We mentioned last week that the market had a positive shape to it (further supported by the daily chart) and it surpassed our target of 4280 which means it is running on its own gas now. On top of the strong jobs report, much of the positivity continues to come from the US tech sector with the recent spectacular gains of Nvidia
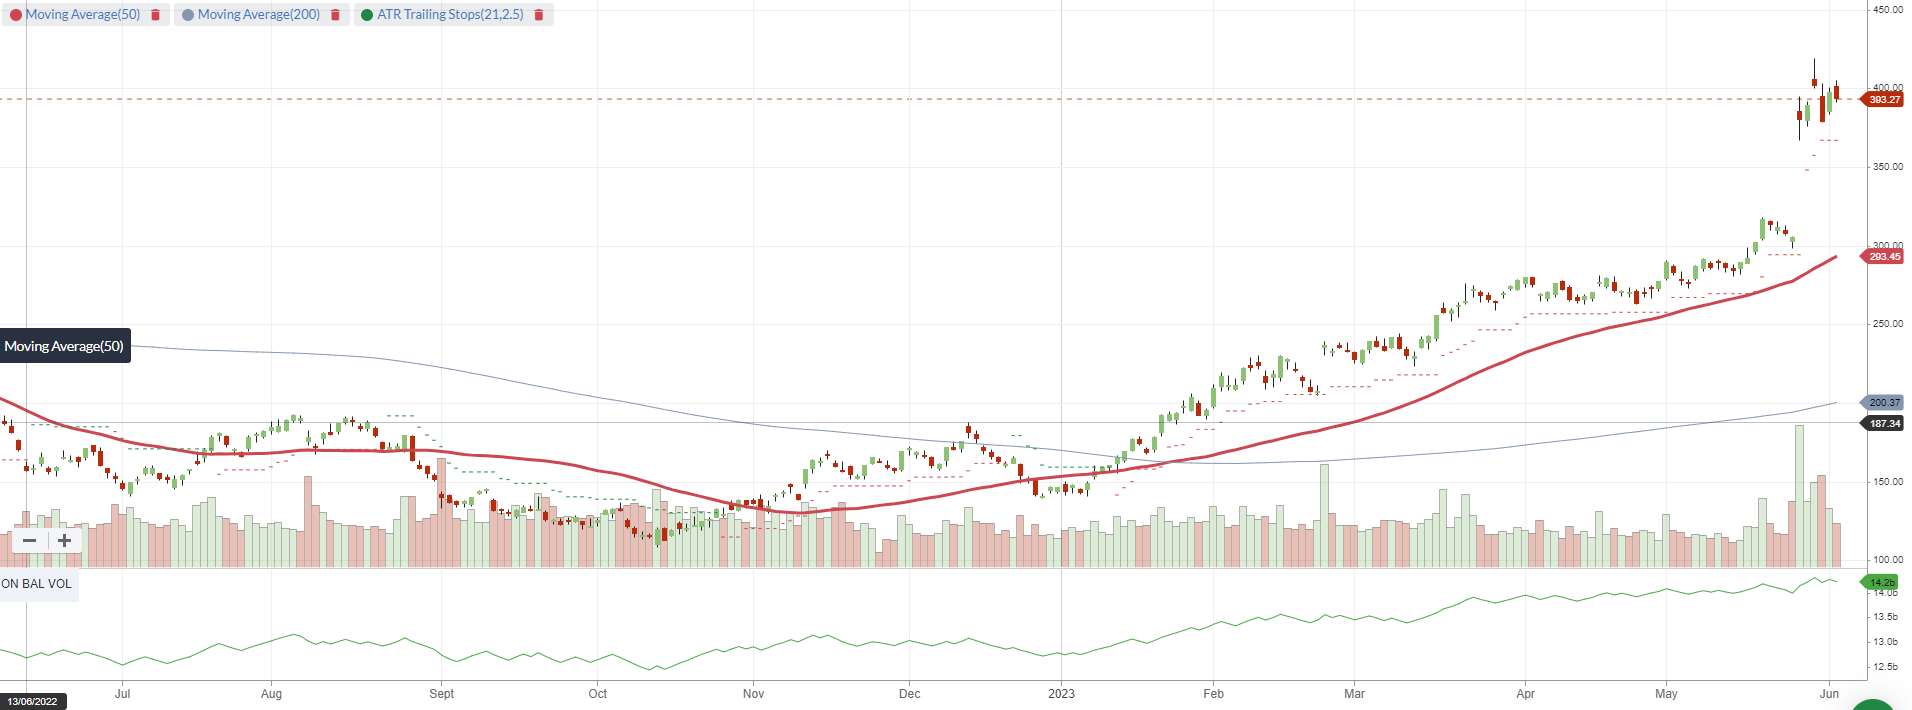
US:NVDA Nvidia
While it is true that the overall StockRank has been improving since Feb 23, it is important to remember that much of the latest run is driven by pre-emptive thoughts on AI and how the company will benefit. But whether it is AI, Metaverse, NFTs or whatever, this sector has a history of getting ahead of itself and investors will always want to be cautious that strong Momentum shifts can be undone. This extends to all stocks in the sector that have had a good run recently on the back of the US tech rally.
For what it is worth, I think NVDA will need to come close to filling the gap to US$300 before resuming the positive run it has experienced thus far in 2023. Be sure to have fun, just remember to protect your capital / profits.
From a global equities perspective we continue to remain exposed to stocks, and we should all feel a little more relieved (though always on alert.)
AUS S&P/ASX 200
Another week where not much happened from point to point, though during the week it was a different story. For the record the ASX200 fell just the -0.14% or 9.4 point to 7145.1
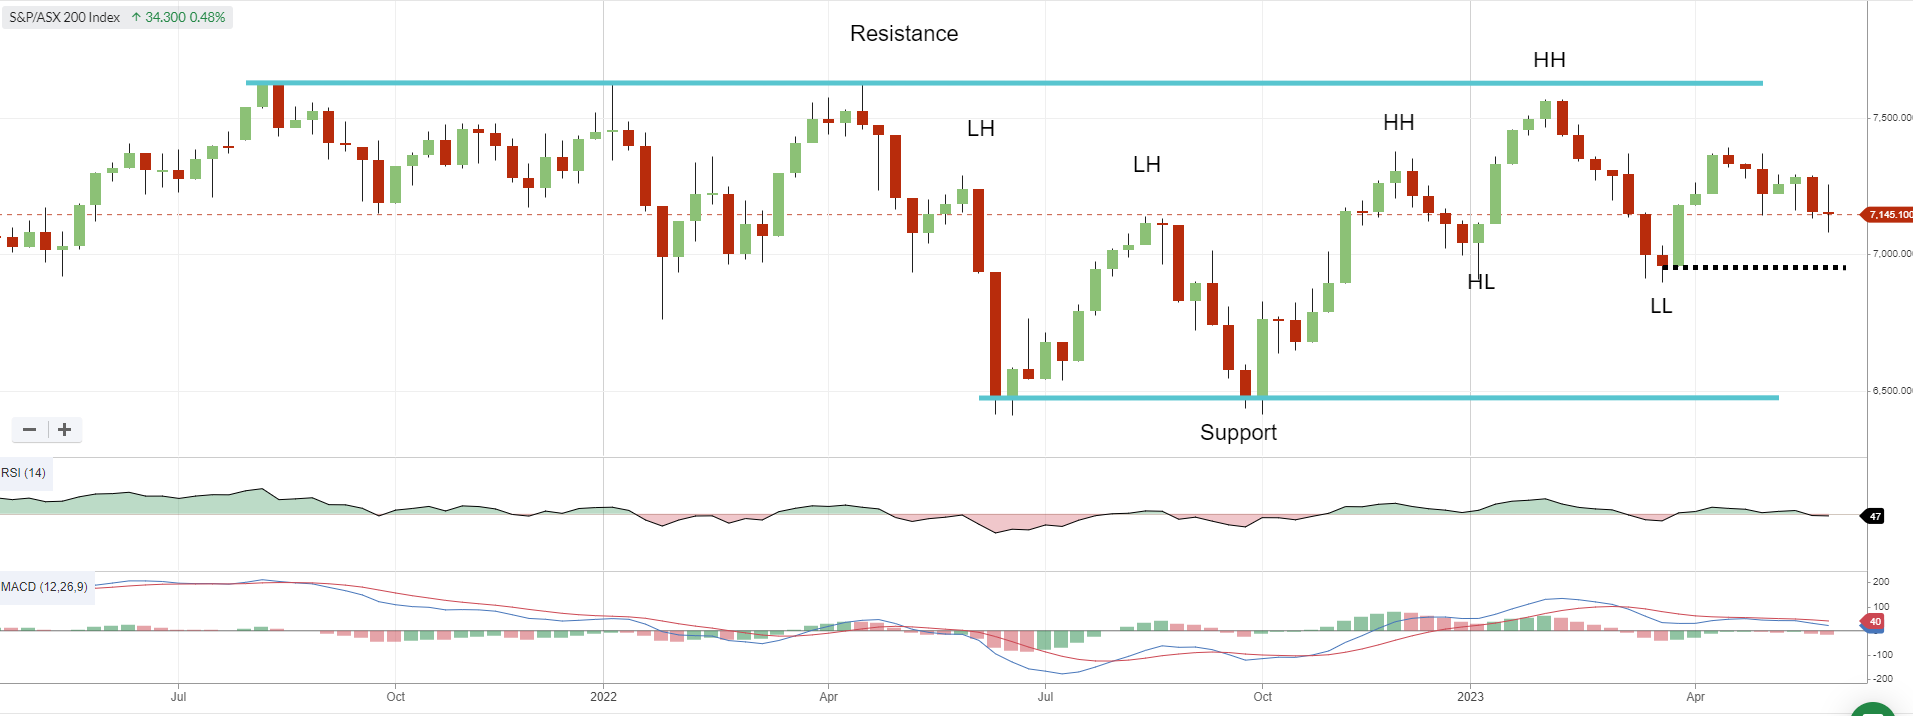
S&P/ASX200 Weekly Chart
It is clear that while there is no immediate change to domestic investing sentiment, we are clearly more pessimistic than our global counterparts at the minute and if anything, the chart has a sluggish feel to it with a bit of downside bias (which is supported by the weekly RSI at 47).
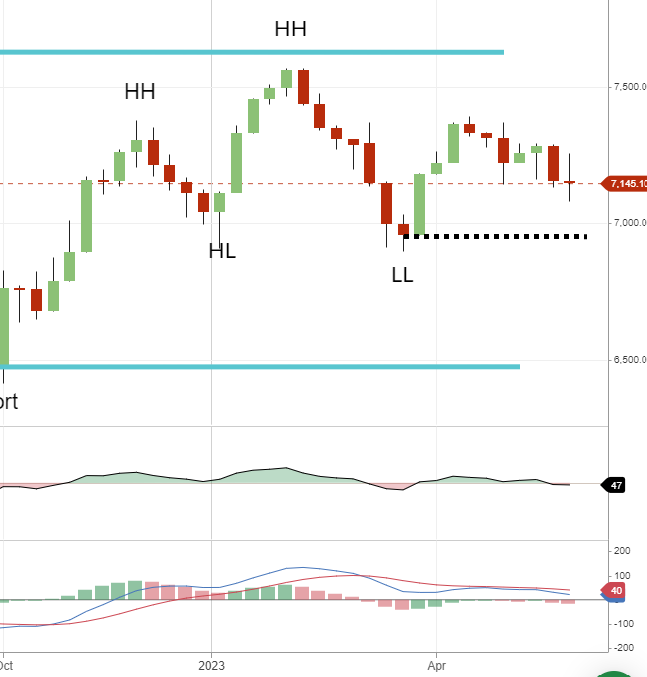
S&P/ASX200 since October 2022 Weekly Chart
The recent inflation number coming in higher than expected coupled with the minimum wage decision have many now increasing the likelihood of a further rate rise in June which impacted sentiment somewhat. Further China’s economic woes also dragged us down, though there is ‘hope’ stimulus may come.
As previously mentioned, I am not particularly concerned about the market at the minute for as long as we stay above 6995 as an immediate catalyst, though there will really not be a change in my approach to stock selection should the index stay above 6474.
One thing I will mention though is that investors in retail stocks do need to be careful at the minute. A spate of updates from stocks like ADH, MHJ, DSK, UNI etc are telling us that foot traffic is down.
If a retail stock your are holding hasn’t updated the market recently and you are holding it based on a Momentum strategy, be very aware that there is a strong risk that any update in the near term will be negative and you have to therefore form the belief as to whether your company is going to be excluded from such pressure.
Listen to what the market is telling you. Case in point is AX1 who has not provided a recent update however its share price has fallen on account of all the other disappointing recent updates. Be sure to keep your exposures in check.
Member corner
In this section we will provide a detailed chart assessment, on a maximum of ten stocks weekly, on companies from those of you in the Gallery.
If no one asks for a stock to be analysed, this section will remain blank.
Also please note, that while we may receive a number more queries than ten per week, we retain the right to save a stock for another week, or ignore it all together.
The analysis will be akin to what was covered under the “Stocks of Interest” within the previous Momentum Monday reports and is highlighted in the Shine Zone area below.
If you have a stock you would like analysed from a momentum perspective, please write it into the comments section below or email us at support@stockopedia.com.au.
<There were no stocks requested to be analysed this week>
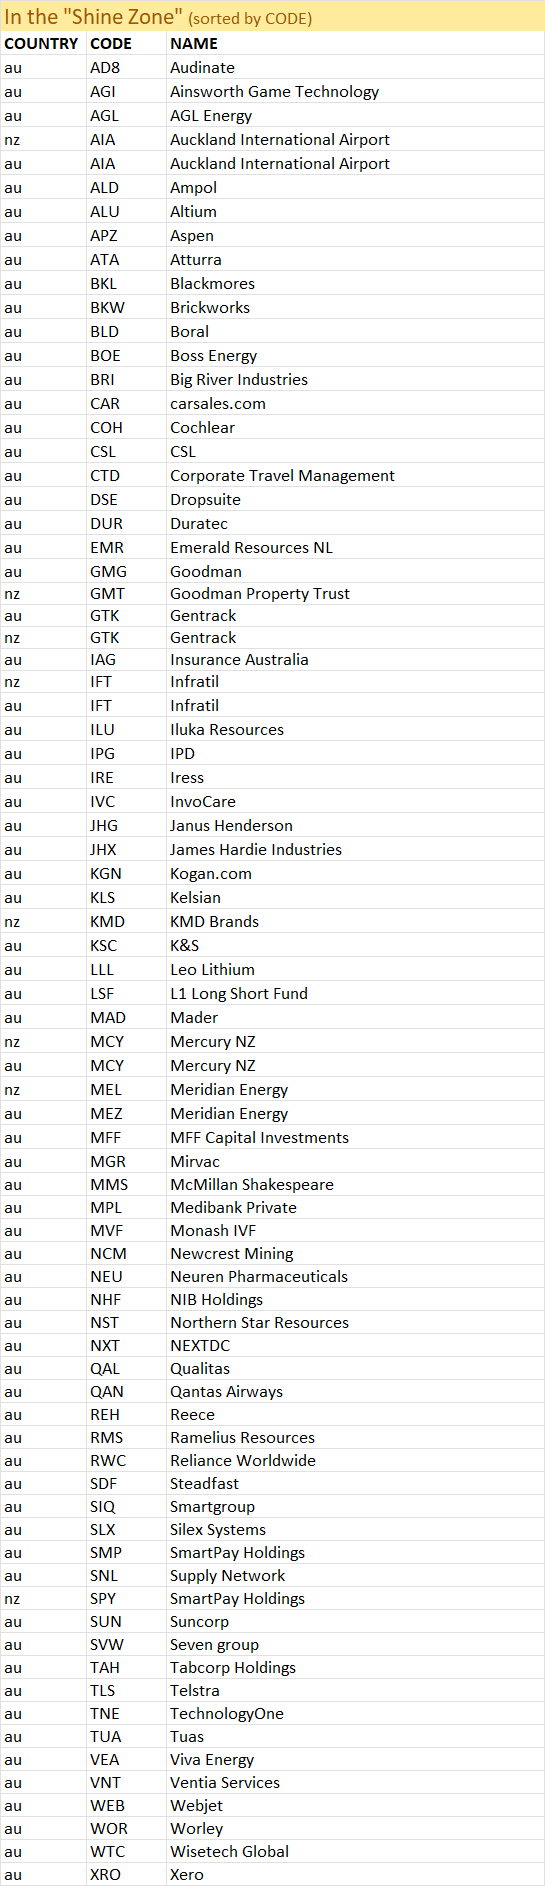
Stocks in the Shine Zone
To learn about the Shine Zone and how to use it, you can read it here.
The rules for inclusion in this list are based on those I like to see in a stock before considering a trade in it:
QM Rank above 80
Price is above the 2.5x ATR
50d MA is above the 200d MA
Price is greater than the 200d MA
Market cap greater than $200M
To reiterate that the “Shine Zone” are rules for possible buying. They are not for holding and/or selling. Read the “how to” article above to learn more
Data is at 2 June and is sorted by the stock code.
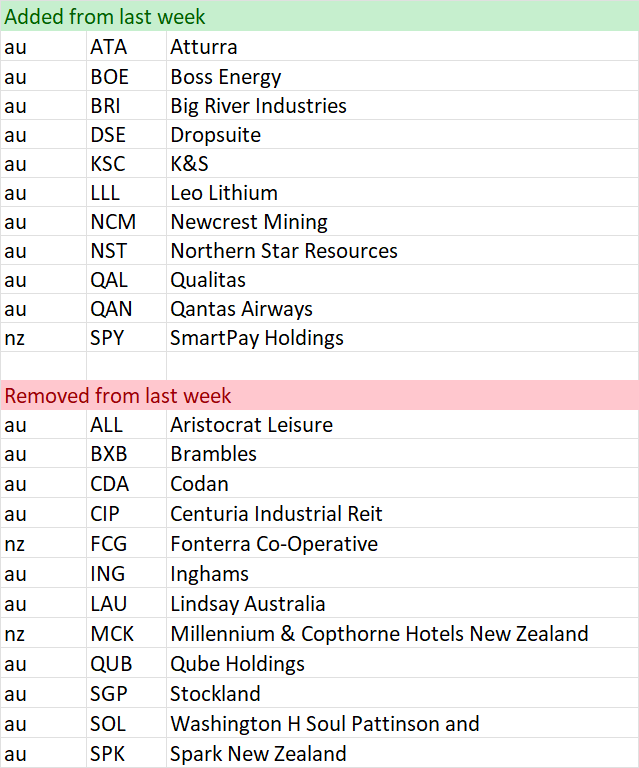
Changes from last week
Shine Zone list as at 2 June
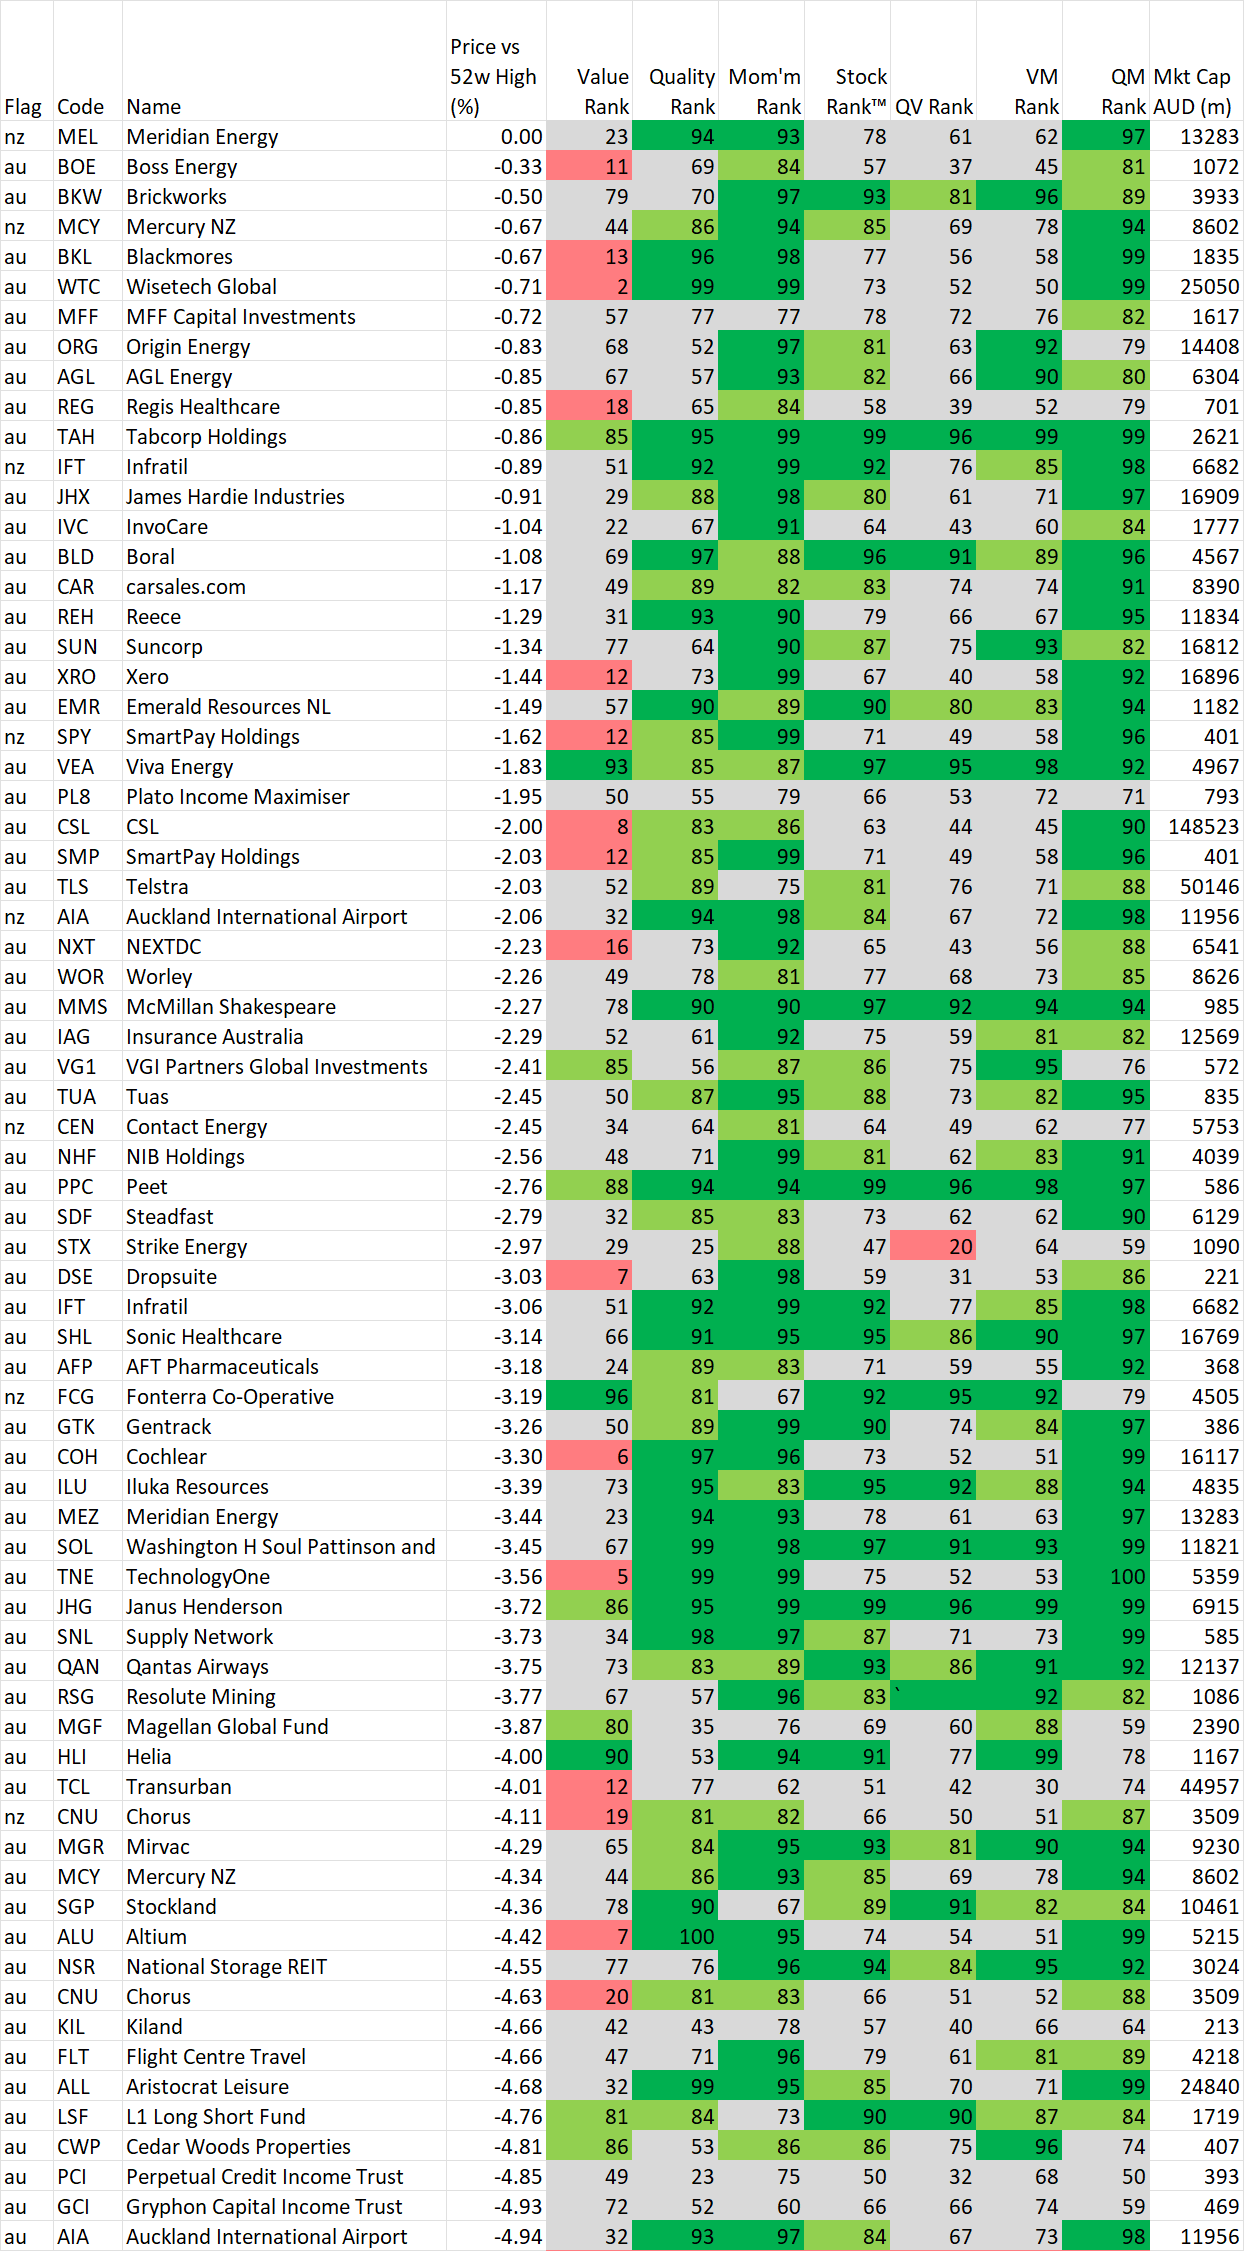
52 week high screen
In this section we identify stocks within 5% of their 52 week high based on the idea, supported by academic studies, that stocks close to their 52 week highs tend to outperform. Weekly changes to the list will also be noted.
If you wish to recreate this screen in the screener select "Price vs 52 high" greater than -5% and Mkt Cap greater than $200M
A stock coming onto the list is NOT an automatic buy, just as a stock that leaves the list is NOT an automatic sell. However movements on this list may alert you to interesting charts so be sure to look at the Stockopedia and the chart first.
Data is at 2 June and is sorted by the stocks closest to their 52 week high.
And remember, past performance is no guarantee of future performance.
Changes from last week
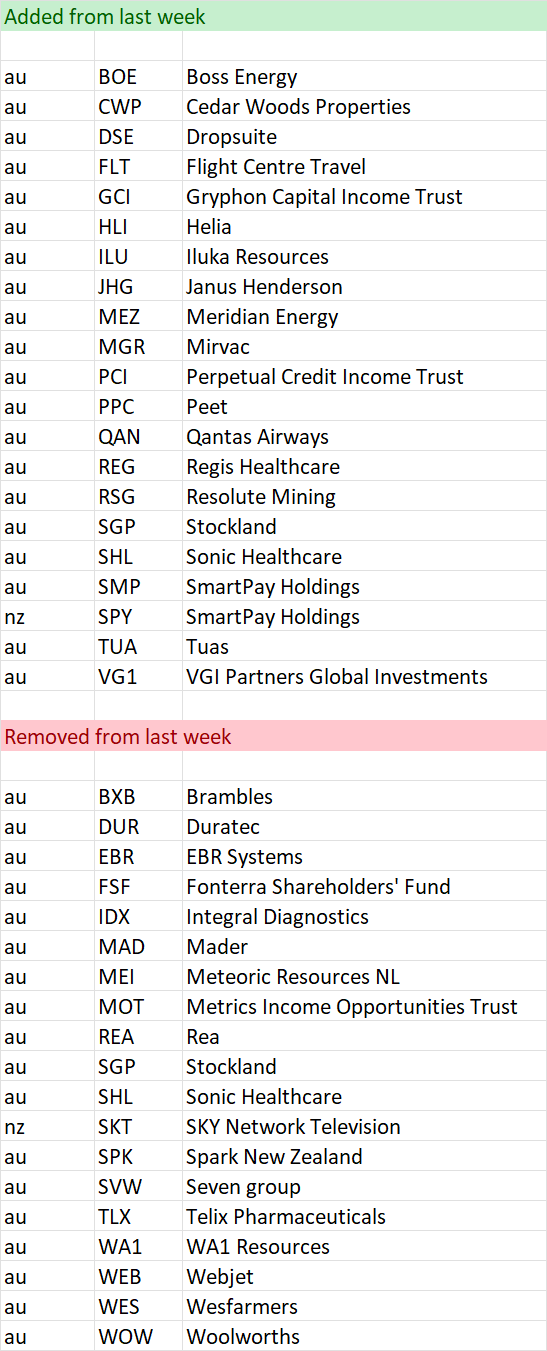
Stocks within 5% of their 52 week high as at Jun 2, 2023
Important Information: Stockopedia Ltd ABN 39 757 874 670 UK business registration number 0637267 (“Stockopedia”) is an Authorised Representative of Daylight Financial Group Pty Ltd ABN 77 633 984 773 (“DFGPL”) which is the holder of an Australian Financial Services Licence (AFS Licence No. 521404).
Information in this commentary is current as at date prepared unless otherwise stated. However, please bear in mind that investments can go up or down in value, and that past performance is not a reliable indicator of future performance. For more Important Information please refer to the Disclaimer section of this website.
This communication may contain general financial product advice. It has been prepared without taking into account your personal circumstances, and you should therefore consider its appropriateness in light of your objectives, financial circumstances and needs before acting on it.
If our advice relates to the acquisition or possible acquisition of a particular financial product, you should obtain a copy of and consider the Product Disclosure Statement (PDS) before making any decision.
The author holds interests in companies listed in the data tables . This position can and will change at any time without notice.
Disclaimer
This is not financial advice. Our content is intended to be used and must be used for information and education purposes only. Please read our disclaimer and terms and conditions to understand our obligations.
3 comments
Suggest Xero please. xro.asx
I'd be interested in your thoughts on the DTL chart. It looks like it's topped out and has crossed under the ATR. Would a stoploss just under $7 be appropriate?
I would be interested in your thoughts on HLI. They have a very high operating margin . Is this sustainable