Momentum Monday 7th August

Welcome to Momentum Monday, in what was an extraordinary week which saw the world’s largest economy receive a credit downgrade which caused disproportionately small ripples in some markets . More on that in a moment. We also started reporting season the usual sedate way with a big downgrade to RMD on margin compression. Likewise, more on that in a moment.
Things started to pick up pace a little next week. So be sure to access your reporting season calendar here.
And don’t forget our “Empower Others” program which you can read about it here

The content for this week's edition is as always:
Broader market sentiment
Member corner
Stocks in the “Shine Zone” (including changes)
52 week high screen (including changes)
Remember you don’t have to read all this contribution. Simply scroll to the area of interest. And of course if you are not interested in Momentum, have a great day!
Broader Market Sentiment
We look at the direction of both the US and ASX markets to gain an understanding of the broader sentiment at the minute. It is important to stress here that I DO NOT use this to time my entry or exit out of stocks. I prefer to use the individual charts of stocks to do that. However I find it useful in helping us determine how aggressive/cautious traders should be in their trading. In short the more positive the broader market is the more risks you can take and vice versa.
US / S&P500
After last week’s new short-term higher high, the market pulled back a bit , falling 2.3% for the week, to notch its worst weeks since March, not that this changes the view that the target is the all-time high of 4766
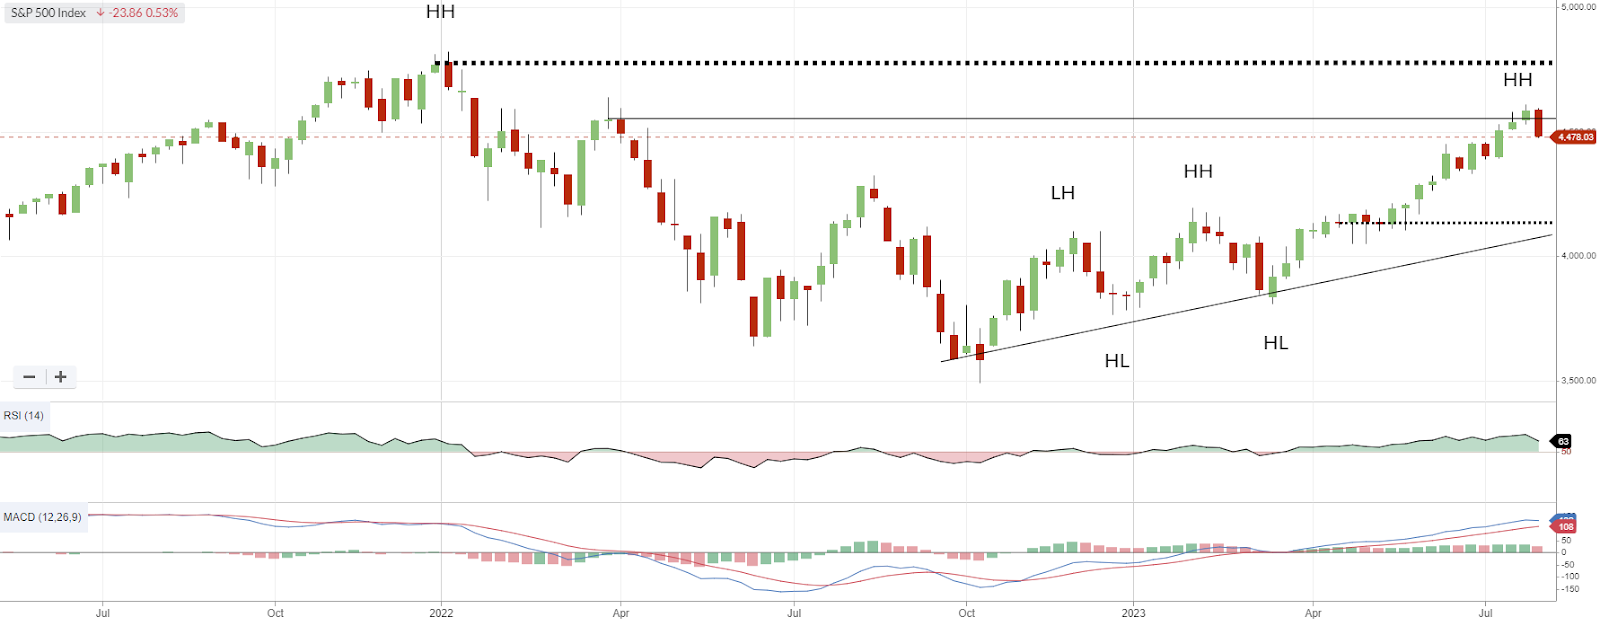
S&P500 Weekly chart
It is totally normal for zig and zags to form in an upward move so at this point, one week does not raise any concern. Nor really should it if we see two or three consecutive weeks of pullbacks. Had it kept moving in a straight line in a north-easterly direction the trend would be spread too thin, making it susceptible to even bigger pullback. For those looking for further comfort, the pullback we saw in March for the week formed the base from which the 2 month run was borne so fingers crossed that repeats.
Not much has changed with the look of the chart in terms of support/resistance lines, but there has been one minor adjustment, previous short term support was flagged at 4056, however that level has been moved up somewhat given the strength of the recent run. So we have lifted that level to 4124. This coincides with the closing prices of around mid April to early May where price hovered around this level before the next move up. And in a few weeks it will converge with the uptrend line formed from the Sep-Oct 2022 low. When looking at charts there is a belief by some that points of convergence of lines are points of significance and in this instance, could prove a point of support if price pulled back that far.
Pleasingly a little steam came out of the RSI this week, coinciding with the price drop. Trends to be stronger the less overheated they are.
The big macro news of the week was credit agency Fitch downgrading the US from AAA to AA+. Why anything is different now with US$32 Trillion in debt vs US$31 Trillion in debt is beyond my simplistic understanding. Nevertheless, here we are. To be fair the agency has pointed to political issues more than economic ones but it still looks strange. Whilst most commentators are quick to dismiss the broader impact, the fact of the matter is it is the first downgrade of US government debt since Standard and Poors (S&P) downgraded to AA+ in 2011

Source: Thomson Reuters
The impact of such a move is not expected to be too significant in the immediate term, as debt guaranteed by the largest government running the biggest economy, within the most liquid market in the world, is still the most important thing.
Of course whether this changes if either S&P or Moody’s start to question their ratings would be interesting. But for now I am of the view that the market needed a reason to pause and this was as good a reason as any. That said, bond prices did fall during the week, mainly because the US government was about to re-start its quarterly sale of longer-term debt for the first time in more than 2½ years, as it looks to sell $US103 billion ($157 billion) of longer-term securities.While the Fitch downgrade is sighted also as a possible contributor (ie downgrade = higher interest rate = fall in bond prices),one suspects the sheer weight of new debt being issued at higher current rates is more likely the issue.
The other bit of news that sets up a big week next week was the payrolls report which showed 187,000 jobs were added in July (less than the 2000,000 expected) and the unemployment rate also ticked lower to 3.5% from 3.6%. While this will add to the Goldilocks scenario we spoke of last week, we are due to receive CPI this week. For the minute, most expect the Fed to keep rates on hold. This number may change (or reaffirm) perceptions.
But the stunning results of Amazon smashing analyst estimates in the latest quarter and delivering a buoyant outlook show that the US and global economy is still doing well, so for those that want to cut through the noise (like me), there is no immediate need for concern.
Also the busiest week of the US quarterly reporting season sees the expected pullback in earnings not as bad as first feared and of the 84% of S&P 500 companies that have given results, 80% have surpassed expectations in line with previous years. (According to FactSet)
We remain exposed to shares globally.
AUS S&P/ASX200
Just when we thought we had some clean air ahead of us, the market took a breather this week with the S&P/ASX200 pulling back 1% following losses during the middle of the week.

S&P/ASX200 Weekly chart
As frustrating as this is, it is not unexpected following the rise over the past three weeks. Pullbacks (zig and zags) are totally normal, and as articulated above, almost essential when looking for sustained runs.
Our targets of a potential retesting all-time high levels of 7628 remains a strong possibility. So to are the levels of short term support in the range of 6995 and 7038.
There was also a great example on Friday of how the market moves the way it wants to, ignoring some of the macro markers. The Reserve Bank cut its near-term growth forecasts as a result of the recent rapid interest rate tightening cycle. It now expects gross domestic product (GDP) to expand by just 0.9 per cent in 2023, down from its previous forecast of 1.2 per cent and below the current rate of 2.3 per cent. Yet the market went up on Friday.
Early on in the week the RBA made the decision to keep rates on hold, but no one was fooled that this is likely to be the end of the rate rising cycle for now (hence the likely weakness in markets earlier in the week.) The RBA (irrespective of which Governor sits in the chair) is still not achieving its inflation goals with inflation still too high at 6% and unemployment still below full employment. Will the rate rise come next month as Governor Lowe holds his last Board meeting in order to make it easier for new incumbent Michelle Bullock? Time will tell. Corporate earnings in Australia will have a big say in that, and there will be plenty of information for the RBA to digest this month.
By its own admission it feels that inflation has most likely peaked and remains headed back to within the 2 per cent to 3 per cent. But before you crack the Champagne (or cheaper Prosecco) open, they expect to return to the range by the second half of 2025 and inflation is “cumulative” so I am afraid that it may be a little early to call an end to the real world impact.
As mentioned last week, we are closer to testing resistance than we are testing support, so we remain in equities.
Member corner
In this section we will provide a detailed chart assessment, on a maximum of ten stocks weekly, on companies from those of you in the Gallery.
If no one asks for a stock to be analysed, this section will remain blank.
Also please note, that while we may receive a number more queries than ten per week, we retain the right to save a stock for another week, or ignore it all together.
The analysis will be akin to what was covered under the “Stocks of Interest” within the previous Momentum Monday reports and is highlighted in the Shine Zone area below.
If you have a stock you would like analysed from a momentum perspective, please write it into the comments section below or email us at @stockopedia.com.au
ASX:RMD - ResMed Inc
StockRank 69
Momentum Rank 89
QM Rank 95
VM Rank 52
A$30.70
Last Friday Resmed (ASX:RMD) reported their latest annual result. Unfortunately the market was not a fan, though it was able to rebound from intra-day lows and close near where it opened 9.3% - its worst daily move in3 years.

ASX:RMD 1 year Daily chart
I mentioned the messy chart and that is because the price essentially follows what its Nasdaq listing does. And in not so good news, the price fell 18% in the US on Friday therefore expect further selling on Monday once trade resumes.
At the heart of it, this was not a bad result. Revenue increased by 18% to US$4.2 billion and profit rose 13% to US$307 million.
But revenues came in below expectations in the fourth quarter and according to gross margin contracted 80 bps to 55.8%. While the company says that this was mainly due to unfavourable product mix and higher component and manufacturing costs, partially offset by an increase in average selling prices, it caught many unaware who were actually expecting an improvement. Especially as in the previous quarter the company had seen a 150 bps contraction. Some may worry that the company is on a margin tightening cycle despite what should have been a good operating environment given issues at a competitor, and therefore have been pre-emptive.
Therefore expect to see some write-downs in analyst expectations over the coming days. Especially as the conviction of brokers had risen over the last 3 months prior.

Taken from RMD:NDQ StockReport
There are a few further concerning aspects about the recent fall, beyond the obvious. The first is that the price decline takes it to 52 week lows. Further, the big sell-off on Friday was matched by a massive spike in volume, it was the largest trading day since 2016. Such a heavy move would normally suggest a strong lack of conviction. But it may also have been in anticipation of coming moves on the Nasdaq which are often more volatile (as we saw on Friday.)
Fundamentally the selling looks overdone (especially in the US) relative to the strong result (margins withstanding).
However from a chart perspective the current position is not great. Perhaps there will be an opportunity for a more elegant exit in the near team as some bargain hunters in the US step it but the stock is closer to support on a long term chart than resistance.

ASX:RMD Weekly chart 5 years
From a day trading perspective, the price broke through support and 52 week lows write their own outcome. From a shorter term perspective, as disappointing as Friday’s price action was, a close above $30.44 is required, but more relevant in my view is $28.30 low of May 2022. If it fails to hold that by the end of the week then downside targets are back towards the $23 mark. The best case scenario is the price goes back to being stuck in the $28 - $35 range.
Either way, such moves can happen at this time of year. That is why we have diversified portfolios, because as chartists, it makes it easier to dust ourselves off when one goes wrong.
ASX:ABC - Adbri
StockRank 92
Momentum Rank 99
QM Rank 94
VM Rank 91
A$2.52
A company that has experience a renaissance in recent times is Adbri (ASX:ABC)

ASX:ABC 1 year Daily chart
Much of this was driven from the company’s AGM when they shared that, “as a result of the combination of market forces and management initiatives, underlying Net Profit After Tax for the period ending April 2023 is significantly above January to April 2022. “ which only makes sense given that despite rising cost pressures, building supply materials business can at the minute virtually charge whatever they like.
But “one sparrow doesn’t make a summer” and I feel more time needs to play out before claiming victory on ABC.
First it is important to note that the recent rebound has only closed the gap formed from the price decline at the end of August last year. Further this has been on a very long term downward move (since 2018)

ASX:ABC Weekly chart 10 years
For me to consider it at this point I would want to see the price cross above $2.66. That would see it create a new short-term higher high, thus providing some evidence that the sell off has at the very least settled. Should it be able to do that and stay above $1.90 on any pullback then that would provide further confidence the downtrend may be over.
There is a significant level at $3.90-$4.00 that the stock has seen activity in the past. That would be my next target. But there is a lot of work to do.
ASX:DUG DUG Technology
StockRank 78
Momentum Rank 96
QM Rank 93
VM Rank 73
A$1.57
DUG Technology (ASX:DUG) for the minute continues to forge ahead

ASX:DUG 1 year Daily chart
It would be in the Shine Zone list from the $0.80 odd level, however market cap is for the moment below $200M. That said, it is quickly appreciating that level.
Straight out of a textbook this one. A series of higher highs and higher lows = uptrend.
It is at 52 week highs and company developments seem positive. For those unaware, DUG is a high-performance computing for high. For those members who joined us from our previous Spotee Connect service will remember this business was talked about and in my view stands to be a real beneficiary from the AI renaissance many are calling out, as it allows companies to set up and run systems without the capital overhang normally required.
For those yet to jump in yet, there is minor gap on the 17th July to fill. That was a day before the company announced that the West Australian government had committed $5M (or half) of the spend to build the Geraldton data hall. Why is this significant? Because the data hall will have a capacity of 400 petaflops of compute, enabling a thirteen-fold growth in DUG’s compute power once fully established, and according to the company would place the facility amongst the largest supercomputers in the world.
Back to the chart, there may be better buying at the $1.30 - $1.35 range. Stop loss would be at $1.10, the previous higher low. Investors keen to get in now would establish a parachute stop based on their comfort level, as the $1.10 structural level may be too deep to stomach.
Beyond the recent financing news, the company also recently confirmed that the ASX no longer requires it to make available Appendix 4C quarterly reports , a sign of its improving operational performance. DUG offers a unique way to play the “technification of everything” thematic.
Stocks in the Shine Zone
To learn about the Shine Zone and how to use it, you can read it here.
The rules for inclusion in this list are based on those I like to see in a stock before considering a trade in it:
QM Rank above 80
Price is above the 2.5x ATR
50d MA is above the 200d MA
Price is greater than the 200d MA
Market cap greater than $200M
This is a very important point: the “Shine Zone” are rules for possible buying. They are not for holding and/or selling. If a stock falls out of the shine zone, use support levels to set your stops, or instigate a parachute stop if necessary. With markets moving sideways, one expects frequent changes in these lists.
Read the “how to” article above to learn more
Data is at 4 August and is sorted by the stock code.
Changes from last week

Shine Zone list as at 4 August

52 week high screen
In this section we identify stocks within 5% of their 52 week intraday high based on the idea, supported by academic studies, that stocks close to their 52 week highs tend to outperform. Weekly changes to the list will also be noted.
If you wish to recreate this screen in the screener select "Price vs 52 high" greater than -5% and Mkt Cap greater than $200M
A stock coming onto the list is NOT an automatic buy, just as a stock that leaves the list is NOT an automatic sell. As with the shine list, assess every chart on its merits. However movements on this list may alert you to interesting charts so be sure to look at Stockopedia and the chart first.
Data is at 4 August and is sorted by the stocks closest to their 52 week intraday high.
And remember, past performance is no guarantee of future performance.
Changes from last week

Stocks within 5% of their 52 week high as at August 4, 2023

Important Information: Stockopedia Ltd ABN 39 757 874 670 UK business registration number 0637267 (“Stockopedia”) is an Authorised Representative of Daylight Financial Group Pty Ltd ABN 77 633 984 773 (“DFGPL”) which is the holder of an Australian Financial Services Licence (AFS Licence No. 521404).
Information in this commentary is current as at date prepared unless otherwise stated. However, please bear in mind that investments can go up or down in value, and that past performance is not a reliable indicator of future performance. For more Important Information please refer to the Disclaimer section of this website.
This communication may contain general financial product advice. It has been prepared without taking into account your personal circumstances, and you should therefore consider its appropriateness in light of your objectives, financial circumstances and needs before acting on it.
If our advice relates to the acquisition or possible acquisition of a particular financial product, you should obtain a copy of and consider the Product Disclosure Statement (PDS) before making any decision.
The author holds interests in companies listed in the data tables . This position can and will change at any time without notice.
Disclaimer
This is not financial advice. Our content is intended to be used and must be used for information and education purposes only. Please read our disclaimer and terms and conditions to understand our obligations.
No comments yet
No one has commented here yet! Why not be the first one?