Momentum Monday 7th October 2024

Welcome to Momentum Monday.
Congratulations to the fans of Penrith for your win over the weekend. You may need something to pick up your spirits after a down week on Aussie markets… but after four wins in a row I doubt you could be feeling down. The good news is when looking at the chart it doesn’t seem that bad… sounding worse than it is.
Interesting links
This Friday we will hold our Friday “Lunch n’ Learn” session. Book your place at the virtual table today We will be discussing the third quarter results for the NAPS (No admin Portfolio System. Remember…. If you can’t tune in live book your place anyway and we will send you the recording
We have completed the latest quarterly review of our NAPS portfolio that we run as an education exercise. You can read the results here.
Don’t forget to “Empower Others”. There is no better time to refer the award winning platform which is Stockopedia than right now at our best ever rate. If you think there is someone who will benefit from this offer, please reach out and we will send you the link.
For any external commentary we make to the broader market, follow us on Social Media Facebook Linkedin Instagram or X (formerly Twitter) Some of you already have so ‘Thank You’ for that.
If you haven’t already signed up to Podbean or your favourite streaming channel to receive our morning ASX market reports. (ASsuming you know what I even mean)… Click here to signup for it
This week’s content is as follows:
Broader market sentiment
Member corner
Stocks in the “Shine Zone” (including changes)
Momentum Movers (weekly only)
52 week high screen (including changes)
A reminder that you don’t have to read all this contribution. Simply scroll to the area of interest.
Broader Market Sentiment
We look at the direction of both the US and ASX markets to gain an understanding of the broader sentiment at the minute. It is important to stress here that I DO NOT use this to time my entry or exit out of stocks. I prefer to use the individual charts of stocks to do that. However I find it useful in helping us determine how aggressive/cautious traders should be in their trading. In short the more positive the broader market is the more risks you can take and vice versa.
US / S&P500
Well it certainly didn’t feel that way… but the broader S&P500 actually finished up for the week, fueled mainly by the buying all on Friday. By definition this means we also closed the week at a new all-time weekly high.

S&P500 Weekly chart
It is insane to think that unemployment combining in 0.1% less than expected could cause Friday’s run. But there you have it. I more tend to think it is pent up demand and the bullish nature of what we are experiencing at the moment.
For the record the broader index rose 0.22% for the week. An amazing outcome I feel and not a stretch either looking at the chart. Given the strength of what we are seeing it may continue this way to the end of the calendar year.
The price of oil has been the topic "de jure" for the week as it continues to rise from low levels. It is now 12 months since the Militant incursion into Israel and by looking at the chart you wouldn’t know it as the price of crude is still below where it was that day. What really moved the price of crude was on Thursday (Friday morning our time) when in a throwaway line, President Biden said he may support an Israeli attack on Iranian oil fields. Other than the "I couldn't see that coming" fake pictures, this acted like a lighter on a petrol bowser as the price of West Texas crude and Brent Crude rose quite strongly in response. In fact I remember reading that Energy was amongst the S&P500 sectors was actually the best performing for the week. It goes to show me that
I can’t hold my watch and act level at the old level for any longer. This week I move it up to 5408 which coincides with the low at the start of September. But make no bones about it. Sentiment is strong in the world’s largest share market. And I ain’t gonna fight City Hall on this one. I really have not much else to say on this one.
AUS S&P/ASX200
It was a tough week investing on the ASX. But then again it was our first negative week in three on the ASX/200 and last week we came off another weekly and monthly high. So I am definitely not panicking yet.

For the record the S&P/ASX200 fell -0.8% for the week and what grabbed the headlines was definitely the issues facing the Middle East region of the world.
We have discussed the price of oil and what that has meant for the Energy sector domestically and its investors so there is not much more to add. Suffice to say that its sustainability and future direction will be driven by what happens on the chart. Not by what you think.
I find it interesting to read that there has been money cycling out of the Big Banks and into the Big Miners. While I acknowledge the perennial sell moniker which has been placed on the likes of CBA… I find this statement quite strange as I couldn’t think of two sectors with a wider and more disparate earnings streams.
It is important to stress here that there are plenty of non-believers in the price in Iron Ore going up, yet here we are,at multi month highs. The naysayers obviously are pointing to China’s Golden Week celebrations and how traditionally this is a good time for Ore prices, But the economic challenges of China remain - especially in the property sector - and therefore investors should be cautious. I suppose they said as much when the price of Iron Ore was above US$200+ per tonne.
So have we seen a floor in the Iron Ore price over the short term? Maybe. But I think chasing a trade right now may leave your fingers singed. As a momentum investor you know there will be other chances to invest in these names. But of course, if you are current investors in BHP, RIO, FMG et al you will be hoping the bounce can continue.
By extension, if you are invested in any commodity in Australia you will hope this can continue because by extension it has helped many other producers of different commodities as well in the short term.
The chart obviously has pulled back a bit but in my view it is just behaving normally for the moment. I am comfortable leaving my ‘watch and act' level at 7547 for the S&P/ASX200 as I see no need to get overly concerned, remembering our job is not to pick the pointy ends. Just the chunky bits in between.
Member corner
In this section we will provide a detailed chart assessment, on a maximum of ten stocks weekly, on companies from those of you in the Gallery.
We welcome stock requests to be analysed from members. We will also be looking at the charts of some of the more actively researched stocks for the week. We will try to rotate through a selection so as to not make the charts stale, however we will likely not cover a stock within 2 months of when it was last discussed.
If you want to see what has been written about a stock recently, go to the discussion area.

We will not be making up suggestions. If there are no changes to the most viewed list and/or there are no suggestions from members, then no stocks will be covered.
To learn of the methods used to analyse companies in this section, refer to my Momentum Journey series that I articulate here in three parts.
They will help provide context on what I am writing about and the editorial angle of this report.
Also look at the market capitalisation and liquidity before making any decisions!
And again, if you have a stock you would like analysed from a momentum perspective, please write it into the comments section below or email us at support@stockopedia.com.au
IF NO ONE ASKS… HOW AM I SUPPOSED TO KNOW?!?
ASX:UNI - Universal Holdings
StockRank 99
Momentum Rank 99
QM Rank 99
VM Rank 95
A$7.60
This week a number of members were looking at Universal Store Holdings (ASX:UNI) and it is not difficult to see why. It has had an amazing run over the past year in an environment where consumer were meant to be stretched. Yet the results of the business show that when it comes to the spending habits of youth, it is best to focus more on trends rather than reality, because the stupidity… sorry innocence… of youth knows no bounds.

ASX:UNI 1 year Daily chart
Though covered in many forums beforehand, this is the first time we cover it from a Momentum perspective and with a high QM score it's interesting it has taken so long. The latest annual result saw the company soar on the back of a surprisingly strong result. What investors are starting to appreciate is the growth engine which is the US Market with some easy wins to be had expanding over there. While this will only be for a limited time, for the moment things are progressing really well and this has seen a number of analysts upgrade earnings expectations of the stock for the two years ahead. But you didn't need me to tell you that. A stock trading at 52 week highs is obviously doing well. So the question as always is what now?
First, looking at this stock from a long term basis (since listing) we can see that it has been volatile. It's important to note that by the time it hit its all time low of $2.53 the worst impacts of COVID had been felt. Therefore a position in this business needs to be treated with that same level of fluidity.

If you have held them on the recent run up, first well done, and second you may be looking to take some profits here or ideally when price moves closer to all time high levels in a range of $8.10-$8.20.
For those who don't hold the stock, a clean break into all time high levels may be prudent to avoid any possibility of volatility around the historically high level. The narrative for you wouldn't change until there was a breach below $6.42 which coincidentally would see the gap filled that it created in August.
For investors that level is further down at $4.74 . But remember, just like fashion trends, the price trend can move so be conscious of it.
ASX:SGLLV - Ricegrowers
StockRank 99
Momentum Rank 88
QM Rank 96
VM Rank 99
A$9.01
It has been two months since we have discussed Ricegrowers (ASX:SGLLV) from a Momentum perspective. You can read that past commentary here.

ASX:SGLLV 1 year Daily chart
Back then I said, “ Provided it holds $7 then it is in an uptrend. However if you are holding and that drawdown is too steep for you at these current levels then a stop around $8.22 may be appropriate give the strength of the recent run.” The same day it fell below $8.22 just and it bounced back. And then hovered around that level before the recent run.
As mentioned before in and amongst fundamental commentary, the stock is a cyclical one and no doubt has recently seen price support come in the form of Thailand floods which have impacted many rice growing regions over there.
From a price perspective I see no need to change the levels I mentioned earlier that from an investors perspective the trend doesn't change until the price closes below $7. If however you are trading this cyclical business then beyond your parachute stop, the structural level of support is better defined at $8.15 now. But the risk of a double top forming is ever present, so a sustainable break into all-time high levels may be preferred before considering the stock.
For coverage on it Fundamentally be sure to go to the Discussion section for the stock.
Stocks in the Shine Zone
To learn about the Shine Zone and how to use it, you can read it here.
The rules for inclusion in this list are based on those I like to see in a stock before considering a trade in it:
QM Rank above 80
Price is above the 2.5x ATR
50d MA is above the 200d MA
Price is greater than the 200d MA
Market cap greater than $200M
This is a very important point: the “Shine Zone” are rules for possible buying. They are not for holding and/or selling. If a stock falls out of the shine zone, use support levels to set your stops, or instigate a parachute stop if necessary. With markets moving sideways, one expects frequent changes in these lists.
If you feel there is a stock that should be included but is missing please let us know. This is a manual process and occasionally one gets through the cracks
Also look at the market capitalisation and liquidity before making any decisions!
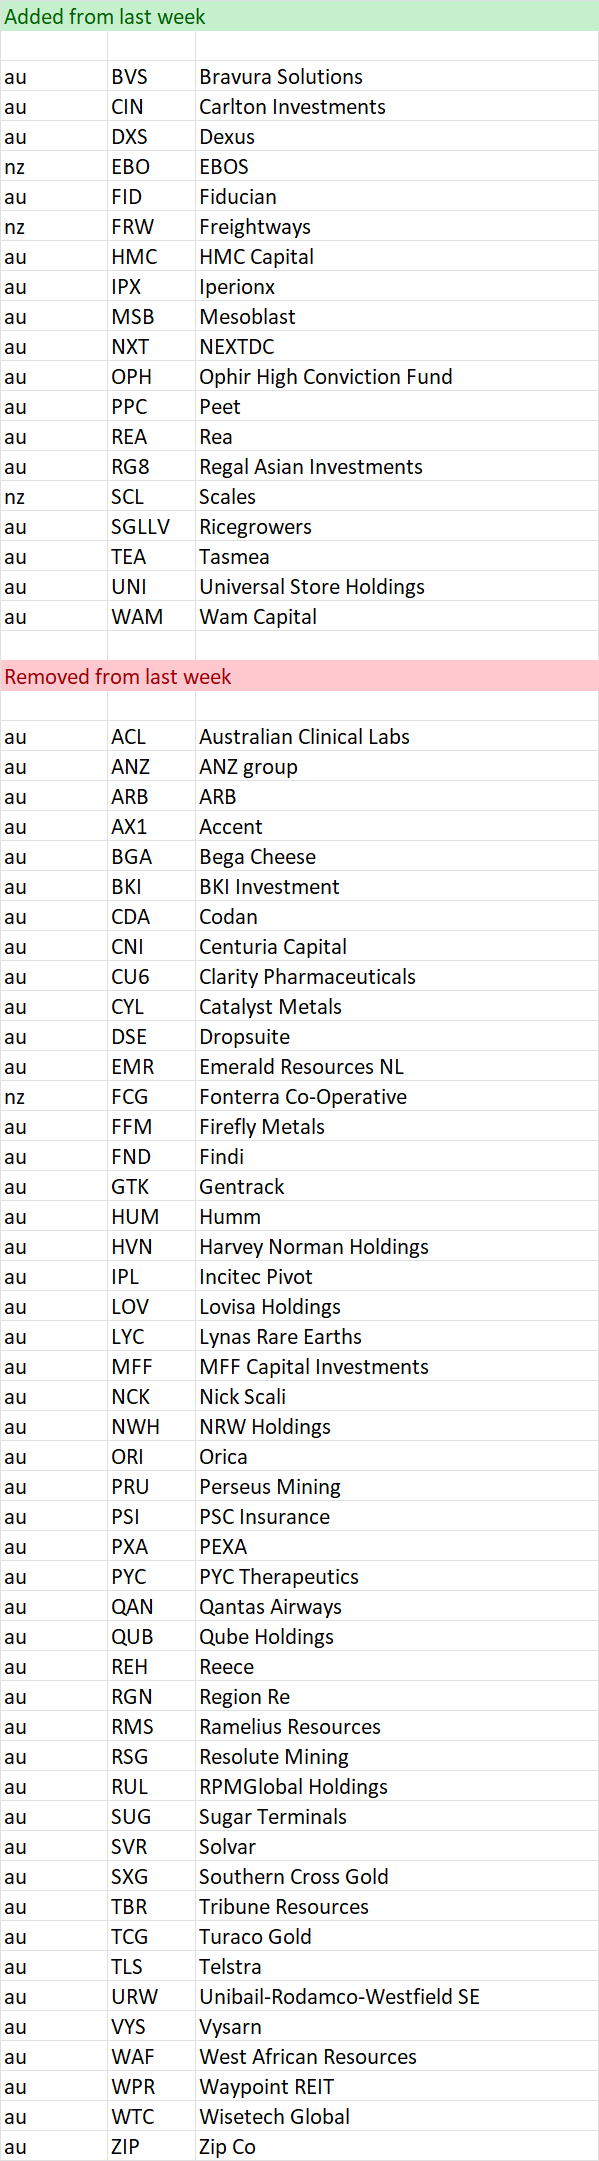
Data is at 05 October and is sorted by the stock code.
Changes from last week
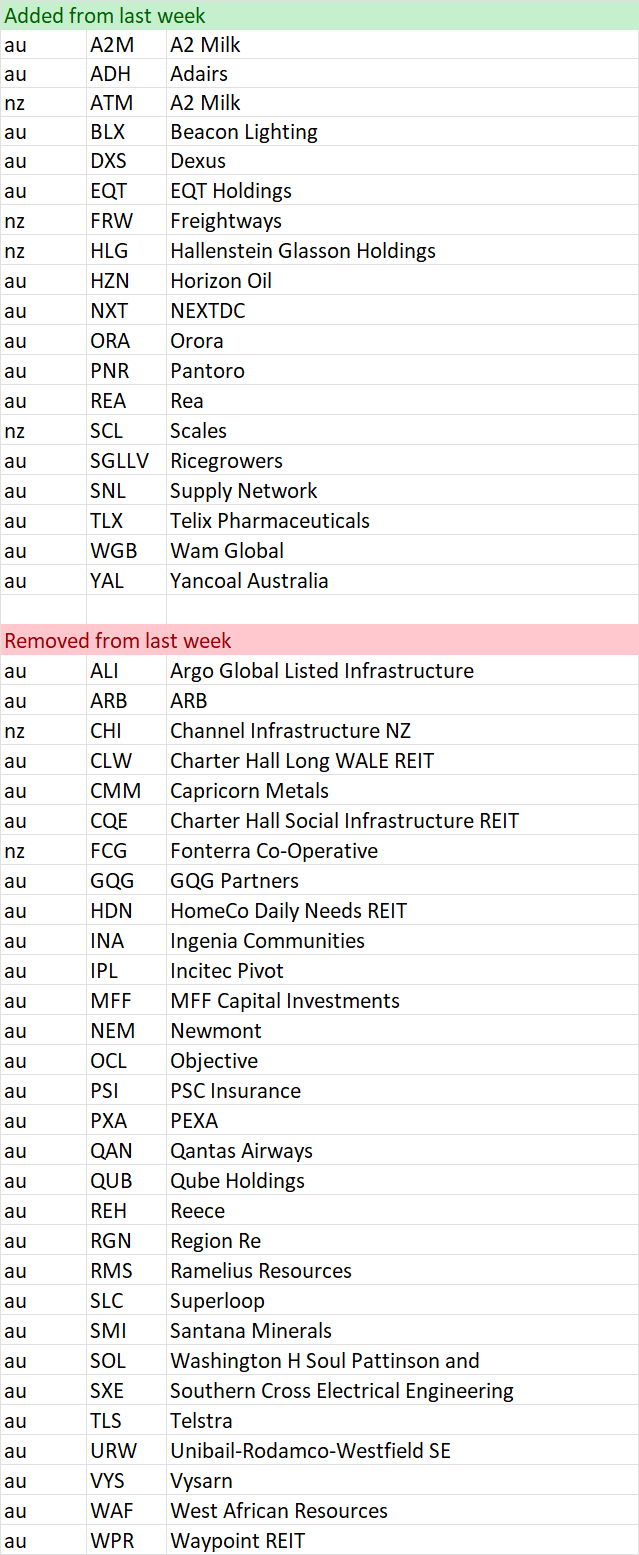
Shine Zone list as at 05 October

Momentum Movers
I have actually published an article discussing my thinking with these tables. You can read about it here.
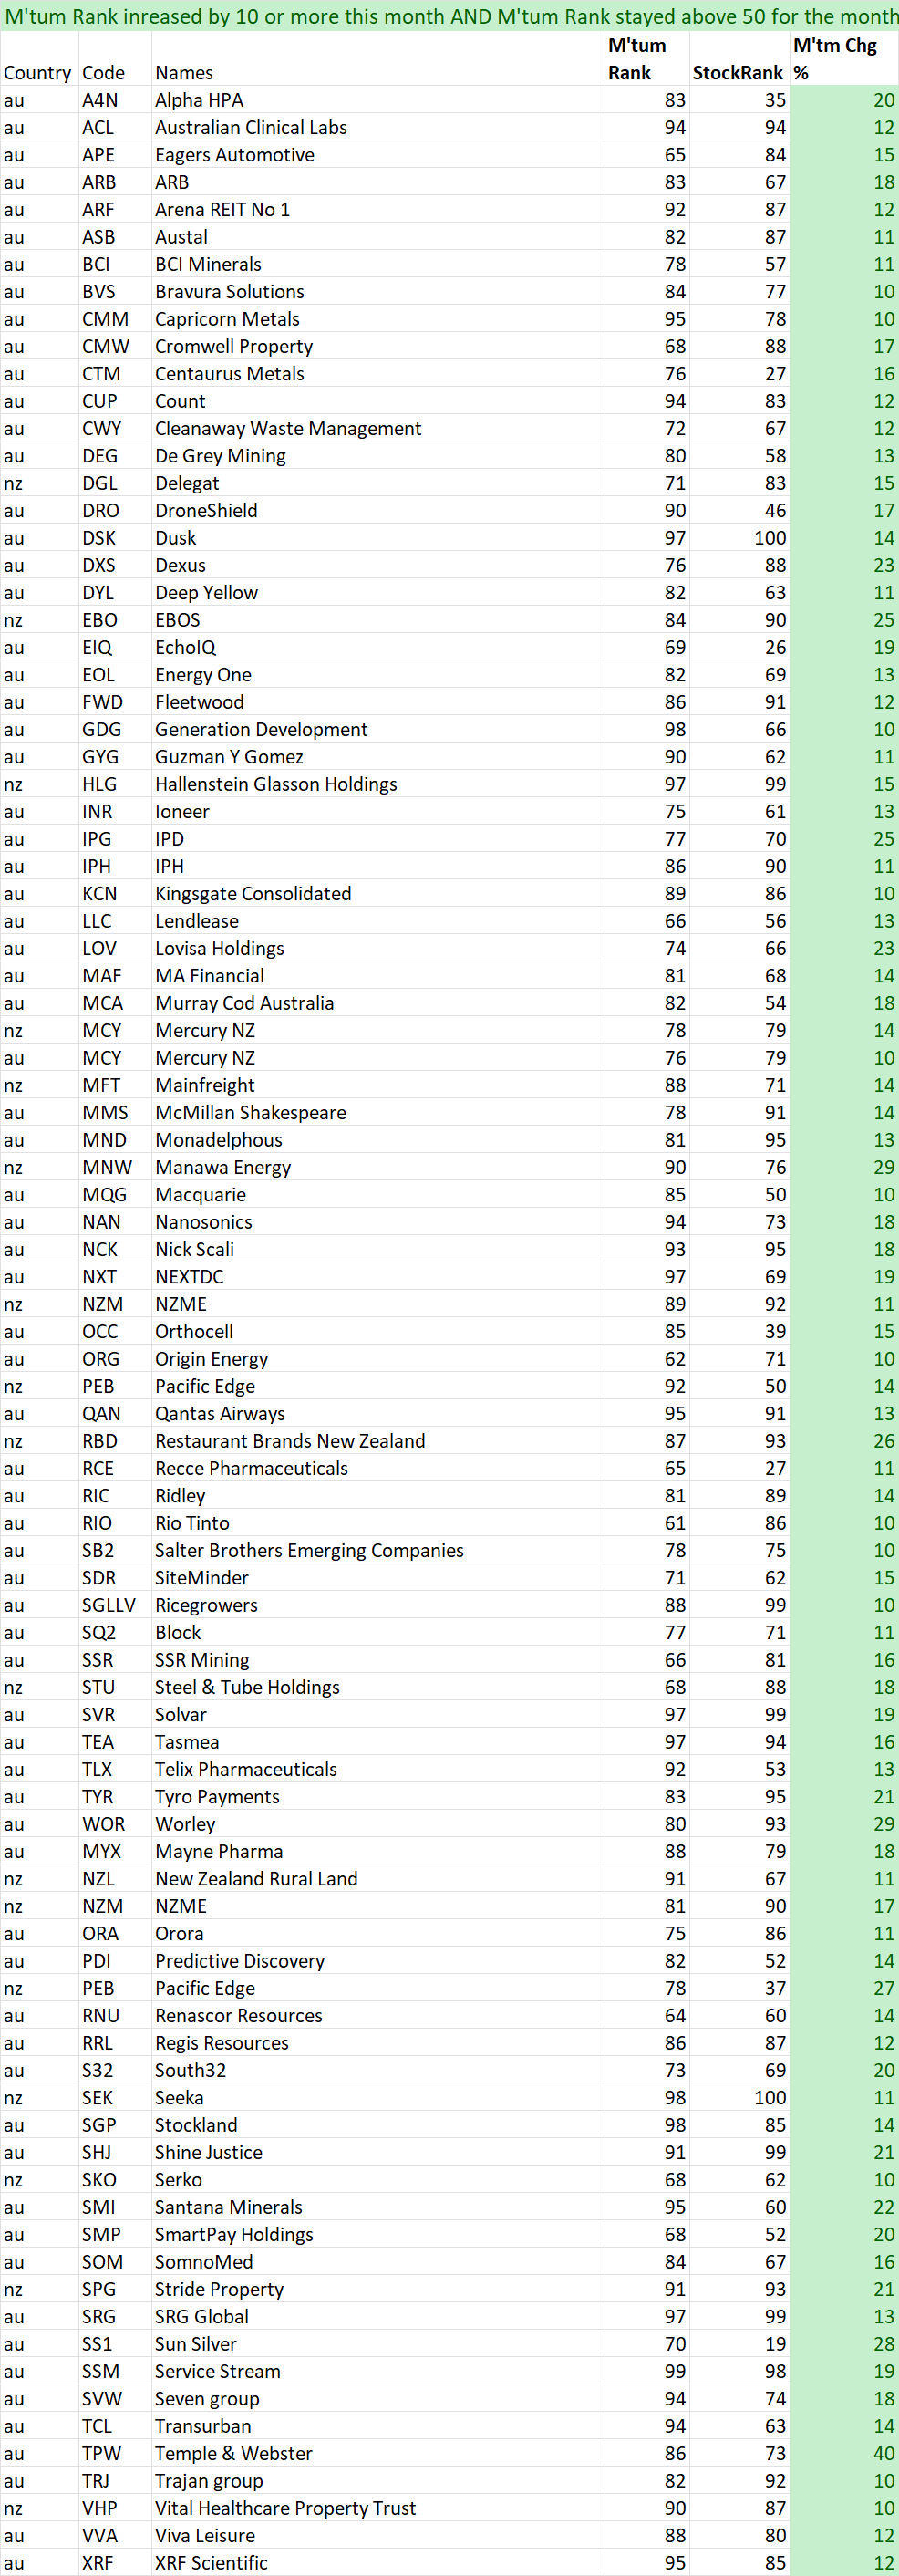
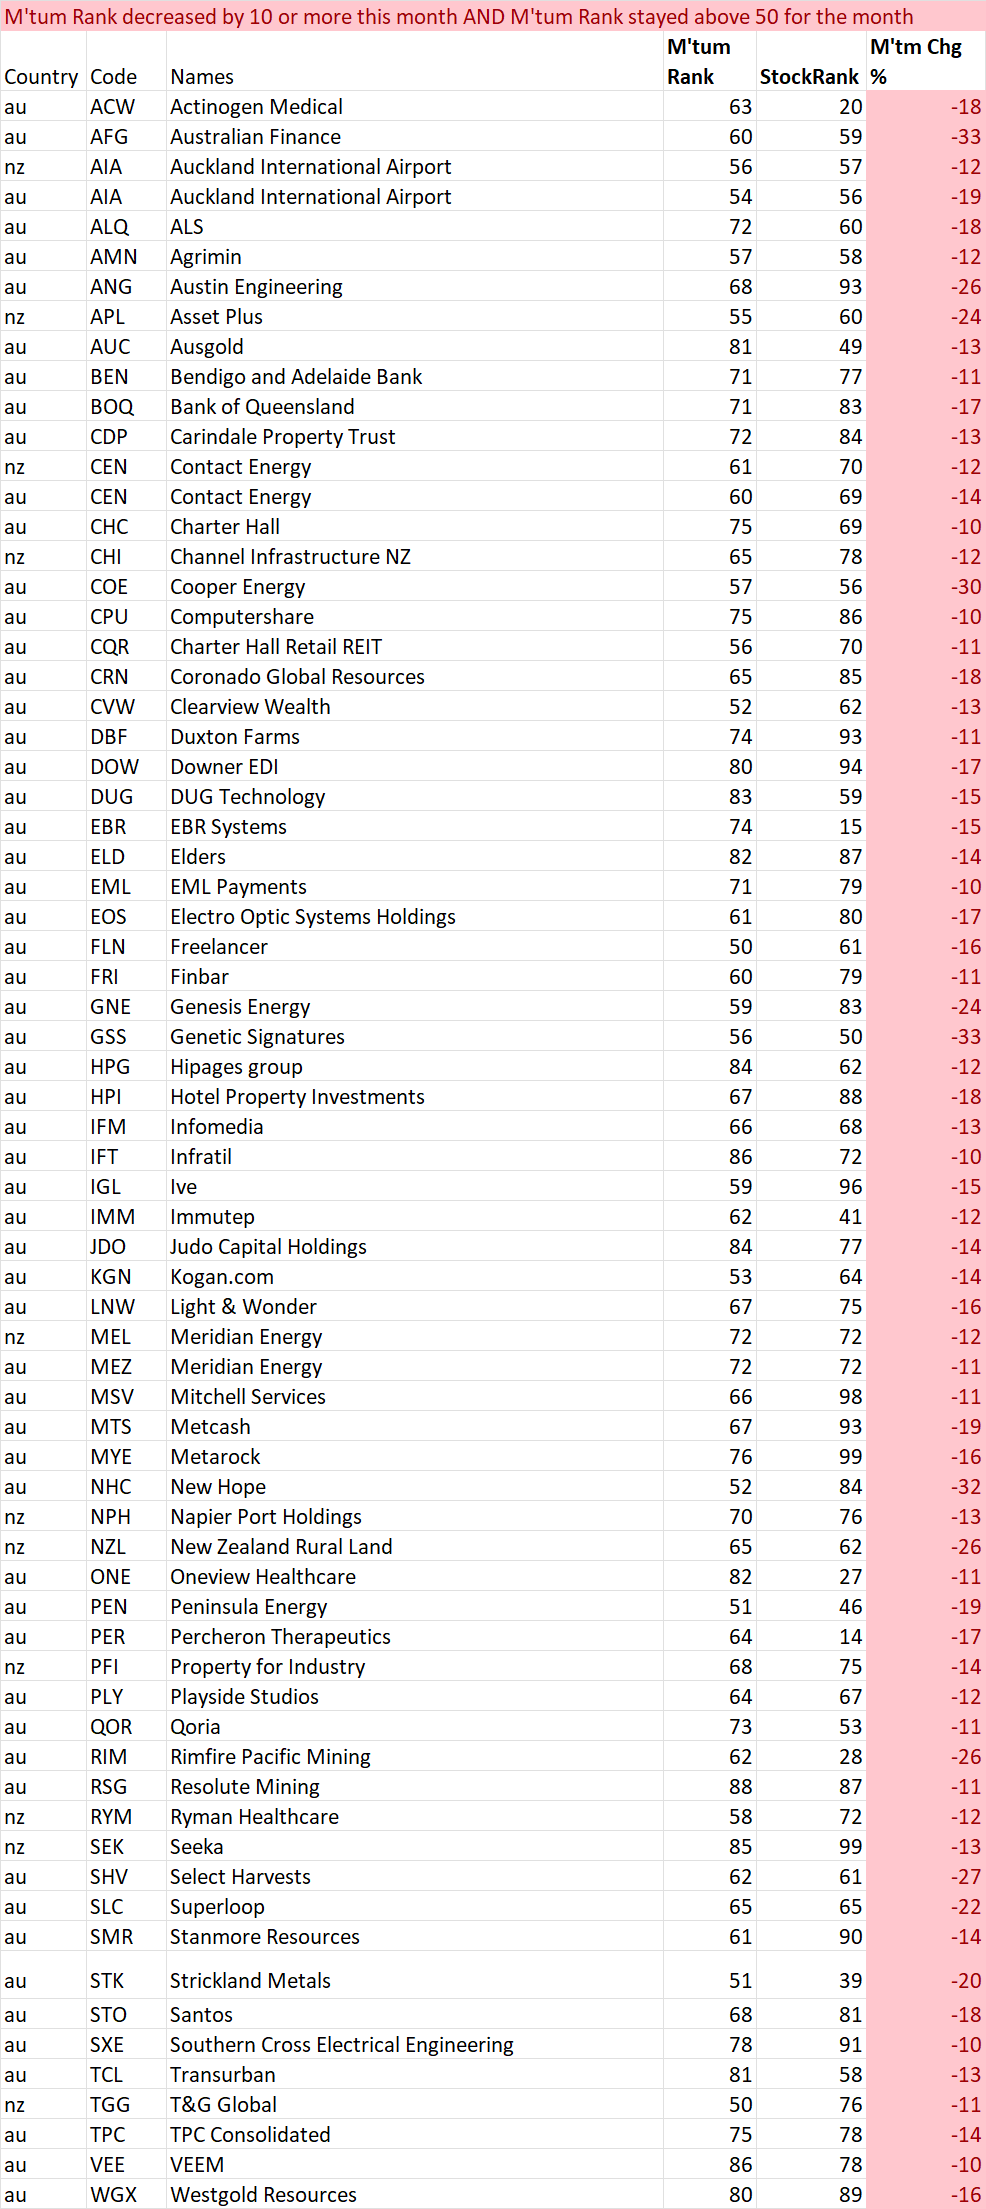
In summary, there is a school of thought that the change in something is just as important as the absolute number itself. Momentum is our most volatile ranking. This section is intended to bring to readers attention the big moves from a Momentum Perspective. As with other lists this is not designed to be a list of stocks that are replicated. Rather it can be a starting point of investigation for further consideration. Initially it will record weekly changes. This will include a monthly change when enough time has elapsed. This section is divided into two lists.
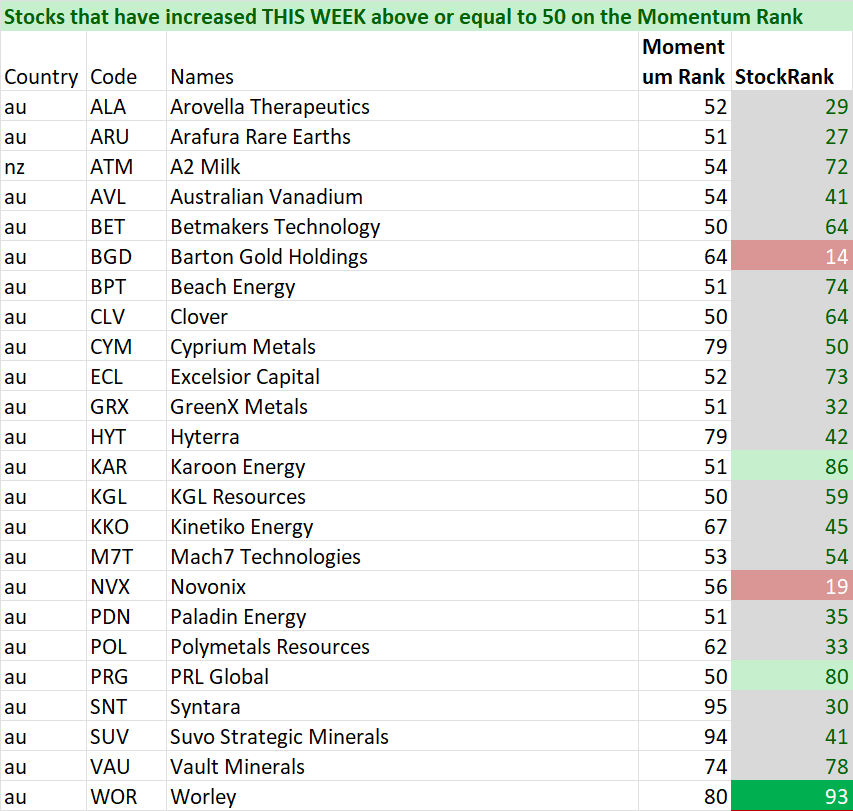
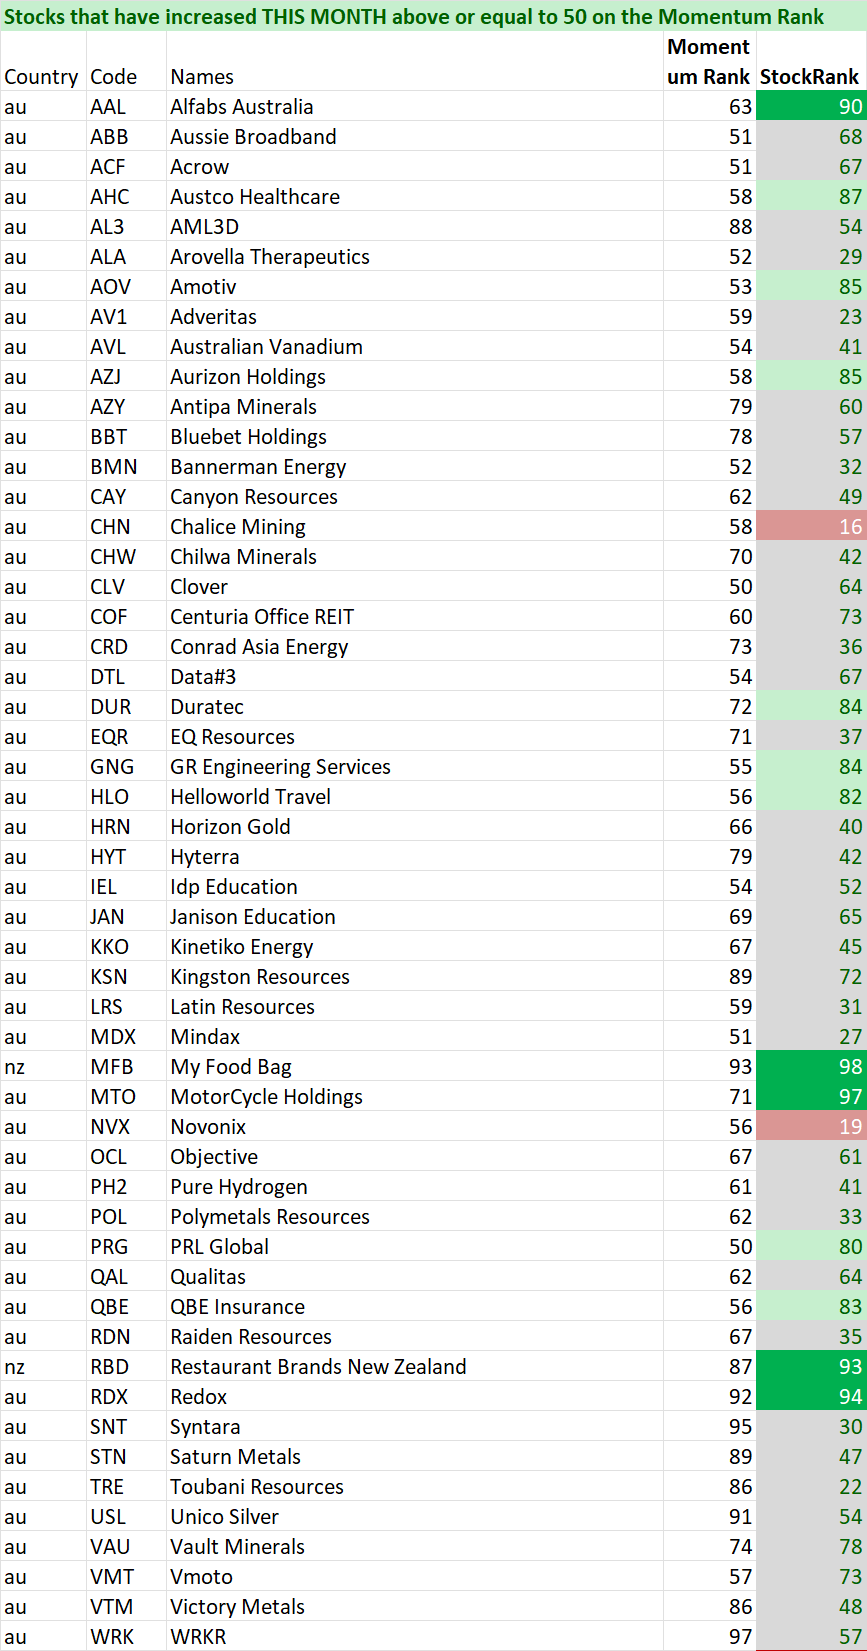
First is a list of stocks that have just crossed above 50 from a Momentum perspective. By definition, these will be stocks that have improved over the past week and month and may warrant further investigation. As a bare minimum a look at liquidity and market cap.
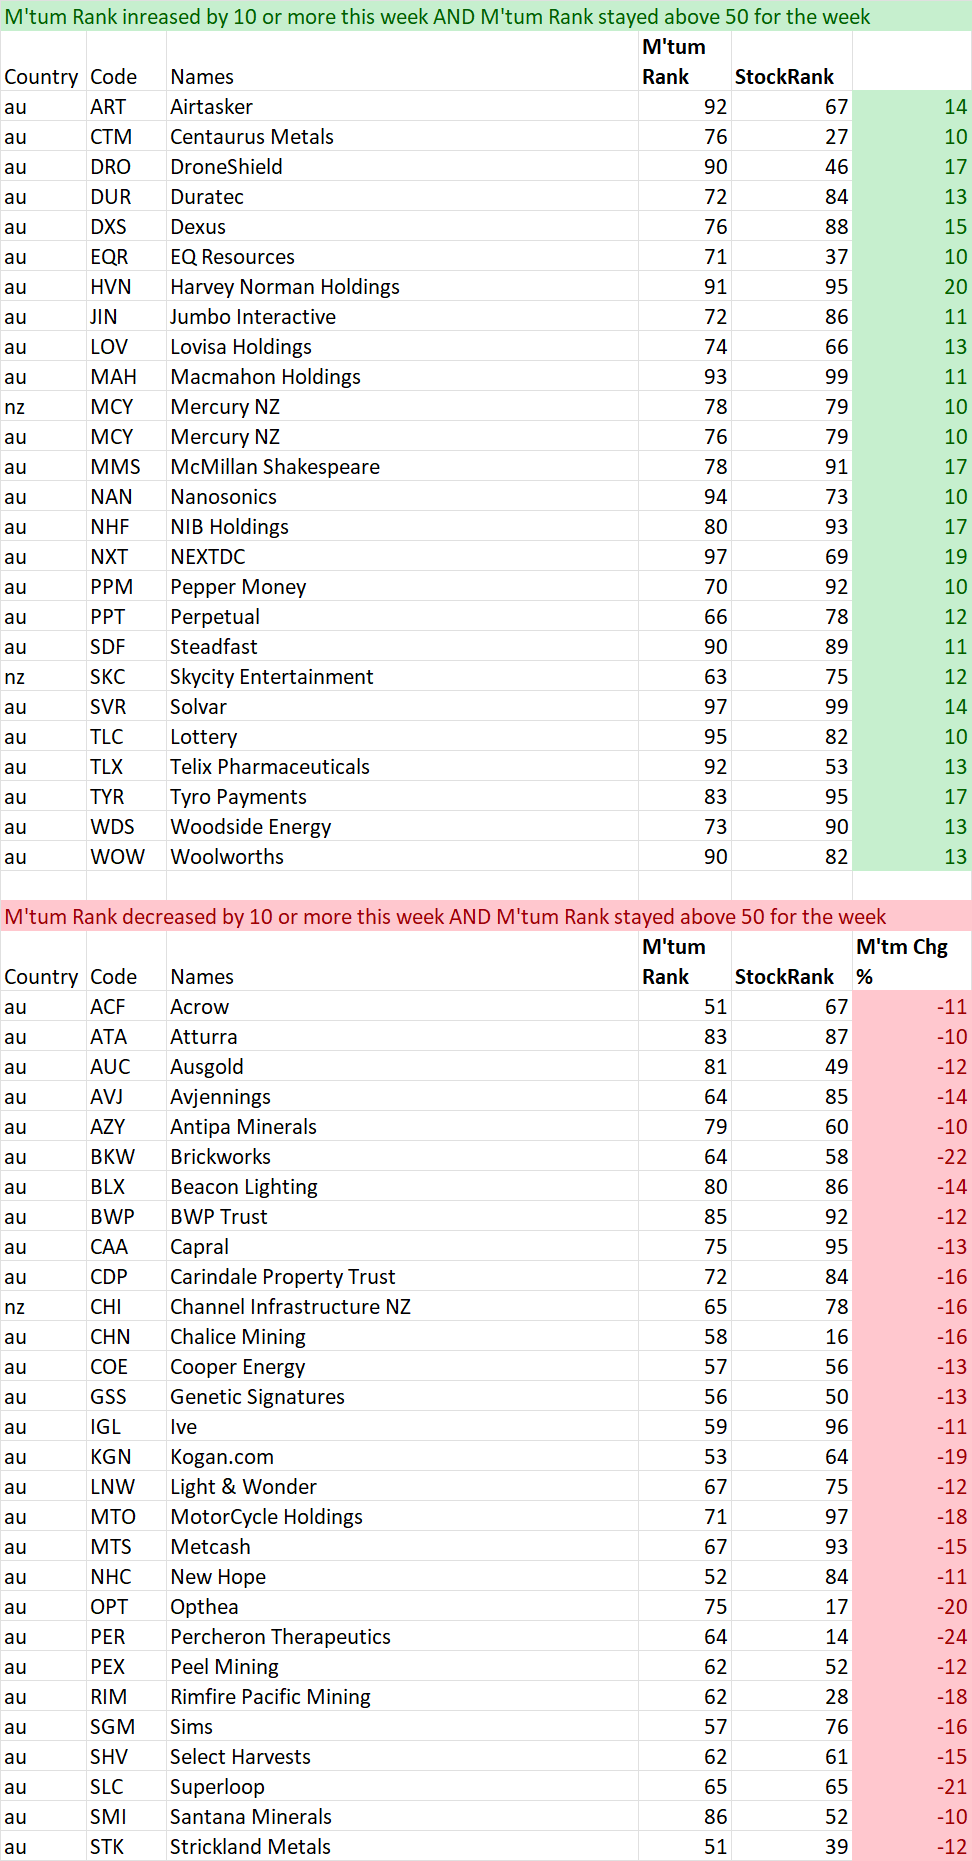
The second list measures all stocks that are currently ranked above 50, have remained above 50 during the time periods analysed (ie not just added or removed) AND whether they have improved or worsened by more than 10 points on the Momentum Rank.
With all filters a minimum market cap of $50 Mil has been included to help ensure investability from a small perspective. Be sure to check liquidity relative to your preferences.
Note: Some of the changes are due to the market cap now rising above $50M. Be sure to double check.
Data is on 05 October and is sorted by their code.
And remember, past performance is no guarantee of future performance.
Weekly Tables (the past week)
Monthly Tables (from published 2nd Sep to 05 Oct) Note: though shorter than last month, these lists are huge. I will be monitoring the size of these very closely as large lists are unwieldy and difficult to use in practicality. Feel free to let us know if you believe otherwise.
52 week high screen
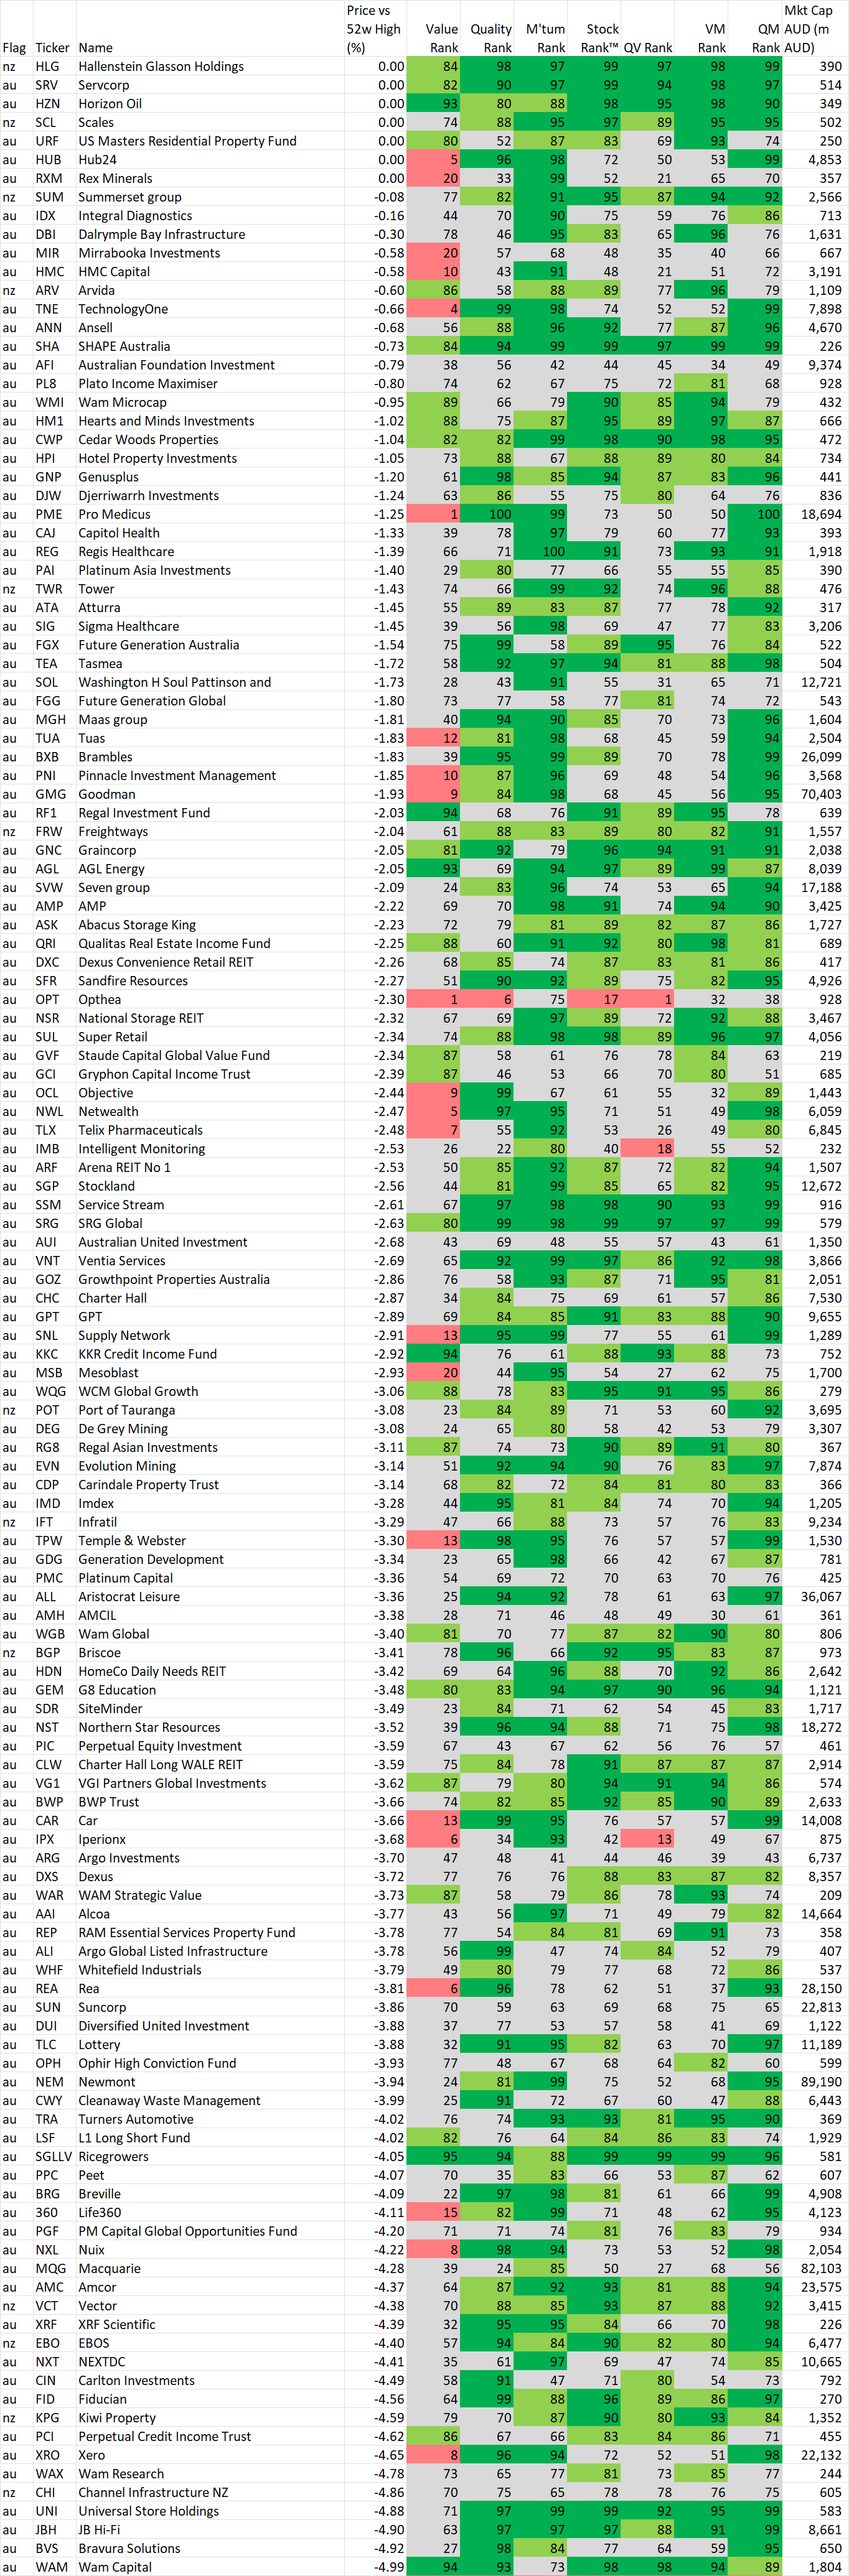
In this section we identify stocks within 5% of their 52 week intraday high based on the idea, supported by academic studies, that stocks close to their 52 week highs tend to outperform. Weekly changes to the list will also be noted.
If you wish to recreate this screen in the screener select "Price vs 52 high" greater than -5% and Mkt Cap greater than $200M
A stock coming onto the list is NOT an automatic buy, just as a stock that leaves the list is NOT an automatic sell. As with the shine list, assess every chart on its merits. However movements on this list may alert you to interesting charts so be sure to look at Stockopedia and the chart first.
Data is at 05 October and is sorted by the stocks closest to their 52 week intraday high.
Also look at the market capitalisation and liquidity before making any decisions!
And remember, past performance is no guarantee of future performance.
Changes from last week
Stocks within 5% of their 52 week high as at 05 October
Important Information: Stockopedia Ltd ABN 39 757 874 670 UK business registration number 0637267 (“Stockopedia”) is an Authorised Representative of Daylight Financial Group Pty Ltd ABN 77 633 984 773 (“DFGPL”) which is the holder of an Australian Financial Services Licence (AFS Licence No. 521404).
Information in this commentary is current as at date prepared unless otherwise stated. However, please bear in mind that investments can go up or down in value, and that past performance is not a reliable indicator of future performance. For more Important Information please refer to the Disclaimer section of this website.
This communication may contain general financial product advice. It has been prepared without taking into account your personal circumstances, and you should therefore consider its appropriateness in light of your objectives, financial circumstances and needs before acting on it.
If our advice relates to the acquisition or possible acquisition of a particular financial product, you should obtain a copy of and consider the Product Disclosure Statement (PDS) before making any decision.
The author holds direct interests in UNI and companies listed in the data tables . This position can and will change at any time without notice.
Disclaimer
This is not financial advice. Our content is intended to be used and must be used for information and education purposes only. Please read our disclaimer and terms and conditions to understand our obligations.
1 comment
Hi Elio, wondering about your views on a couple of companies. Domino's Pizza Enterprises (ASX:DMP) - I remember you've been sceptical on this business in the past on valuation grounds. Turns out you were right. But wondering if your posture has changed given the SP has halved and it seems to be back in an uptrend.
Also, Eagers Automotive (ASX:APE). It seems to have broken above resistance, broken through the ATR and now trending upwards.