Momentum Monday 8th May

Welcome to the second week of our revamped Momentum Monday, hopefully you have enjoyed the fresh additions and changes. Be sure to let us know your feedback as we don’t know if we are hitting the market unless you tell us so.
Here is the format for this week’s report:
Broader market sentiment
Stocks in the “Shine Zone”
52 week high screen (including changes)
There was no client request for stocks that we will cover this week. There was one suggestion that we received, however Stockopedia is yet to be updated with it. Once the UK team makes it available, we will cover it. As mentioned last week, if there are no client requests, we will not be making them up and the section will be excluded.
If you wish to see one of your stocks analysed from a Momentum perspective, either enter it in the comments below, or if you are a little bit shy, email support@stockopedia.com.au
Be sure to let us know your feedback down below now that you have two weeks to digest it. Hopefully we can continue to support your Momentum needs moving forward.
And don’t be a stranger. We are all Stockopedians, so please interact with us. This service will only be as powerful as what you contribute.
Broader Market Sentiment
Here we look at market direction (both in the US and ASX). This is not to determine an entry or exit signal… We should always rely on individual charts of stocks to do that. But rather to understand how aggressive/cautious traders should be when considering individual stocks.
Last week we split the discussion for each region into Chart sentiment and Macro sentiment so that the two remain separate. We include discussions around macro sentiment because, rightly or wrongly, they move markets. But sometimes they don’t… at least not yet..
S&P500
US Chart sentiment
For the fourth week in a row the S&P500 hardly moved.

S&P500 weekly chart
Despite the S&P500 recording its worst week since March falling 0.8%, by no means do I think that is a disaster and the market's remain on a plateau waiting for clear direction.
Over the past two weeks what we have seen is a tough start to the week which constantly finishes with a rally towards the end. Friday’s strong close was not enough to push the S&P500 positive for the week. However the week prior it was showing a real battle is on at the minute between the bull and bears.
If you look at the weekly chart you will see the bar pattern reflects this battle, as there are two long wicks on each of the last two weeks.
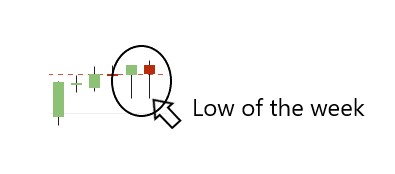
What does this mean? First I will caution by saying that anaylsing single bar action can be a bit of a guessing game, however what this current action could imply will be determined by the next move.
If next week proves to be a down week, it may signify that the strength of sellers is too strong for the stoic defense of buyers and there is a risk of capitulation.
On the other hand, if the market has an up week, then just like a Hollywood boxing film, the protagonist will pick themselves up off the canvas and make a successful run for the title.
With this ongoing sideways move we await a directional move to help form an opinion on what will likely happen next.
US Macro sentiment
Much of the focus this week in the US was around interest rates, particularly after the Federal Reserve raised official rates by a further 25 bps to a target range of 5%-5.25%. The market seemed to eventually convince itself that we are coming to the end of the tightening cycle and that there could even be rate cuts by the end of the year.
It will be interesting to see if this belief still holds in the comings days as the US received some particularly strong jobs numbers for April with nonfarm payrolls increasing 253,000 (estimate was 180,000). Further the unemployment rate was 3.4% (est 3.6%) and tied for the lowest level since 1969. The market also seemed to ignore that hourly earnings rose 0.5% for the month (4.4% for the year).
Despite Chairman Powell flagging the potential end of raising rates on slowing economic data, its obvious he is looking at different information that this which suggests inflationary pressures are not going away.
On the positive side, reporting season, particularly amongst the tech giants like Apple, has gone quite well. Sentiment was further helped along by JP Morgan upgrading a number of regional banks who have been the subject of some strong selling in recent times. While it may not be the end of this cycle, I suppose it is pleasing that the pace of the run on banks has been easing. But as we saw with First Republic, it doesn’t take long for the mood to shift.
And let’s not ignore this. First Republic Bank failed on 1 May when it was seized by regulators. This is an institution that in March received US$30 BILLION in uninsured deposits from 11 banks (which included JPMorgan (who ended up buying them this week), Citigroup, Bank of America, Wells Fargo, Goldman Sachs and Morgan Stanley amongst others) AND THIS STILL WAS INSUFFICIENT to provide confidence to the market. It goes to show that Banking at the end of the day is a confidence game, and once that dissipates the ending can be brutal.
The market however is still digesting all this as evidence by the index lack of movement in the past few weeks. Even the VIX that I referred to last week continued to fall. No one seems to know what to do next? But I sense once a clear direction develops with conviction either way, there will be plenty of macro sentiment to back up either narrative. What is sure is that we are likely in for a quick move from there so be on alert.
S&P/ASX200
Aus Chart Sentiment
It was a solid down week for the market adding to the risk that we are forming the head and shoulders pattern that we have been discussing.
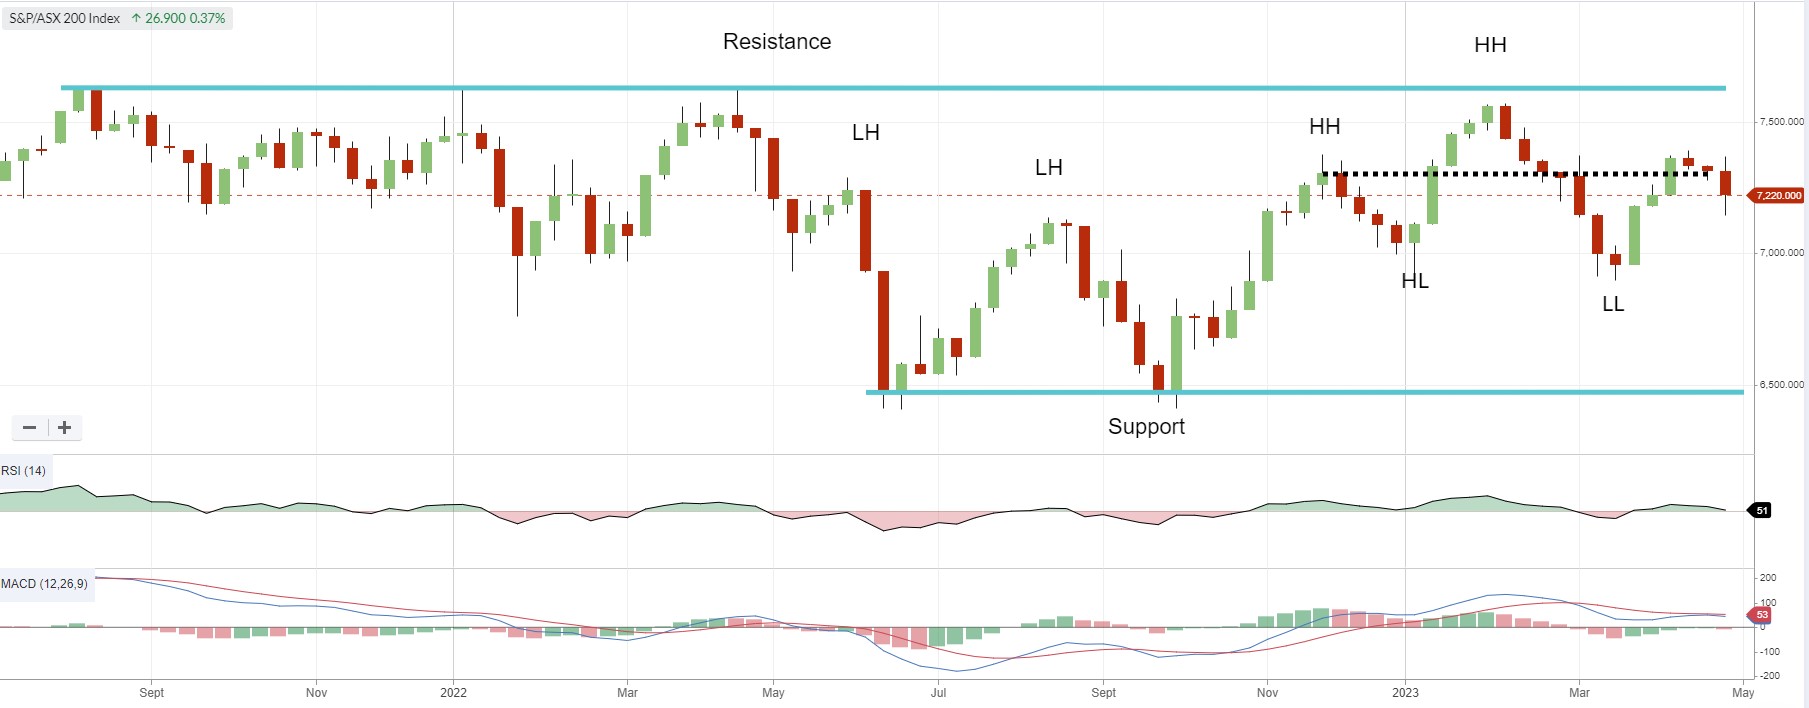
S&P/ASX200 Weekly chart
It will be interesting to see what happens this week. The start of the week should be positive given the US lead, but if it fails to excite over the coming days then the picture our chart is trying to paint will become clearer.
For those wanting an immediate catalyst, as long as the index stays above 6995 we won’t test the support line. Failure to hold and it becomes a different story. The macro picture at that time will have a lot to say about that, and we have a budget coming.
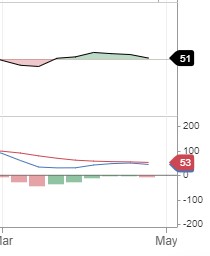
Despite the third negative week, the RSI clings to above 50 and even though the MACD has turned a little bearish, it is still above the zero line. This all supports the knife edge we are sitting on.
Aus Macro Sentiment
It was inflation last week, this week it was interest rates. With the “Surprise” 0.25% rate rise lifting official rates to the highest level since 2011.
I say “surprise” in inverted commas because what else was everyone expecting with inflation at 7%, unemployment at record lows, house prices going up, and people still spending like their life depended on it? I don’t know what sort of bizarro world people are living in but it seems pretty obvious to me. Adding weight to this is the budget surplus expected to be delivered along side eye watering spending levels.
The only thing in my mind the RBA could have done is been more aggressive in raising rates to shock a stop in spending. But if the government is displeased with the current policy, they would have been ropeable with that one. Either way, I don't think any RBA review would have changed this outcome. Our friends in NZ know the growing pressures all too well with estimates from the RBNZ estimating that the interest bill as a portion of household disposable income is due to more than double for this year to 22%.
We are on the eve of the Federal Budget and we are going to learn the real ongoing cost of running the money printing presses through COVID. What seemed like pretend money at the time, has just got very real with rates both locally and overseas rising significantly. That said, budgets domestically normally don't move markets too much so don't lose too much sleep over it. The only thing I worry about is how the expected "relief" for cost of living pressures is somehow not going to contribute cost of living pressure? Remember the first home buyer grant that was going to help people buy their furst home? All it did was elevate house prices to stupid levels. Every action has consequences and we are about to learn that.
While finger pointing has already commenced, mine are slapping my forehead because how this could not be envisaged beggars belief. It goes to show that when bureaucrats possess little real life experience and when our leaders are not great historians, these cycles are always destined to return.
At least we have commodities and thank heavens for China…. The lucky country indeed!
We also received a stack of company updates as the annual Macquarie Conference was held. This jamboree for investment managers and high net wealth clients, there is always a cavalcade of companies willing to showcase their wares to potential investors. We received many quarterly updates and across the board we saw price movements in response. Always be sure to look at company announcements on your online broker as they play a significant role in gauging momentum over the near term.
To show you the power of sentiment, we had a number of Banks report in the NAB and ANZ. With NAB record profits and growing dividends weren’t enough to stop the price being punished on the day. Whereas the ANZ delivered a slightly less robust result but it rose. While the commentary around both was very similar, the only difference was the sentiment on the day the announcements were made. Westpac releasing this morning was equally a strong result. Rising profits, dividends and margins is a strong indication that they, and that the people owing them money for now are ok. Will I haven't read the announcement as of yet, I am sure it is filled with statements of caution of what lies ahead.
Long story short, there is always a silver lining from the potential end of the economic world. Value can pop up when you least expect it so don’t avert your eyes from the chart just yet. Hopefully sentiment can start solid given the positive Friday in the US and the growing chorus that we could see rate cuts by the end of the year.
Stocks in the “Shine Zone”
Last week we introduced the Shine Zone. I followed up with an article of how you can use it. You can read it here.
The rules for inclusion in this list are based on those I like to see in a stock before considering a trade in it:
QM Rank above 80
Price is above the 2.5x ATR
50d MA is above the 200d MA
Price is greater than the 200d MA
I covered off in a bit more detail how the list is compiled in May 1 edition of Momentum Monday so be sure to read it.
But I will re-iterate that the “Shine Zone” are rules for possible buying. They are not for holding and/or selling. Read the how to article above to learn more
Data is at 5 May and is sorted by the stock code.
Note: This version has been amended since the first edition as COL was incorrectly included
Changes from last week
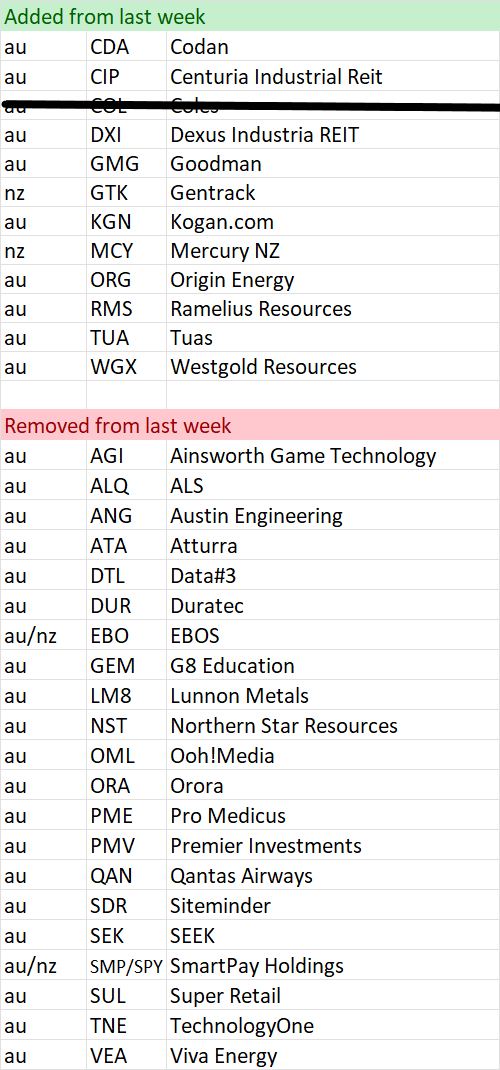
Shine Zone List as at 5 May

52 week high screen
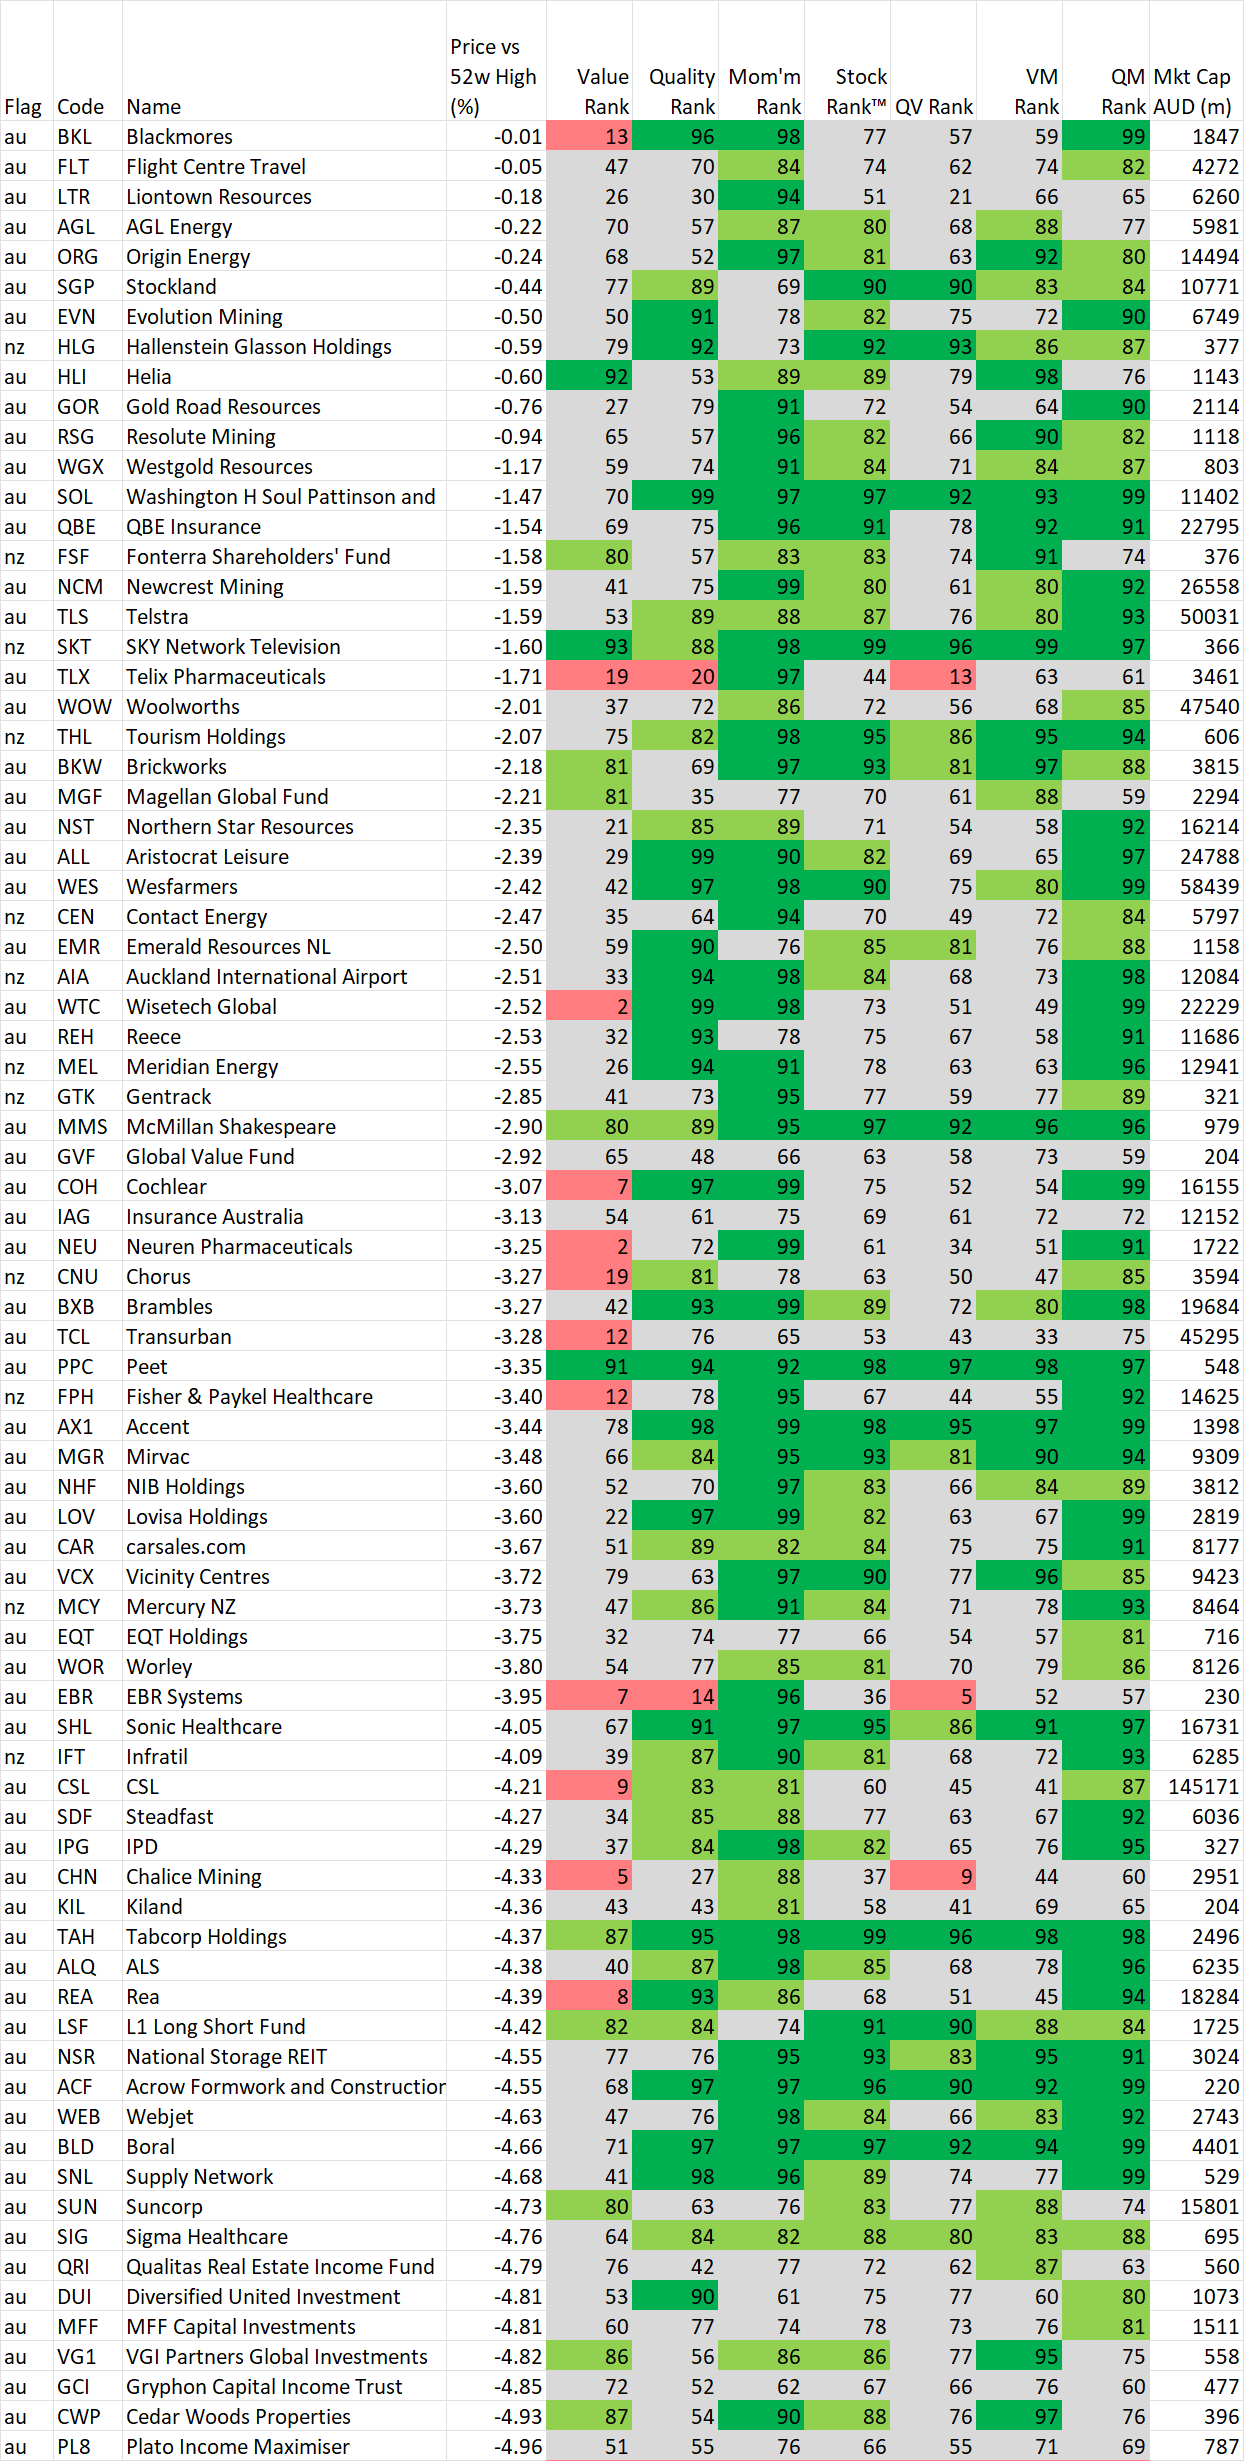
In this section we identify stocks within 5% of their 52 week high based on the idea, supported by academic studies, that stocks close to their 52 week highs tend to outperform. Weekly changes to the list will also be noted.
If you wish to recreate this screen in the screener select "Price vs 52 high" greater than -5% and Mkt Cap greater than $200M
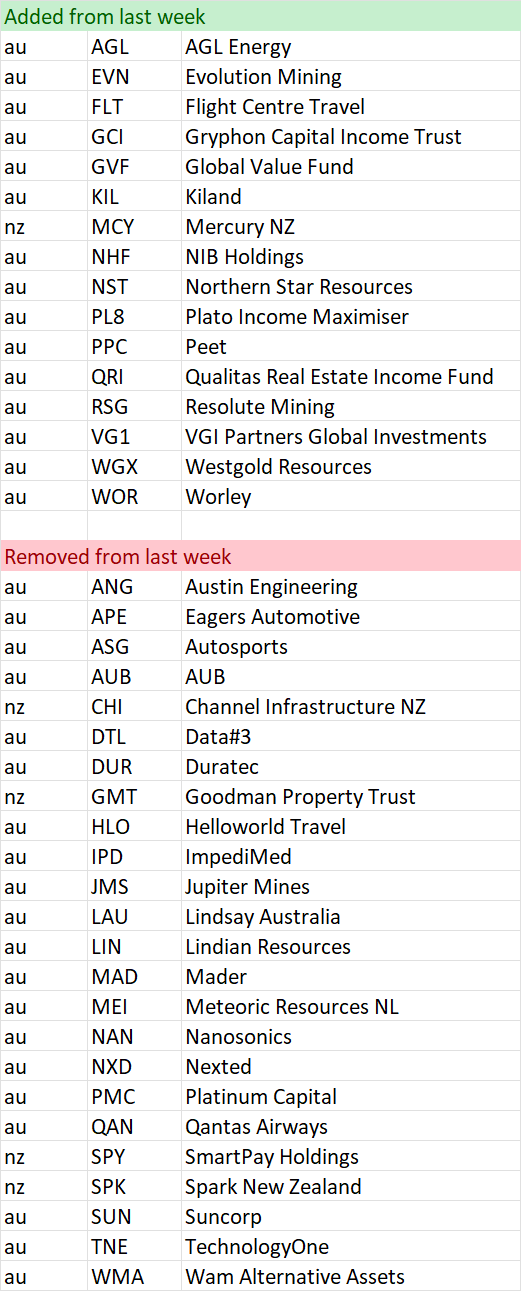
As announced last week, we will now record changes to the list week to week. A stock coming onto the list is NOT an automatic buy, just as a stock that leaves the list is NOT an automatic sell. However movements on this list may alert you to interesting charts so be sure to look at the Stockopedia and the chart first.
Data is at 5 May and is sorted by the stocks closest to their 52 week high.
And remember, past performance is no guarantee of future performance.
Changes from last week
Stocks within 5% of their 52 week high as at May 5
Important Information: Stockopedia Ltd ABN 39 757 874 670 UK business registration number 0637267 (“Stockopedia”) is an Authorised Representative of Daylight Financial Group Pty Ltd ABN 77 633 984 773 (“DFGPL”) which is the holder of an Australian Financial Services Licence (AFS Licence No. 521404).
Information in this commentary is current as at date prepared unless otherwise stated. However, please bear in mind that investments can go up or down in value, and that past performance is not a reliable indicator of future performance. For more Important Information please refer to the Disclaimer section of this website.
This communication may contain general financial product advice. It has been prepared without taking into account your personal circumstances, and you should therefore consider its appropriateness in light of your objectives, financial circumstances and needs before acting on it.
If our advice relates to the acquisition or possible acquisition of a particular financial product, you should obtain a copy of and consider the Product Disclosure Statement (PDS) before making any decision.
The author holds interests in stocks highlighted in the data tables . This position can and will change at any time without notice.
Disclaimer
This is not financial advice. Our content is intended to be used and must be used for information and education purposes only. Please read our disclaimer and terms and conditions to understand our obligations.
13 comments
I think I posted this wrongly in the Village square Elio, so here it is again. Charter Hall (ASX:CHC) interests me. Stock rank of 96 and low PE... and much fear and loathing due to a general view that higher interest rates damage property investment management companies. However their net gearing on Stockopedia is low at 3.02% and interest cover of 100%. Interested in your (and others') views on this one please.
Basically the rule of thumb is if you know the answer already put it in the Village Square for others to see. However if you want my view from a momentum perspective, put it here. I will add CHC to the list.
This is a good segway for everyone else.... if there is a stock on your radar, add it to the Village Square as it is looking a little lonely. Sure its cold outside.... but we would all appreciate a warm fire pit to sit around and have a think.
HIi Elio
I am thoroughly enjoying your contributions to Stockopedia. Could you comment on AX1 and NCK. Both being in retailing, AX1 flying and NCK near 52 wk low
Thanks for getting into the spirit of things Jimbol. They're on the list.
Hi Elio
Thank you for your article, while I see value in your Shine zone list, I found a lot more value in your previous approach of a more in depth discussion of shares you had picked. is a compromise possible? where you discuss a few (less than before) and 1 or 2 that members request. Thank you
Appreciate the feedback. Thank you.
I agree with you David Mc. It was what I was trying to say to Elio in MM last week (1 May).
Crystal Clear... Though I am really warming to the client suggestions. If I could guarantee a few more (each week) I could cover more, rather than invent the list each week.
Hi Elio
It would be great if you can look into the momentum for BSL and TLC
Thanks Rom. I will add them to the list. Excellent contributions.
Format
Case studies, even in hindsight using stockopedia for identifying potential. How can momentum factor be tracked?
Hi Jonner, That is tough. The most efficient way would be through an analysis of the momentum score. But even then that is not complete. Especially for someone using breakouts, support and resistance lines as I do.
Further, in my Wednesday article I articulate, "The pragmatic nature of technical analysis means I cannot vouch for any specific past performance that can stand up to the rigours of assessment. But what I can say is that they work for me. And likewise you need to determine through your own investigation whether they are right for you."
As to the origins of my methods , likewise as I said, "Their grounding is a combination of learnings including those of Charles Dow, Stan Weinstein, Joseph Granville, life experience and hurt money."
And because I am doing this piece as an education piece, I also identified stocks to be wary of (so not a sell per se.... just keep an eye out for. - Eg a stock that falls out of the Zone is not an automatic sell)
Thanks for the comment and we will look to continue to evolve.
When they catch up, call it "ROC and Rollcall" of stocks.