Momentum Tuesday (in lieu of Monday) 02 April 2024

Welcome to Momentum Monday. I hope you all had a restful Easter period.
“Tiptoe through the tulips” - The Tiny Tim version - has been playing in my head all the past week. I am not sharing this earworm because it makes me happy. Nor is it a bad April Fools Gag. Rather, us closing a shortened trading week on an all time high means life doesn’t get any better than that! Quite frankly, life is too short to be stressed or upset at the moment. Lists are bursting, and you have to look hard to find a stock not heading in the right direction.
But this creates another problem. The problem of ‘greed’. I know what it feels like. I’m a hot blooded investor like the rest of you. When I'm making money I am going to keep making money? Right? It's like playing at the poker table, winning a few small hands…. But then you feel confident enough that you go all in… and we know how that ends!
Times like this are what differentiates stock pickers from money managers. I know it is hard. Taking profits off the table, rebalancing (if you invest fundamentally) and getting your exposure levels right are all essential now. I remember the great Warren Buffett when he reminded us to be fearful when others are greedy, and greedy when others are fearful. At the moment others are greedy, so we know how we should be positioned.
As a momentum investor this is none of my concern. Because I am ruthless in selling when it goes the other way. Simple as that. If I know why I get into a stock, I’ll know when to get out. So if I use Momentum on the way in… I must use it on the way out. I don't mind impersonating a seagull at the end of a footy match fighting for scraps because that is a valid strategy. Let’s face it, gaining 10% in a quarter or more is not the norm and therefore we must accept the market zigs and zags. I hope it continues, but as a pragmatist I know it won't. So I will be ready.
But it ain't this week.
Also it was great to have a member from Stockopedia Global team join us in Australia for the last few weeks. Keelan Cooper is a Finance Extraordinaire and a key reason why the global engine ticks. He is visiting Melbourne, Sydney and will finish up on the Goldie. It was great to catch up with him on his journey and to be able to talk shop face to face, an incredibly invaluable opportunity. While I am not at liberty to share the contents of discussion, I can say my Wife and I were truly excited about what is due to come and I had to opportunity to reaffirm our region’s support of the global objectives. A definite win-win.

And a reminder, If you have a thought on whether you want more frequent communication from us, or whether ‘less is more', tell us below or email us at @stockopedia.com.au">support@stockopedia.com.au. Note: this is not ‘new’ content. It is the same output delivered in a different way. If you don't tell us we’ll never know.
For those interested... this is the version I watched of Tiny Tim to refresh my memory.
Interesting links
Weekend Watchlist with Shares for Beginners this week is we talk of a Stock discussed regularly by Chris Batchelor. It’s VEEM (ASX:VEE) . Listen here to the replay
“Empower Others” referral program Learn more here
For any external commentary we make to the broader market, follow us on Social Media Facebook Linkedin Instagram or X (formerly Twitter) For the moment we don’t spam you.
This week’s content is as follows:
Broader market sentiment
Member corner
Stocks in the “Shine Zone” (including changes)
Buses pulling out of the station (volume + price movers)
52 week high screen (including changes)
A reminder that you don’t have to read all this contribution. Simply scroll to the area of interest.
Broader Market Sentiment
We look at the direction of both the US and ASX markets to gain an understanding of the broader sentiment at the minute. It is important to stress here that I DO NOT use this to time my entry or exit out of stocks. I prefer to use the individual charts of stocks to do that. However I find it useful in helping us determine how aggressive/cautious traders should be in their trading. In short the more positive the broader market is the more risks you can take and vice versa.
US / S&P500
Another record week for the S&P500. It was the third consecutive positive week, albeit shortened due to Easter.

S&P500 Weekly chart
It was the best quarter for the US Market in 5 years.
The US Market is resilient and though Chairman Powell was quoted as recently as Friday as saying the Federal Reserve Board are in no rush to cut interest rates, the market knows that inflation does not have to return to the target zone first before rates are cut. With 3 cuts likely to occur this year alone as we discussed last week, the market has latched onto that positivity.
The RSI crept higher to that overbought level (79), so it's best we watch that as we are all waiting for the pull back.
I am really struggling to keep the word count down but I will. I think I have proven the saying that thinking less makes more money. I remain comfortable and aggressive. Therefore I am still in equities globally.
AUS S&P/ASX200
Likewise a record in the US meant records he in Australia with the S&P/ASX200 closing the shortened trading week and the month at all time highs

S&P/ASX200 Weekly chart
More records don’t need one to contribute much more than the chart shows us.
Last week I talked about trouble at our largest trading partner, but to be honest, when sentiment takes a grip why bother? So to the GDP level and stubborn inflation… no matter. Again I emphasise the Price Makers and Price Takers phenomenon which is occurring at the minute, not better reflected in price of course.
I was hoping that I would have more to say this week. I have a large amount of cash waiting to deploy the minute the market pullback significantly. If I am going to deploy it I look to ETFs for the minute as a broad strategy and great quality businesses that are experiencing a pullback (though there aren’t many)And despite an arms length of reasons why it should… it won’t. The short term at 7547 remains and agai,n I am quite aggressive,
Perhaps next week there will be more to say ( I said that last week and look how that played out?) I remain happy that the index is above my short term stop fof 7547.I remain exposed to domestic equities and I remain relatively aggressive. If I was a trader I would be ‘buying the dips’.
Member corner
In this section we will provide a detailed chart assessment, on a maximum of ten stocks weekly, on companies from those of you in the Gallery.
We welcome stock requests to be analysed from members. We will also be looking at the charts of some of the more actively researched stocks for the week. We will try to rotate through a selection so as to not make the charts stale, however we will likely not cover a stock within 2 months of when it was last discussed.
If you want to see what has been written about a stock recently, go to the discussion area.

We will not be making up suggestions. If there are no changes to the most viewed list and/or there are no suggestions from members, then no stocks will be covered.
To learn of the methods used to analyse companies in this section, refer to my Momentum Journey series that I articulate here in three parts.
They will help provide context on what I am writing about and the editorial angle of this report.
Also look at the market capitalisation and liquidity before making any decisions!
And again, if you have a stock you would like analysed from a momentum perspective, please write it into the comments section below or email us at @stockopedia.com.au">support@stockopedia.com.au
IF NO ONE ASKS… HOW AM I SUPPOSED TO KNOW?!?
ASX: - MQG Macquarie Group
StockRank 67
Momentum Rank 94
QM Rank 73
VM Rank 83
A$199.70
There are financial conglomerates that from time to time roll of the tongue for those interested in a long term holding linked to the strength of the economy. Im my view, Macquarie (ASX:MQG) is one of those stocks.

I covered MQG quite extensively from a Momentum perspective back in November last year. You can read the commentary here . In short, back thenthe price was $160, we said the price needed to hold above $150 (which it did) and the price target would be $183. We have now done that, so obviously members are wondering what next?
As with most things ‘equities’, things are going up. And for a company that makes more money as things go up, times are good and I feel the price will reflect the market moves. Nonetheless, that $183 mark is now structural short term support. If the price can hold that level it will form an incredibly strong base for it to rise to the all time high levels of $215.73. That level could prove to be structural resistance given it is an all time high level. But in bull markets like this, they can often be ignored. This makes it difficult to me as I still wait for a pullback of sorts, but the chart looks bullish.
ASX:PRU - Perseus Mining
StockRank 97
Momentum Rank 81
QM Rank 94
VM Rank 92
A$2.15
In an uncanny coincidence, November 6 was also the last time we looked at Perseus Mining (ASX:PRU)

ASX:PRU 1 year Daily chart
Back then I said $1.88 needed to be breached and it was a month later. Now the stock is on a short term uptrend.
As with most things Gold it has gone up, but as also mentioned previously, it operates out of Africa and therefore a discount is applied to it. As a result it has lagged behind many others.
In order for this short term uptrend to continue, any pullback needs to stay above $1.64. If that is too steep for someone, a parachute stop at that previous resistance of $1.88 may be appropriate.
While again logic tells me a pullback will have to occur - gold bulls are very noisy at the minute and any pullback will likely be moderate. Then perhaps the fundamental strength of the business will be appreciated.
ASX:SGLLV - Ricegrowers
StockRank 100
Momentum Rank 96
QM Rank 97
VM Rank 100
A$6.80
We have discussed Ricegrowers (ASX:SGLLV) a number of times in different forums. Most recently Chris covered them in this detailed article. Further they were included in the 2024 NAPS portfolio, with a quarterly review due shortly.

ASX:SGLLV 1 year Daily chart
In my mind, I immediately put them in the ‘Price Taker’ bucket. A concept that this reporting season to me really stood out where those who can set their own price and path did well versus those who didn’t have that choice. (Note you can see that latest half year result in Stockopedia.)
There is no doubt that SGLLV is a good business with so incredibly strong metrics across the board. However from a price perspective, the stock has been range bound for almost three years. (Excluding a false break in the middle of 2022)

ASX:SGLLV 5 year Weekly chart
This therefore governs much of my thinking on SGLLV at the minute. Until I see a clear break either way, from a Momentum perspective I remain non-committal. So what are those levels? To me a clean and sustained break either above $7.27 or below $6.05 is what I would be looking for. The good news is that it is closer to the upper end than it is the bottom. It doesn’t traditionally move enough for me to consider the business, though given its unique structure, a soft commodity run may be the panaca it need. Though things are pretty good at the moment, and when it comes to growing rice, ‘when it rains it pours’ - note: lots of water is good for growing rice.
Stocks in the Shine Zone
To learn about the Shine Zone and how to use it, you can read it here.
The rules for inclusion in this list are based on those I like to see in a stock before considering a trade in it:
QM Rank above 80
Price is above the 2.5x ATR
50d MA is above the 200d MA
Price is greater than the 200d MA
Market cap greater than $200M
This is a very important point: the “Shine Zone” are rules for possible buying. They are not for holding and/or selling. If a stock falls out of the shine zone, use support levels to set your stops, or instigate a parachute stop if necessary. With markets moving sideways, one expects frequent changes in these lists.
If you feel there is a stock that should be included but is missing please let us know. This is a manual process and occasionally one gets through the cracks
Also look at the market capitalisation and liquidity before making any decisions!
Data is at 30 March and is sorted by the stock code.
Changes from last week
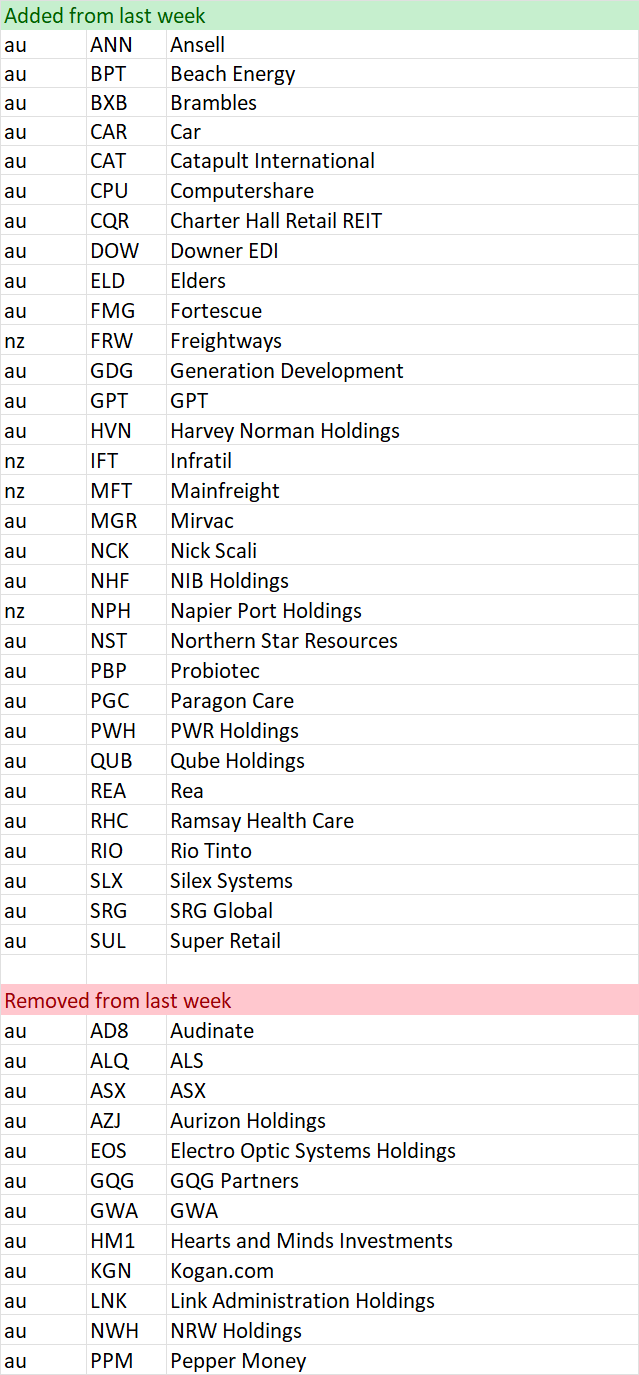
Shine Zone list as at 30 March

“Bus pulling out of the station”
To learn more about this screen read the following article on the objective of the screen
Here is a shortcut in understanding the reasons why a stock is removed:
Volume drop = Bus might be moving, but no one is on it
Price 1 mth < 0% = Bus has been cancelled
Price 3mths >= 3% = Bus has pulled out of the station
Also look at the market capitalisation and liquidity before making any decisions!
Data is at 30 March and is sorted by the stock code.
Changes from last week
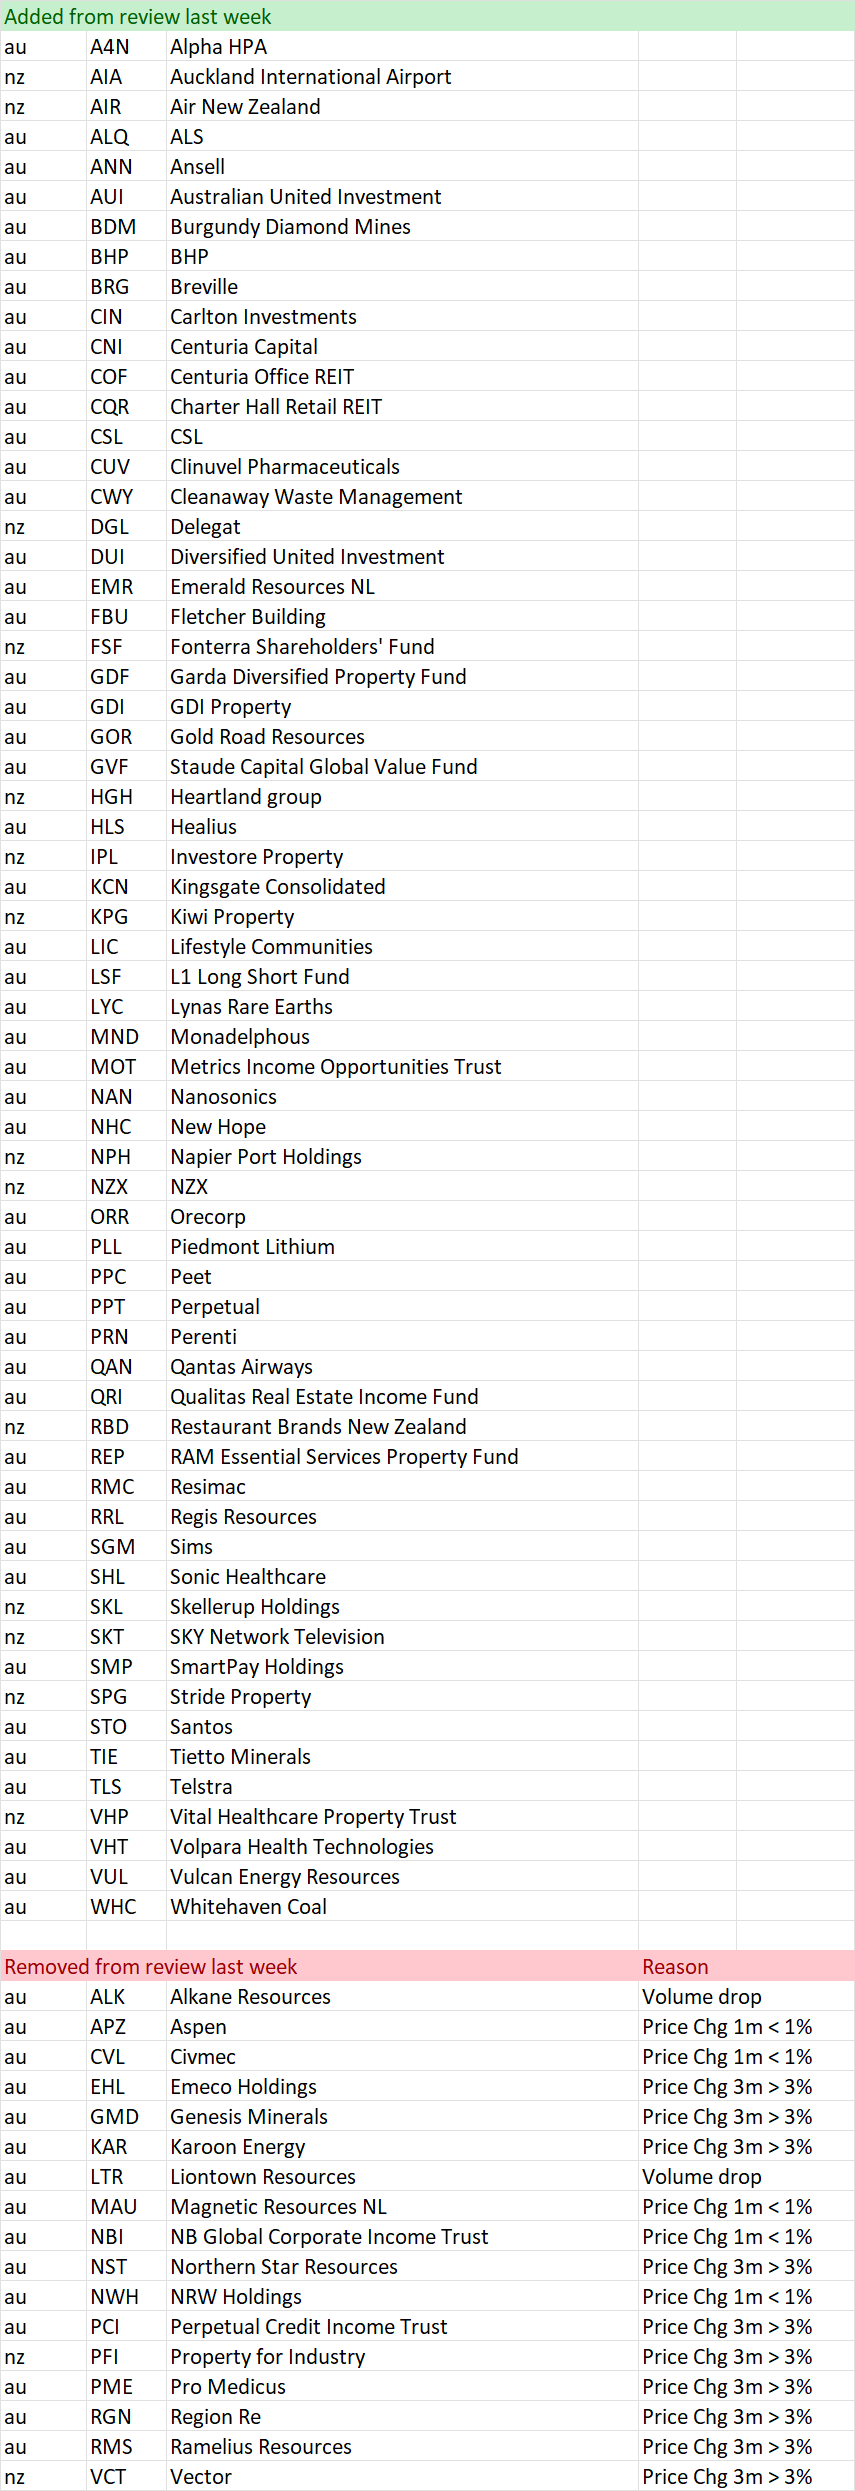
“Pulling out of the station” on 30 March
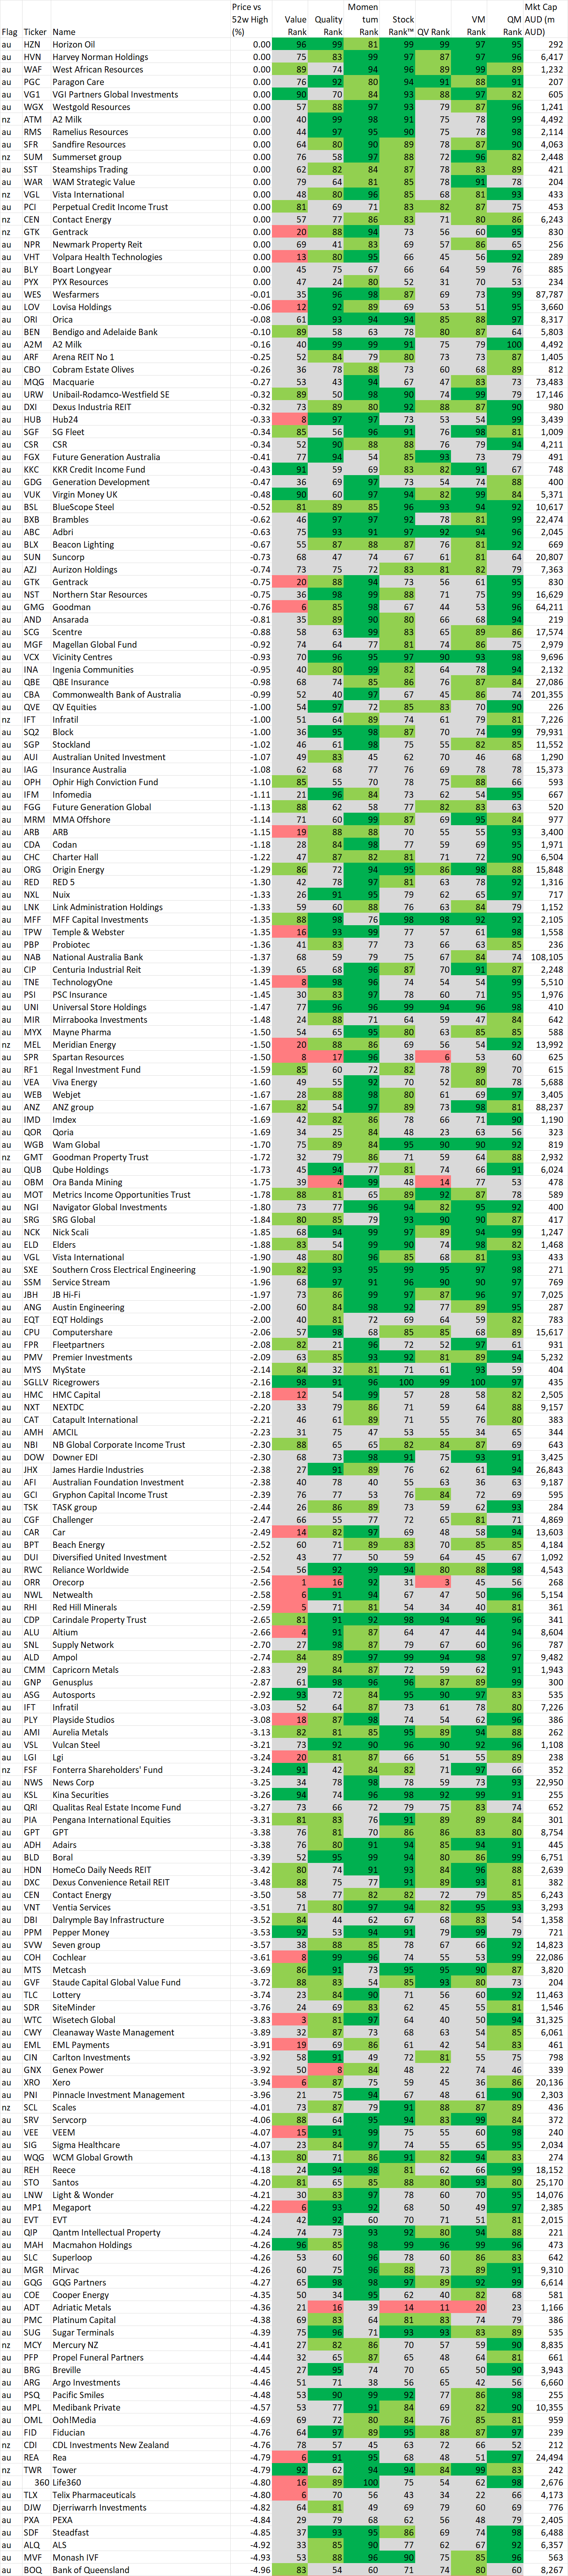
52 week high screen
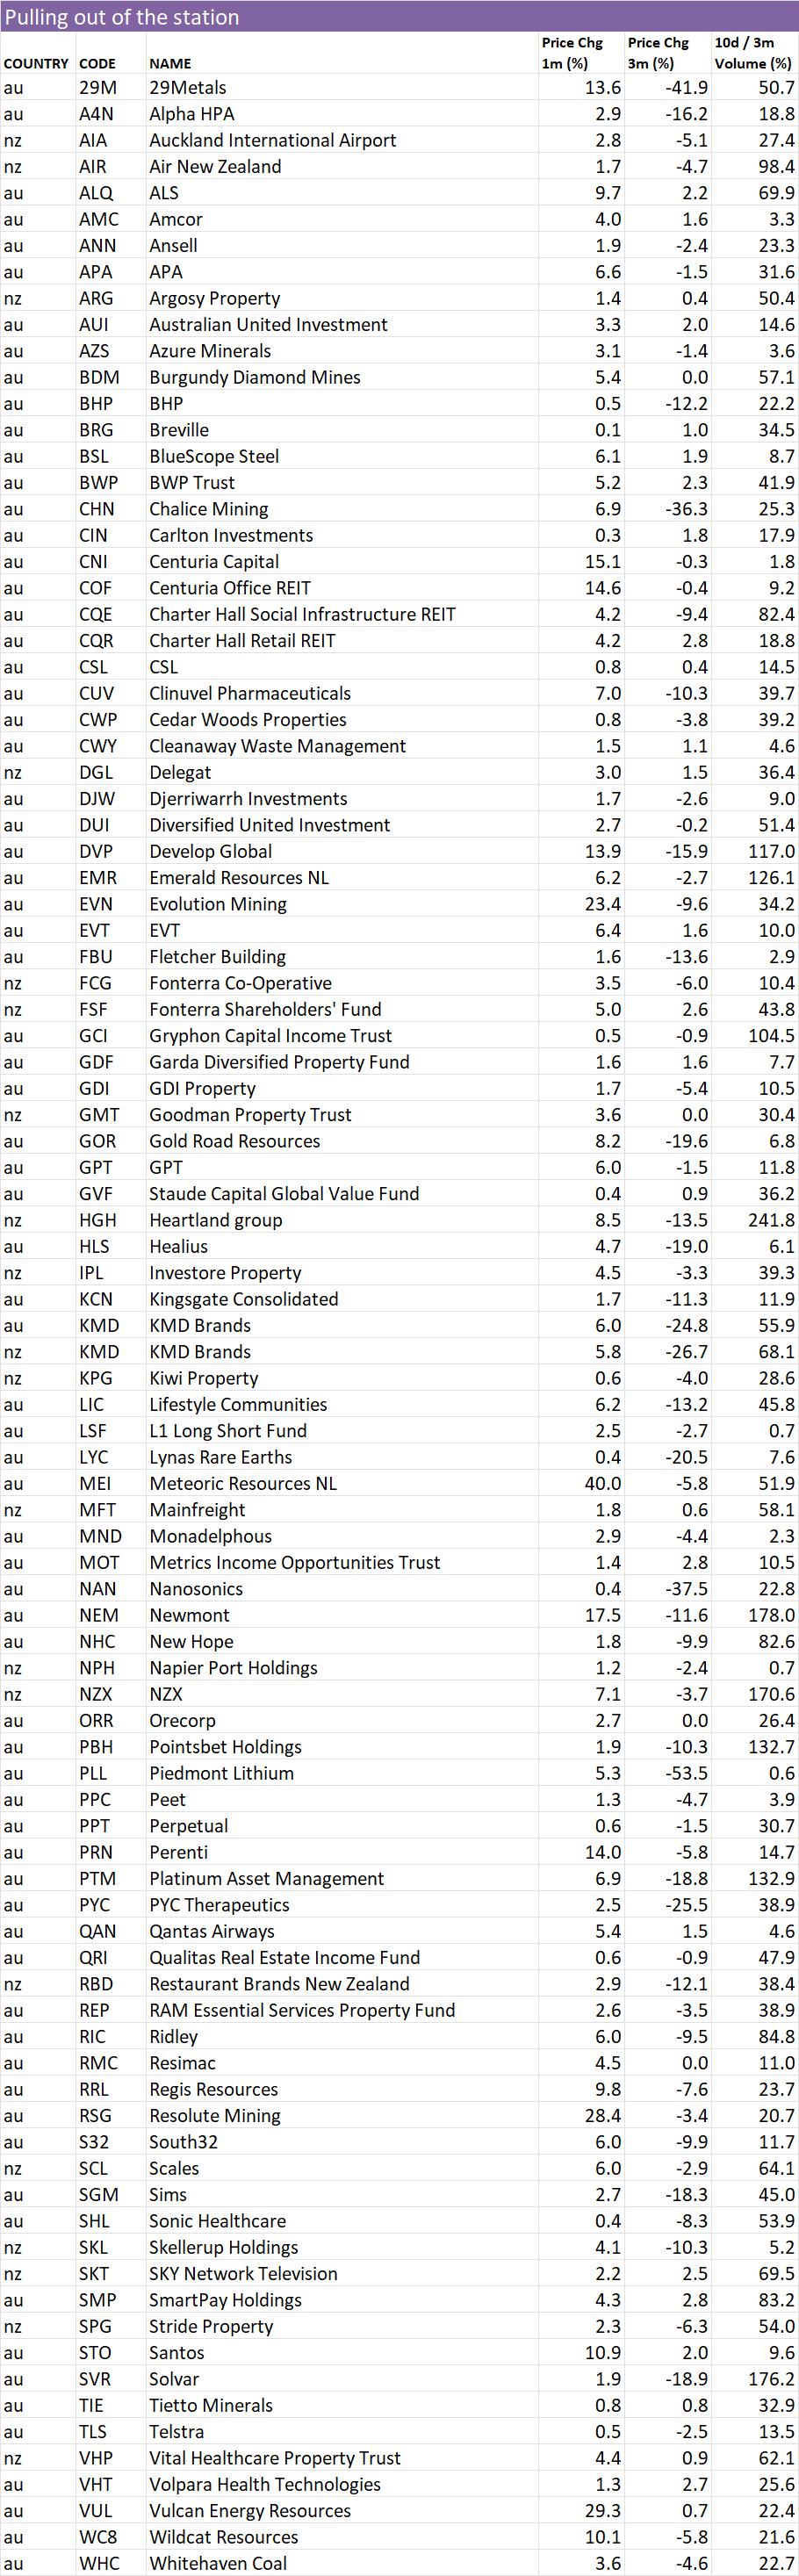
In this section we identify stocks within 5% of their 52 week intraday high based on the idea, supported by academic studies, that stocks close to their 52 week highs tend to outperform. Weekly changes to the list will also be noted.
If you wish to recreate this screen in the screener select "Price vs 52 high" greater than -5% and Mkt Cap greater than $200M
A stock coming onto the list is NOT an automatic buy, just as a stock that leaves the list is NOT an automatic sell. As with the shine list, assess every chart on its merits. However movements on this list may alert you to interesting charts so be sure to look at Stockopedia and the chart first.
Data is at 30 March and is sorted by the stocks closest to their 52 week intraday high.
Also look at the market capitalisation and liquidity before making any decisions!
And remember, past performance is no guarantee of future performance.
Changes from last week
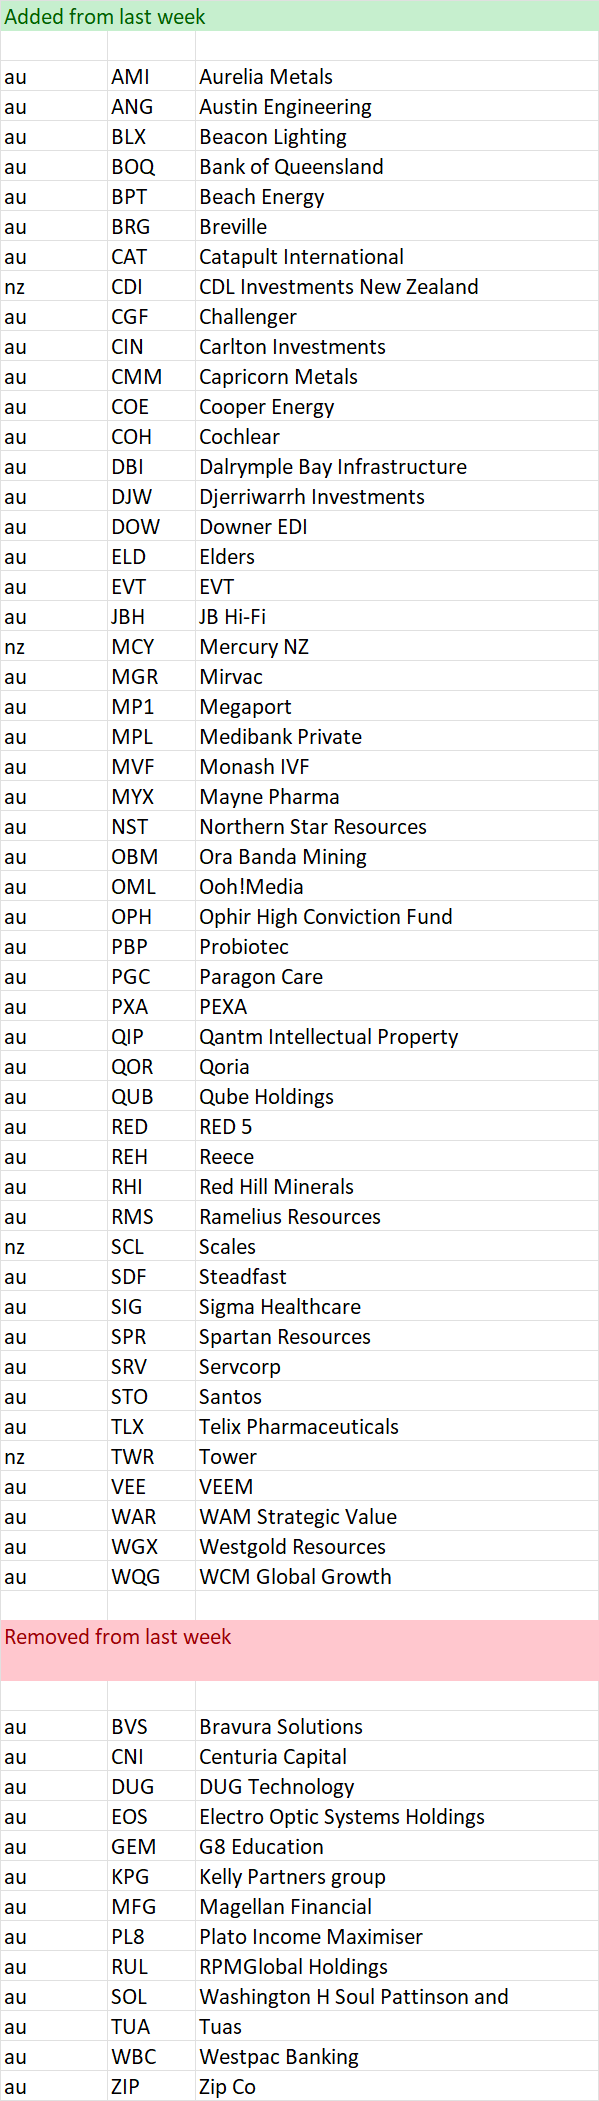
Stocks within 5% of their 52 week high as at 30 March
Important Information: Stockopedia Ltd ABN 39 757 874 670 UK business registration number 0637267 (“Stockopedia”) is an Authorised Representative of Daylight Financial Group Pty Ltd ABN 77 633 984 773 (“DFGPL”) which is the holder of an Australian Financial Services Licence (AFS Licence No. 521404).
Information in this commentary is current as at date prepared unless otherwise stated. However, please bear in mind that investments can go up or down in value, and that past performance is not a reliable indicator of future performance. For more Important Information please refer to the Disclaimer section of this website.
This communication may contain general financial product advice. It has been prepared without taking into account your personal circumstances, and you should therefore consider its appropriateness in light of your objectives, financial circumstances and needs before acting on it.
If our advice relates to the acquisition or possible acquisition of a particular financial product, you should obtain a copy of and consider the Product Disclosure Statement (PDS) before making any decision.
The author holds interests in companies in listed in the data tables . This position can and will change at any time without notice.
Disclaimer
This is not financial advice. Our content is intended to be used and must be used for information and education purposes only. Please read our disclaimer and terms and conditions to understand our obligations.
3 comments
Hi Elio, I'd be interested in your thoughts on Elders (ASX:ELD) from a momentum perspective, if it's not too late that is.
Vita Life Sciences (ASX:VLS) is a stock I have held for a couple of years and seems to be now pulling away from the trough it was in last year. It seems to be growing in the top line, showing profits, paying a dividend and increasing their cash. It is not cheap on a p/e basis but the growth should take care of that. Are there interesting issues that I should bear in mind?
Last July you correctly commented on XRF Scientific (ASX:XRF) suggesting some selling at the then price (good suggestion that I did not follow!). It seems that their progress has now resumed and I am minded to stay with them as, long term, they seem to be a necessary part of Australia’s resource future
Thanks Aislabie for the opportunity to share my absolute favourite of all quotes ever spoken in the human race... This is attributed to Oscar Wilde ... Though I am told Lewis Carroll came up with something similar....
"The only thing to do with good advice is to pass it on. It is never of any use to oneself."
i will definitely look at them.