Momentum Tuesday (in lieu of Monday) 11th June 2024

Welcome to Momentum Monday.
It was another one of those weeks where not much happened sentiment wise other than things are up. Which is a good problems to have. A few rate cuts globally no doubt aided the sentiment and for now we can remain proud as equity investors. All you need to do it hold what is going north-east and don't hold what is going south-east. Pretty simple stuff. But then against trading on sentiment is relatively simple. Being ruthless however, that is up to you.
Interesting links
We look at a stock many of us want to loathe. It's TLS Telstra on this week on Weekend Watchlist run in conjunction with Shares for Beginners. Listen here to the replay
Great to hear a member of our Global Team in Megan Boxhall on Local radio talking about the British election and its impact on their market Listen here
Book your place at the virtual table with our coming Friday Lunch ‘n Learn session. Go here to book your
Our “Empower Others” referral program will be undertaking a change. For now we maintain the current system, be sure to Learn more here if you are interested in current plan
For any external commentary we make to the broader market, follow us on Social Media Facebook Linkedin Instagram or X (formerly Twitter)
This week’s content is as follows:
Broader market sentiment
Member corner
Stocks in the “Shine Zone” (including changes)
Buses pulling out of the station (volume + price movers)
52 week high screen (including changes)
A reminder that you don’t have to read all this contribution. Simply scroll to the area of interest.
Broader Market Sentiment
We look at the direction of both the US and ASX markets to gain an understanding of the broader sentiment at the minute. It is important to stress here that I DO NOT use this to time my entry or exit out of stocks. I prefer to use the individual charts of stocks to do that. However I find it useful in helping us determine how aggressive/cautious traders should be in their trading. In short the more positive the broader market is the more risks you can take and vice versa.
US / S&P500
Over the week the US Market rose despite Friday’s weaker close. Therefore while we didn't close on record highs, we are damn close. In fact keen watchers will tell you that during the session we actually did at one point hit 52 week highs. Either way, it closed on a new weekly high and positivity remains.

S&P500 Weekly chart
This chart is at Friday and doesn't include the new record on Monday (their time) - but obviously the narrative doesn't change at this stage. This doesn't mean it won't ever change. Of course it will. Just not today.
The market has become so desperate to find something to talk about I noted the extra coverage given to a non-farm payrolls figure and the fact there was some guy in a head band who did a live stream talking about rubbish stocks. Then there was the incessant “mine is bigger than yours” speech when comparing the market cap Apple to NVIDIA…
Yep… it is a Bull Market.
But you can stay focussed on the chart to see that. Everything is going up. The MACD has seen its Moving Average lines converge. The market is also jumping on the recent rate cut in Canada and the EU. In the case of the latter it was the first ‘cut’ to deposit rates since 2019 (even before COVID).
Though I did read somewhere that the pace of the Mega caps has out paced small to mids and that would be true. Not just looking at the markets but also Stockopedia. While this is a positive for ETF investors, we need to keep an eye on this closely, and I will, though it just reaffirm sin my view that decisions on stocks need to be made on their specific charts - not this general overview. This just helps me frame my aggressiveness.
Last week there was ‘hope’ that possibly we were starting to see a double top and therefore the market would take a breather, but alas it didn’t happen - in fact it is a timely reminder that ‘Hope’ is not a successful investment strategy.
My level of 4734 remains and I continue to be aggressive with Equities globally.
AUS S&P/ASX200
It might not have felt like it, but we were up for the week. And we closed at the weekly highs. So relax, kick your shoes off. Markets are good for the moment. And with a shortened trading week and positive lead from the US, I am feeling quite chipper at the minute.

S&P/ASX200 Weekly chart
For the week the S&P/ASX 200 rose 2% It was our first positive week after two consecutive down ones, but the strength of this bounce back should not come as any surprise given the positive state the broader market is in. In fact it was our best weekly gain since mid-December.
Much of the optimism is attributed to the rate cuts as mentioned earlier in the US piece, but the reality in my view is that Momentum Is still strong. Looking at the lists we can see a further increase in Stocks in the Shine Zone and increases in the number close to their 52 week high. We also see that Volume is not really a major factor at the moment, it just seems to be all about the price
If there is a talking point on the negative side at the moment we not the pressures on consumers and can see that pressure in retail stocks at the minute. Obviously anyone tied to the consumer is citing it as a reason. But I feel that for as long as we remain employed… we will be fine. Then there is the pressure on Iron Ore stocks on the back of no one really believing the Chinese Government supported bounce back in the property sector.
I can't make it more simple than this. Seriously at the minute (and I sometimes need to remind myself of this) if the stock you hold is not heading north-east, get rid of it and replace it with someone who is.
I will always advocate that looking at the individual performance of a stock will tell you more than trying to predict its coming and going. So it is fair to say that if a stock you have held is focussed on Iron Ore and has a only one or two mine focus (even a MGX from the NAPS 2024 Portfolio) then what has happened should be no surprise
Sentiment from a broader market perspective remains positive and so do I.
Member corner
In this section we will provide a detailed chart assessment, on a maximum of ten stocks weekly, on companies from those of you in the Gallery.
We welcome stock requests to be analysed from members. We will also be looking at the charts of some of the more actively researched stocks for the week. We will try to rotate through a selection so as to not make the charts stale, however we will likely not cover a stock within 2 months of when it was last discussed.
If you want to see what has been written about a stock recently, go to the discussion area.

We will not be making up suggestions. If there are no changes to the most viewed list and/or there are no suggestions from members, then no stocks will be covered.
To learn of the methods used to analyse companies in this section, refer to my Momentum Journey series that I articulate here in three parts.
They will help provide context on what I am writing about and the editorial angle of this report.
Also look at the market capitalisation and liquidity before making any decisions!
And again, if you have a stock you would like analysed from a momentum perspective, please write it into the comments section below or email us at @stockopedia.com.au">support@stockopedia.com.au
IF NO ONE ASKS… HOW AM I SUPPOSED TO KNOW?!?
ASX: AD8 - Audinate
StockRank 66
Momentum Rank 96
QM Rank 94
VM Rank 54
A$16.07
A stock that was last discussed in February from a Momentum perspective was Audinate (ASX:AD8).

ASX:AD8 1 year Daily chart
At the time, it was on a solid run up, and so it continued, until it hit $23.21 in March this year. Suffice to say the price hasn't done so well since then, though so it's unsurprising that the stock has come up again for review.
I said from a trade perspective that the stock had to stay above $18. Obviously that got lifted as the stock went up and breaking under $20 was enough for me in April. So what is more important is what to do now?
I mentioned last time the company ‘s nasty propensity to fill gaps and that gap from February 2024 did actually fill as improbable as it was at the time of writing, and that level mentioned of $14.30 is actually now closer than many think.
In a market where we remain aggressive, I won't be just yet with AD8. You will notice the new lower low in very late May, that means to me the stock is on a footing for a down trend now over the short term. This won't be confirmed until the price rebounds, then falls again, but for now the chart doesn't look great and doesn't scream that I have to be in this business now. So patience may be the best course of action. An opportunity could occur if the price keeps bouncing.
This view may change if the price stops falling and gets above $19.45 or if the price keeps falling and gets closer to $14.30 at which point I may have a nibble given my aggressive stance overall with the market. A stop then will be set at $12.52 which coincides with the low in October 2023. But for now, I will respect the chart on this one.
ASX: HZN - Horizon Oil
StockRank 99
Momentum Rank 83
QM Rank 96
VM Rank 99
A$0.175
For the first time analysed from a Momentum perspective is Horizon Oil (ASX:HZN) . The stock has been raised as a perennial value play. Its actually a timely reminder that when it comes to ASX stocks involved with Oil, they are notoriously hard to pick

ASX:HZN 1 year Daily chart
For those that don’t know HZN is an oil explorer and producer. When I last look at them closely they were a Phillapene’s based operator with significant trouble managing the local militia. They also had PNG assets. Now days it is involved in activity both in New Zealand and China and they have JV interests in each asset.
As per their website they are focused on maximising free cash flow and are committed to paying out good distributions. This change of strategy seems to be working for themas the price finds support amid a turbulent time for the underlying commodity.
It rates highly on Stockopedia. It's cheap and it has a massive yield.From a short term it looks relatively good as a series of high lowers should provide some comfort to investors. Though I note it is butting against resistance and it needs a clear break out of that.
Long-term, and in hindsight, it has had periods of resistance before particularly in 2018 and 2019. You can see how the break though in 2022 was followed up and I think investors will wait for that to occur.

ASX:HZN 10 year Weekly chart
From my perspective it is a little too illiquid for me. But I can see the appeal in this market (notwithstanding my natural aversion to oil and gas investments.)
ASX: PRU Perseus
StockRank 99
Momentum Rank 97
QM Rank 99
VM Rank 97
A$2.48
We last discussed Perseus Mining (ASX:PRU) two months ago, and it is being viewed by members again.
ASX:PRU 1 year Daily chart
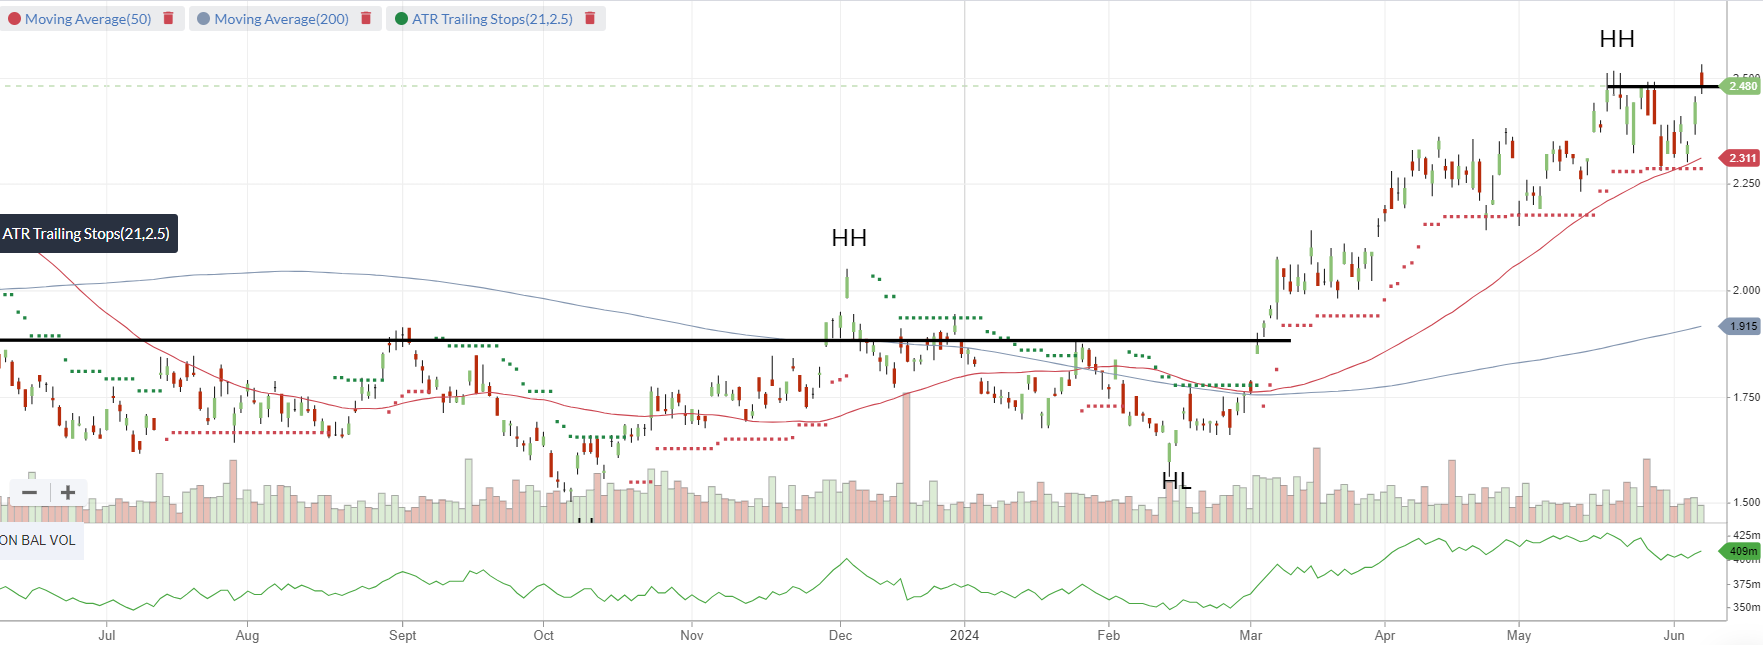
At the last time of comment we said the price needed to stay above $1.64, or at the very least $1.88 and it did that by still rising.
On a short term basis the stock is doing well following a series of higher highs and higher lows despite the gold price halting it's recent run up. Though as also mentioned, Gold Bulls are particularly noisy at the minute.
Notwithstanding the challenges of the region they are focused on, the recent production upgrade from the Cote d’ivor operations saw analysts upgrade earnings expectations and the price is enjoying the focus.
So where to from here? The stock is right on the previous 52 week high of $2.48. Breach that and it could go for a further gallop. Where as if it fails there is a downside target of $2.10, though I think $2.18 will be support. Either way, notwithstanding the chart issues relating to the price of the commodity they mine and the region they serve will have a lot to say on the future direction on price.
ASX: LOV Lovisa Holdings
StockRank 66
Momentum Rank 82
QM Rank 93
VM Rank 45
A$31.25
ASX:LOV 1 year Daily chart
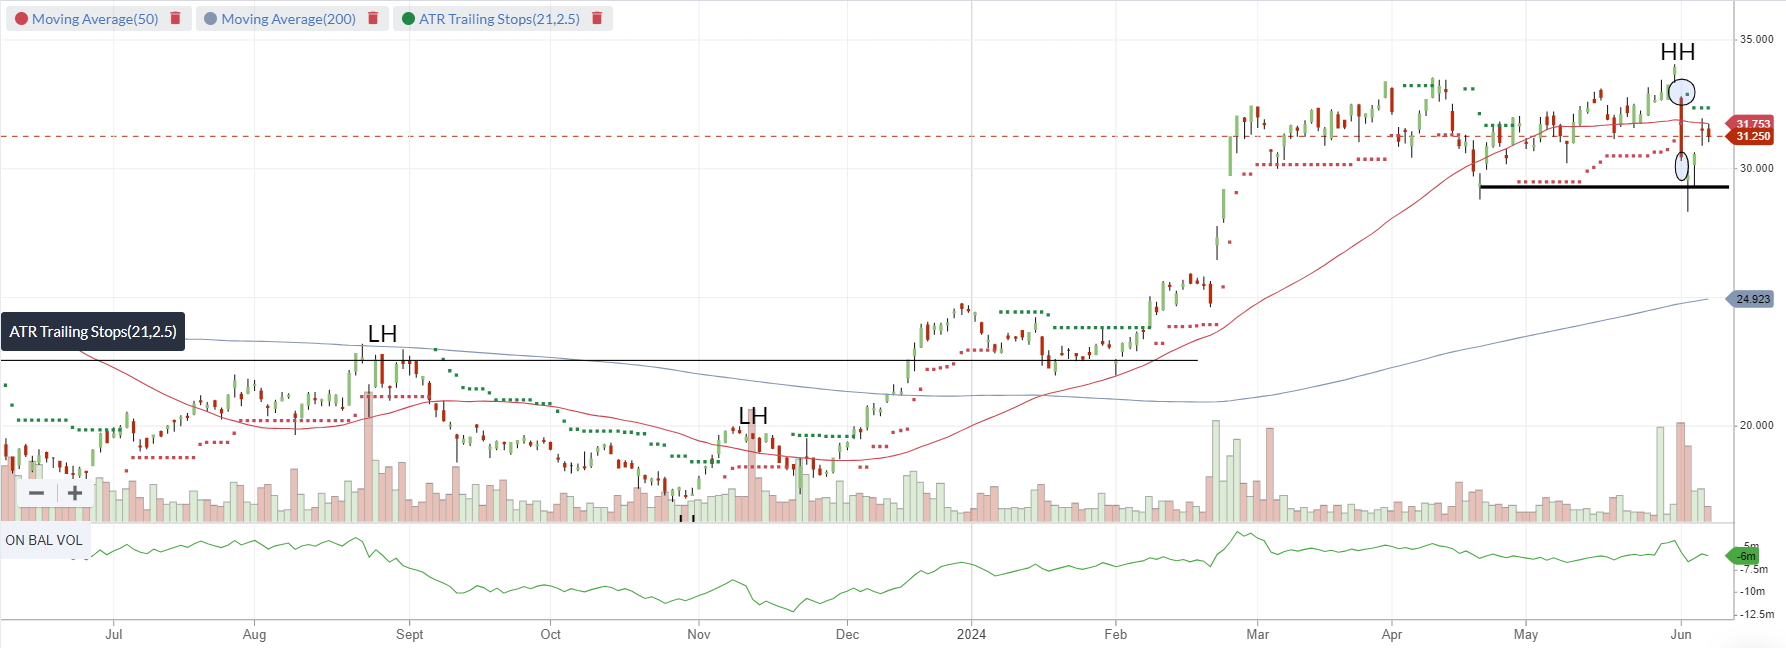
There was the announcement of well-paid CEO Victor Herrero leaving the firm with John Cheston (likewise well paid) will take on the role in May next year. Will the price fell heavily on the day, traders may be thinking what do they do know?
Well this is a trick chart. The announcement came after the stock hit an all time high. You will notice that the stock on that day created two gaps. It gapped down on the open. And then it gapped down again as analysts presumable cut their EPS guidance and price targets. Not that I want to sound facetious, but I can't help but feel this is all profit taking to make themselves look good.
From a chart perspective the higher low from April of $29.37 held despite the sell off. Therefore from a trading perspective this obviously is a level of support to watch. And I will be. If if hold, then the upward trajectory could continue, if it fails there could be more selling pressure ahead. If I didn't have a position though, I would wait to see what happens. There is no need to rush this trade if I wasn't in it.
ASX: EGL Environmental Group
StockRank 83
Momentum Rank 89
QM Rank 94
VM Rank 75
A$0.305
A member has asked that we have a look at Environmental (ASX:EGL) and it is not the first time it has been looked at from a Momentum perspective. It was covered in February this year and you can read the commentary here
ASX:EGL 1 year Daily chart
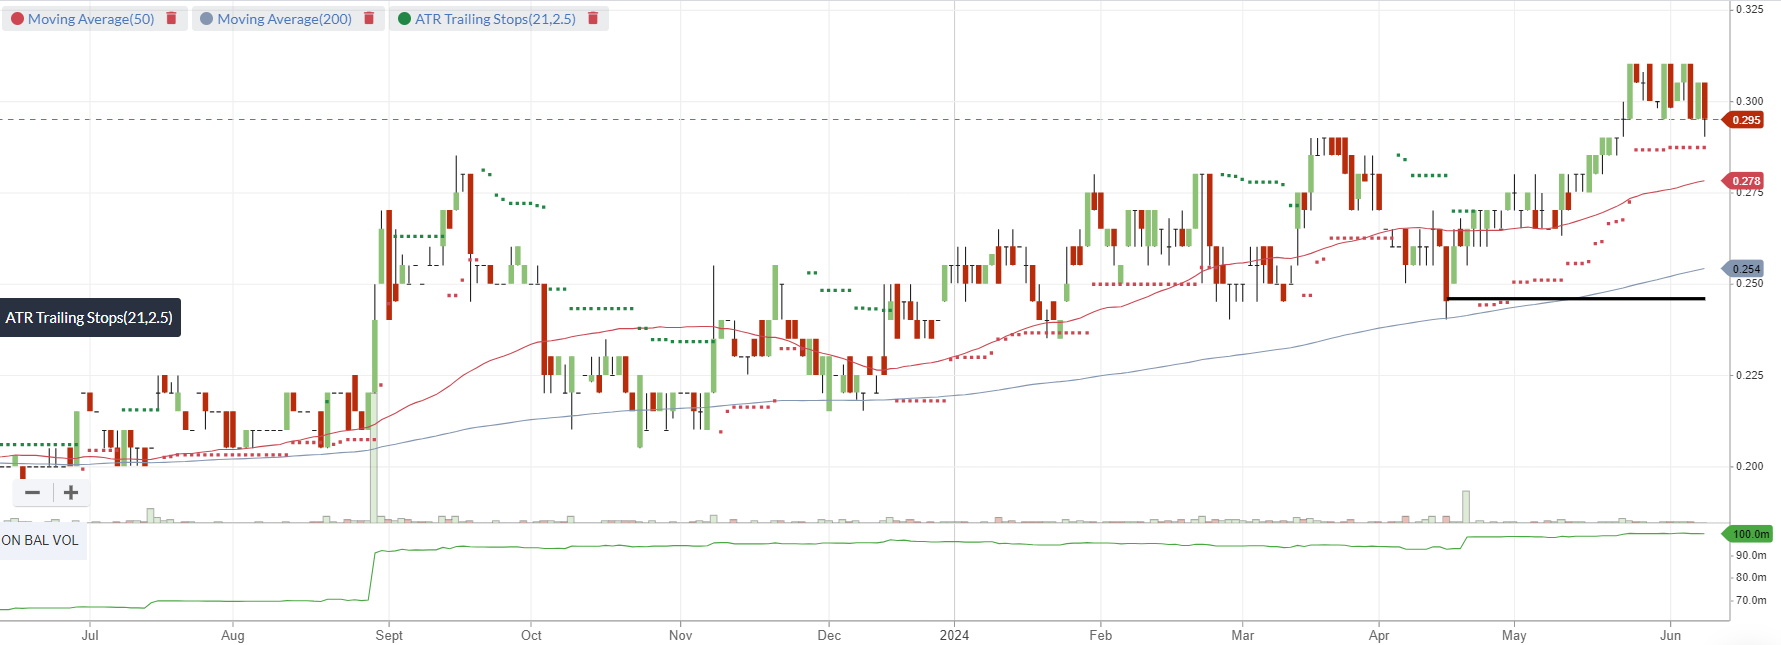
Back then I discussed its size and its lumpiness and why it makes it more difficult to analyse such stocks from a Momentum perspective. Notwithstanding that I also pointed to the strong half year report and to the long basing pattern that the stock had undertaken. I am now happy that the price has broken and closed about $0.295 (though I noticed it is back there this morning.)
But the break saw it reach 52 week highs and currently it is bubbling along that level. All things considered I am happy because ultimately what I want to see is a break above $0.34. If it does that it will be in levels not seen since Early January 2022, and prior to that 2007. Anyway I am stating the obvious when I say that the price has some Blue Sky ahead of it if it cracks that level.
It has been supported by a number of contact wins recently including the Engie Group contract and it also received word that it would be the sole distributor in New Zealand of the Fulton Product. The Directors certainly like it. And it seems the Baltec IES division is making some very solid gains. And is the Stockopedia land it rates well on Quality which is unsurprising. The only elements being ROE could be a little higher and the Piotroski F-Score is also middle of the range. But is profitable, growing and generating positive cashflow. It will be nice to see some of that come back to investors, however re-investing into itself now makes sense given the forecast EBITDA growth of 45% for the full year. It actually restated this target in a recent presentation to a room of Brokers at Wilsons (though it seemed a passing comment.) This is important because it was given towards the end of May, suggesting things remained on track.
Like most businesses they are keen to lift their recurring revenue mentioning the word recurring no less than 5 times in their half year report. According to them over 50% of their revenue is now recurring which of course builds a more predictable and reliable earnings stream than lumpy contracts. And though the number of shares have been increasing, the acquisitions seem shrewd, for example the $7 Million + $5 million on targets achieved acquisition of Airtight Pty Ltd seems to be aligned with their dust collection solutions. While peak COVID may be over, the demand for such services will remain for some time, further it has diversified itself in a number of areas where it can relevant.
All in all there is a lot going on that keep an investor interested in this business. Given its size and liquidity I am not in it at the minute, though I suspect its future price direction will be dictated by the ongoing announcements and more importantly the increase of recurring revenue. For what it is worth, structural support I feel is at $0.245. Traders may feel $0.265 is more appropriate as a stop loss from these levels.
Stocks in the Shine Zone
To learn about the Shine Zone and how to use it, you can read it here.
The rules for inclusion in this list are based on those I like to see in a stock before considering a trade in it:
QM Rank above 80
Price is above the 2.5x ATR
50d MA is above the 200d MA
Price is greater than the 200d MA
Market cap greater than $200M
This is a very important point: the “Shine Zone” are rules for possible buying. They are not for holding and/or selling. If a stock falls out of the shine zone, use support levels to set your stops, or instigate a parachute stop if necessary. With markets moving sideways, one expects frequent changes in these lists.
If you feel there is a stock that should be included but is missing please let us know. This is a manual process and occasionally one gets through the cracks
Also look at the market capitalisation and liquidity before making any decisions!
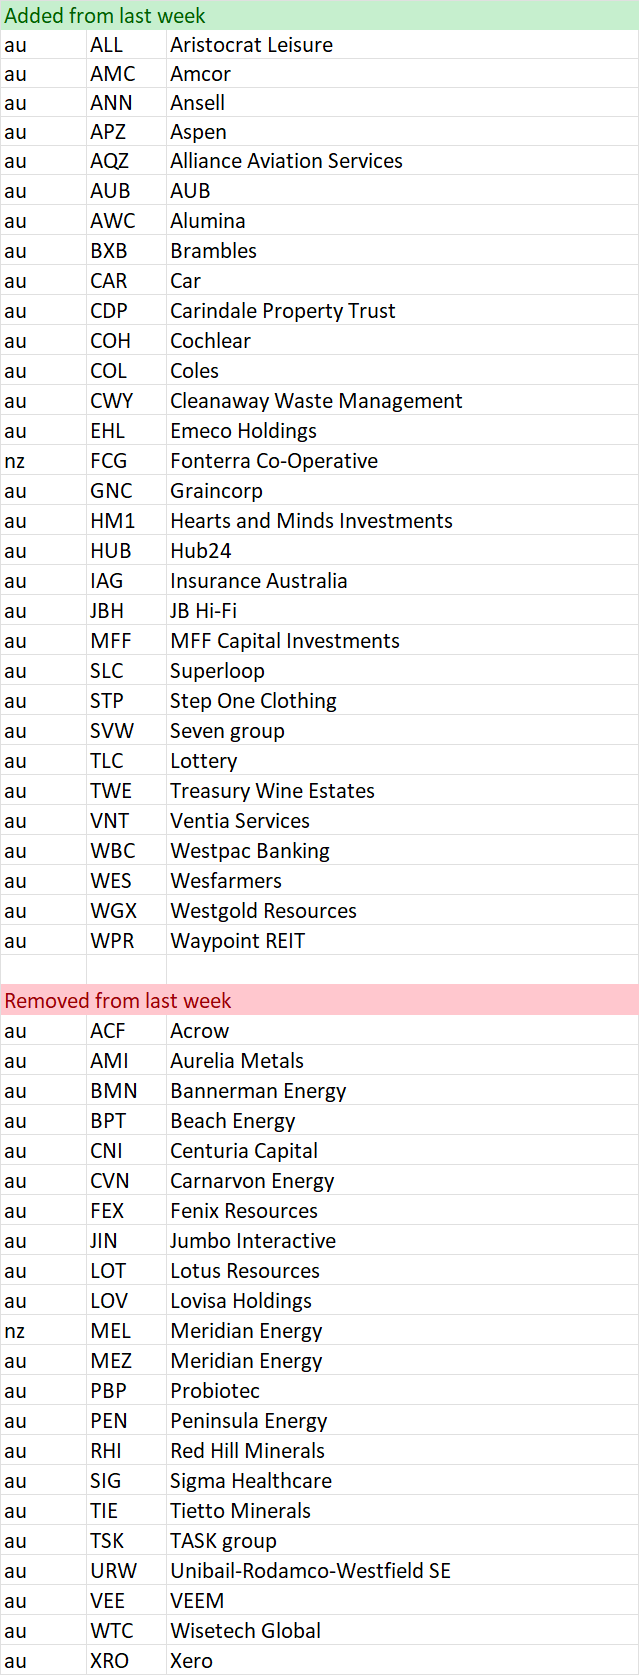
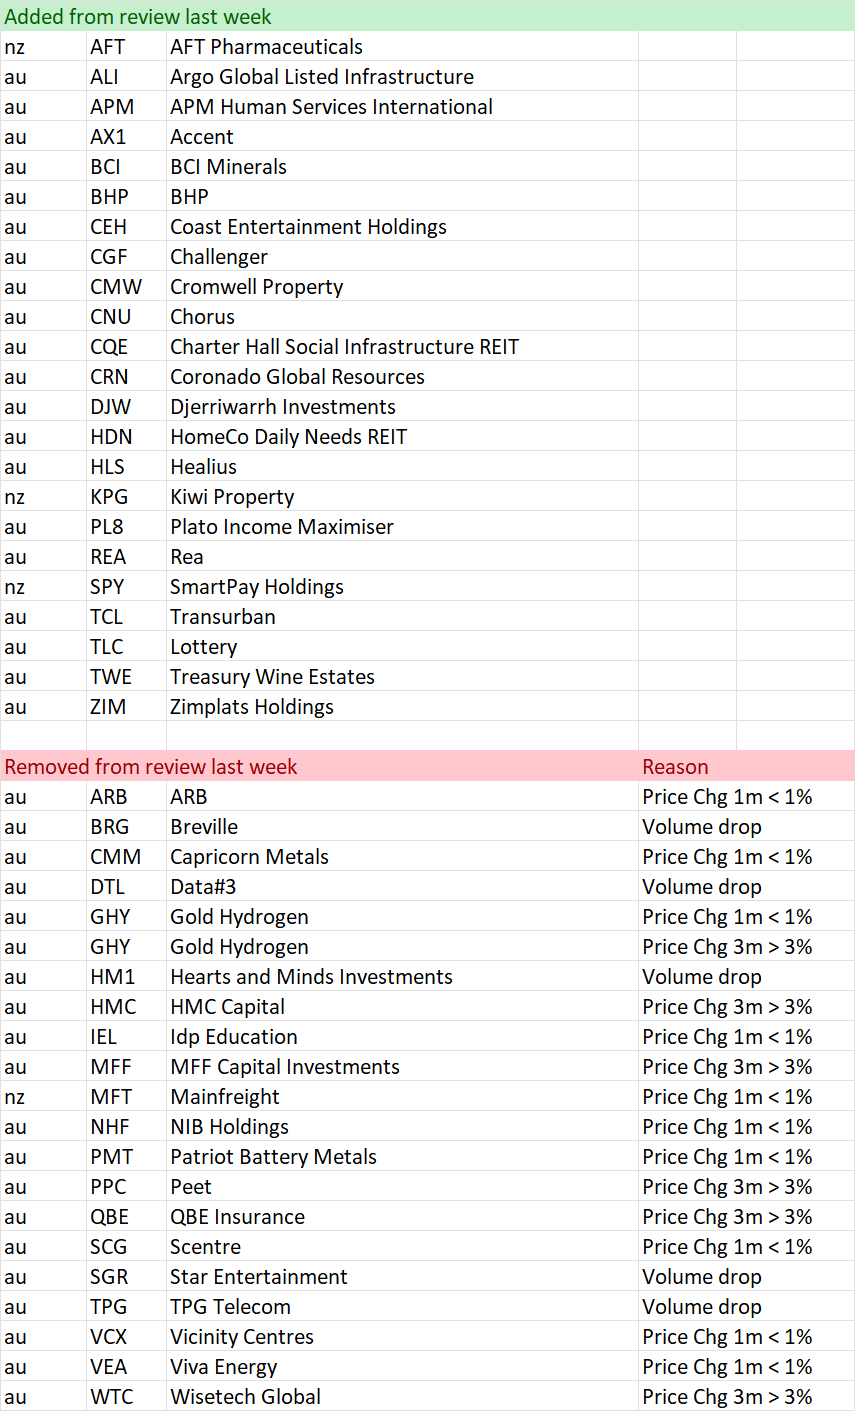
Data is at 08 June and is sorted by the stock code.
Changes from last week
Shine Zone list as at 08 June

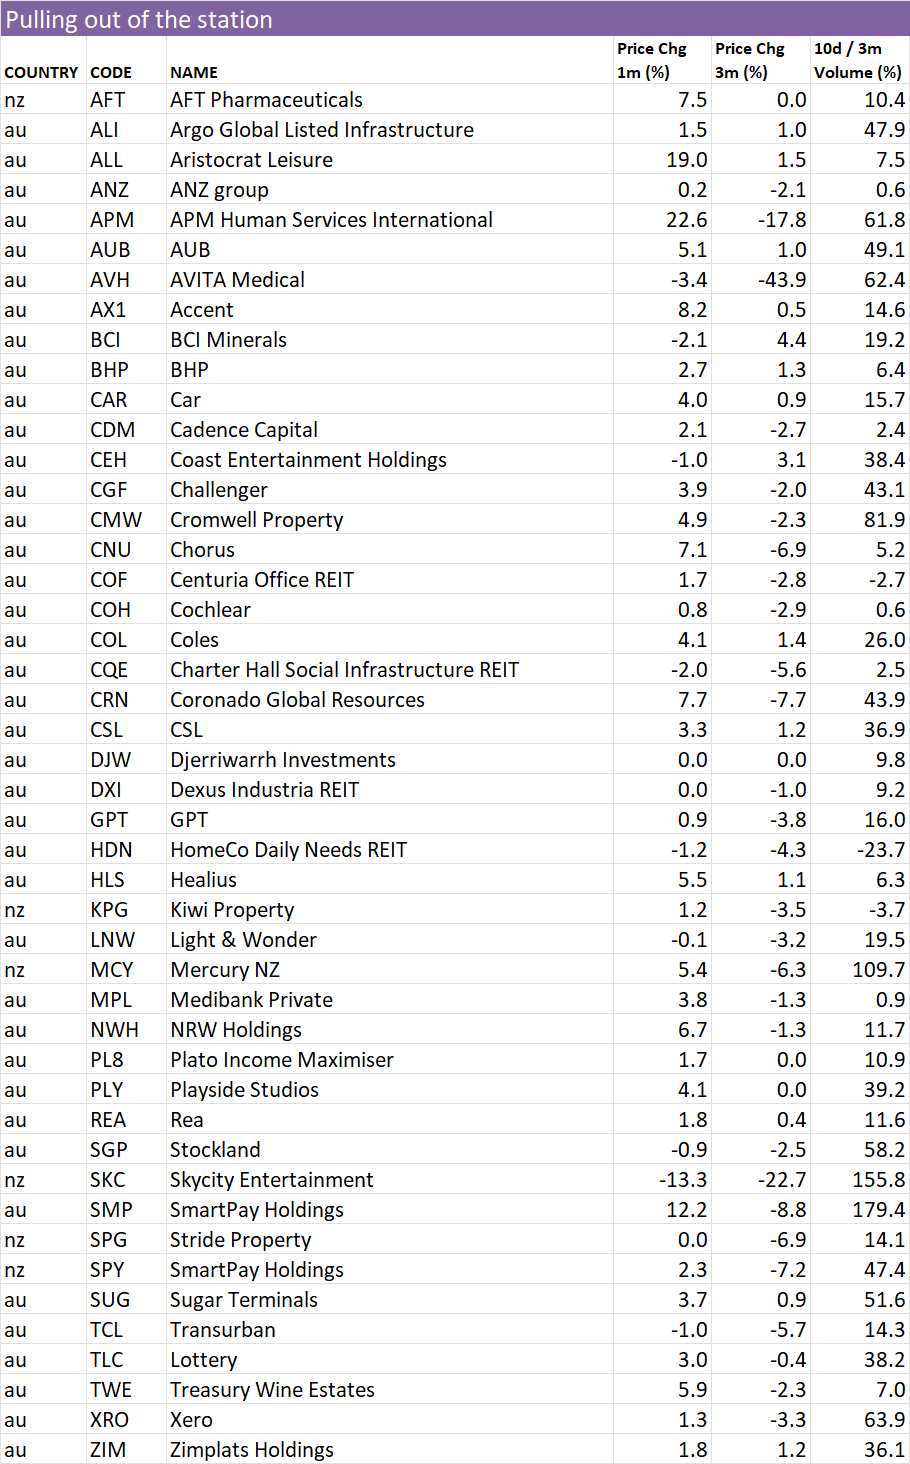
“Bus pulling out of the station”
To learn more about this screen read the following article on the objective of the screen
Here is a shortcut in understanding the reasons why a stock is removed:
Volume drop = Bus might be moving, but no one is on it
Price 1 mth < 0% = Bus has been cancelled
Price 3mths >= 3% = Bus has pulled out of the station
Also look at the market capitalisation and liquidity before making any decisions!
Data is at June 08 and is sorted by the stock code.
Changes from last week
“Pulling out of the station” on 08 June
52 week high screen
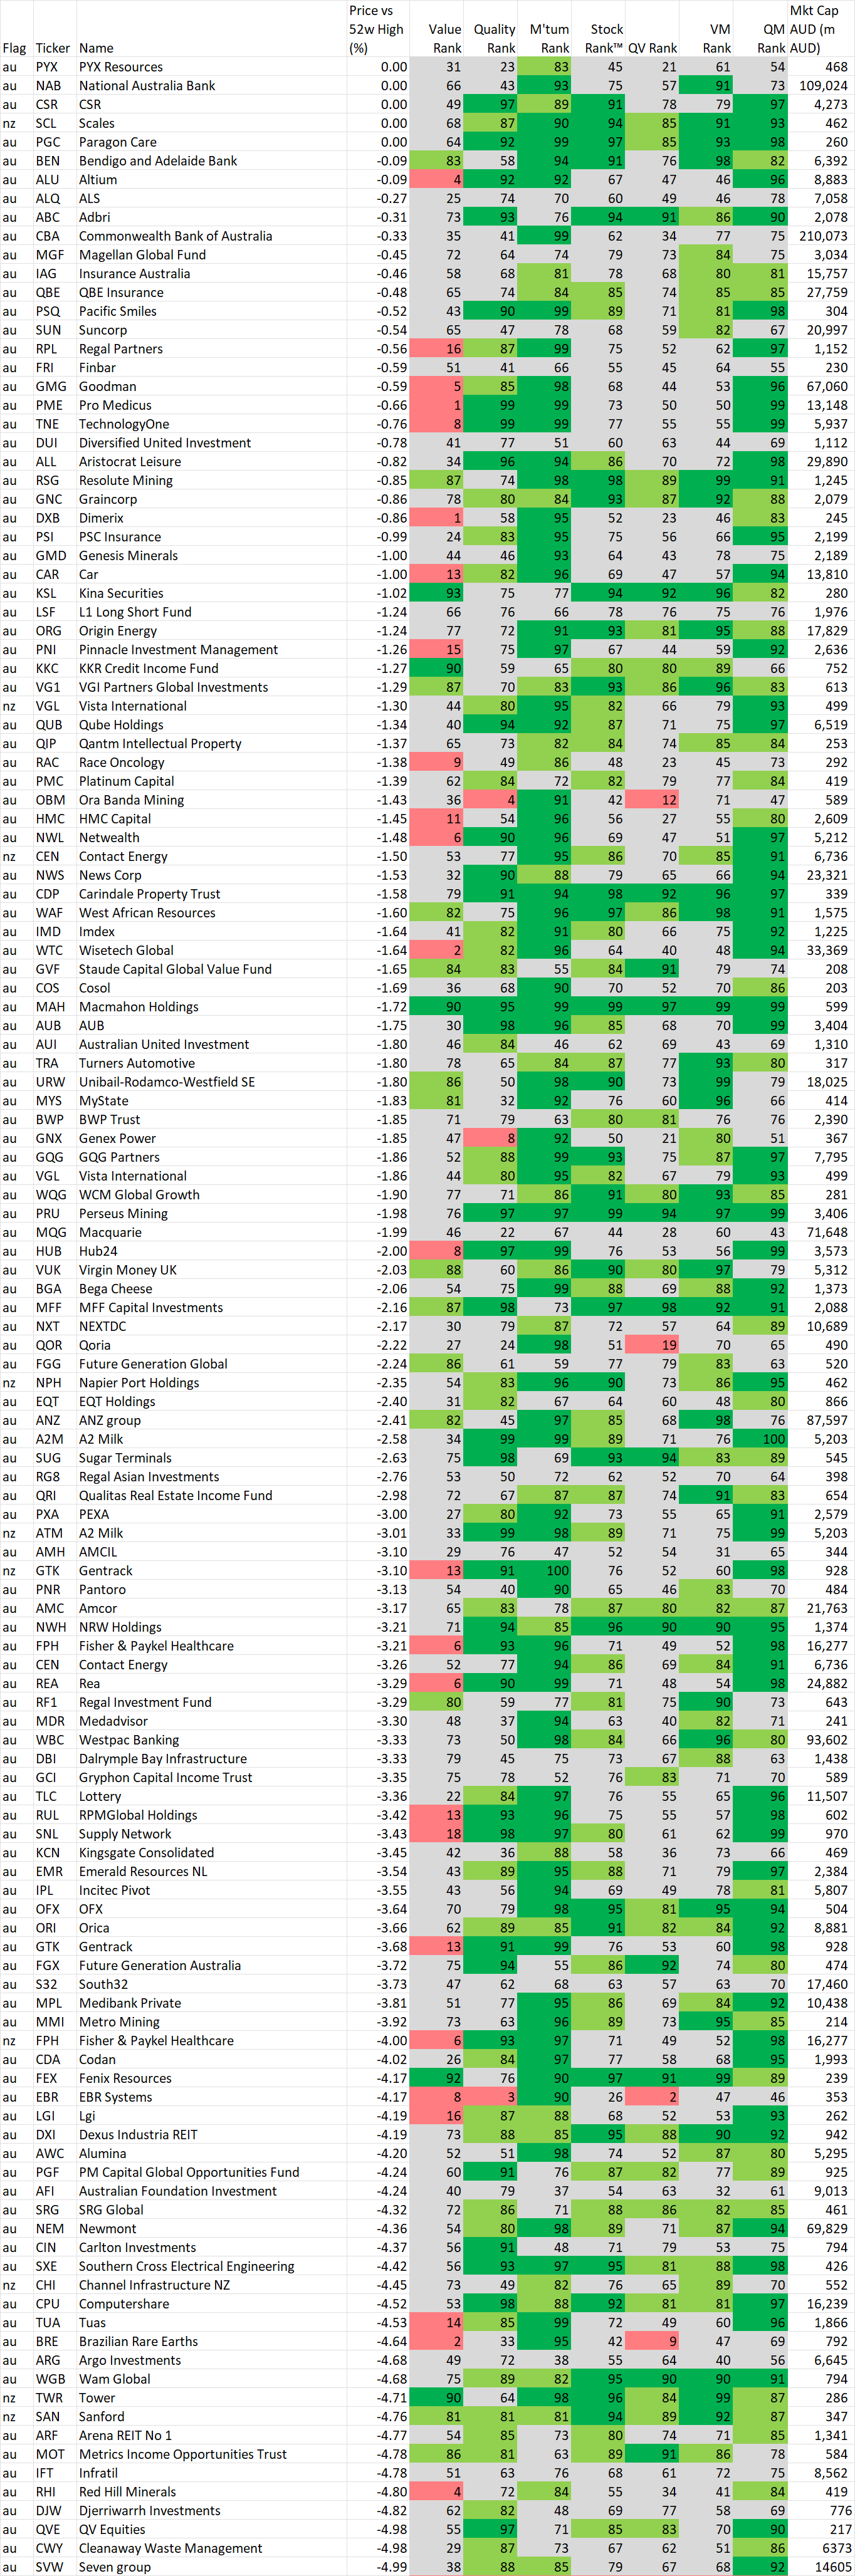
In this section we identify stocks within 5% of their 52 week intraday high based on the idea, supported by academic studies, that stocks close to their 52 week highs tend to outperform. Weekly changes to the list will also be noted.
If you wish to recreate this screen in the screener select "Price vs 52 high" greater than -5% and Mkt Cap greater than $200M
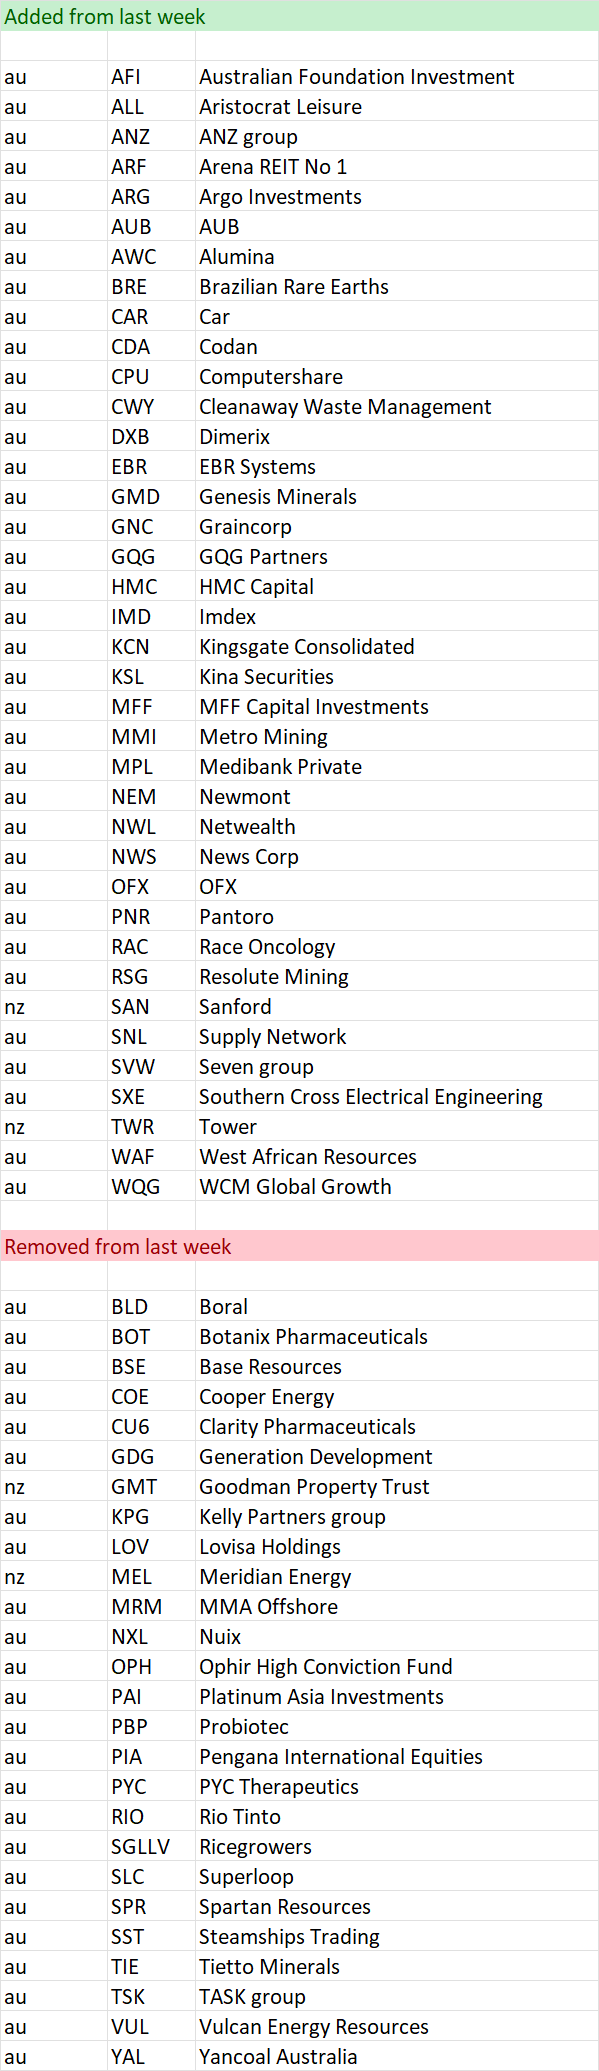
A stock coming onto the list is NOT an automatic buy, just as a stock that leaves the list is NOT an automatic sell. As with the shine list, assess every chart on its merits. However movements on this list may alert you to interesting charts so be sure to look at Stockopedia and the chart first.
Data is at 08 Jun and is sorted by the stocks closest to their 52 week intraday high.
Also look at the market capitalisation and liquidity before making any decisions!
And remember, past performance is no guarantee of future performance.
Changes from last week
Stocks within 5% of their 52 week high as at 08 Jun
Important Information: Stockopedia Ltd ABN 39 757 874 670 UK business registration number 0637267 (“Stockopedia”) is an Authorised Representative of Daylight Financial Group Pty Ltd ABN 77 633 984 773 (“DFGPL”) which is the holder of an Australian Financial Services Licence (AFS Licence No. 521404).
Information in this commentary is current as at date prepared unless otherwise stated. However, please bear in mind that investments can go up or down in value, and that past performance is not a reliable indicator of future performance. For more Important Information please refer to the Disclaimer section of this website.
This communication may contain general financial product advice. It has been prepared without taking into account your personal circumstances, and you should therefore consider its appropriateness in light of your objectives, financial circumstances and needs before acting on it.
If our advice relates to the acquisition or possible acquisition of a particular financial product, you should obtain a copy of and consider the Product Disclosure Statement (PDS) before making any decision.
The author holds interests in LOV and companies listed in the data tables . This position can and will change at any time without notice.
Disclaimer
This is not financial advice. Our content is intended to be used and must be used for information and education purposes only. Please read our disclaimer and terms and conditions to understand our obligations.
No comments yet
No one has commented here yet! Why not be the first one?