Momentum Tuesday (in lieu of Monday) 13 June 2023

Welcome to Momentum Tuesday.
I want to start this week off by highlighting an excellent article recently written by our founder Ed Croft on the topic of Momentum. It is the latest in a series of exploratory articles where he covers more in depth the logic behind the concept of the Factors we use, and how experts are purported to use them.
Be sure to read the article here. I am sure a lot of it will sound vaguely familiar if you've been a reader of this contribution since I started it last year. This is because much of what I apply is from the basis of what these experts have taught (adjusted for my personal circumstances). Therefore if you are a regular reader of this contribution, I strongly urge you to read Ed’s latest contribution.
This is just of a series of excellent articles covering different strategies combining various ranks and styles. His recent contributions can be found using this link, with his most recent article published last night, "Trending Value - the strategy for Bargain Hunters". Be sure to give a thumbs up if you find the content of interest, and if you feel inclined be sure to leave Ed a comment in the section below. He loves hearing from us.
Also last Friday we ran our first and highly successful Friday Lunch session, a way for us to interact with our "Stocktopians" to chat about the market and answer questions. If you missed the session you can view a recording here. We will be looking to run one of these per month, so tentatively keep lunch on the second Friday of the month clear in your calendar. We will confirm the timing in due course.
Thank you to those who have already performed their civic duty and actively engaged with our new referral program, we are humbled by your support at this early stage without much prompting. We will be sure to deliver a wonderful experience to your friend and should they stay on, we’ll be in touch.
The content for this week's edition is:
Broader market sentiment
Member corner
Stocks in the “Shine Zone”
52 week high screen (including changes)
A reminder that you don’t have to read all of it. Simply scroll to the area of interest.
If you have any suggestions for us, please be sure to include them in the comments below.
Broader Market Sentiment
We look at the direction of both the US and ASX markets to gain an understanding of the broader sentiment at the minute. While this analysis is not to time specific entry into or exit out of stocks, they are useful in helping us determine how aggressive/cautious traders should be in their trading.
US S&P500
(Note: US Markets were open on Monday, This commentary has been prepared using insights based on the end of the previous week (Friday) close. Please be cognisant of this when reading the information, as views may change as a result.)
The US market rose 0.39% and was positive for the fourth consecutive week, and as mentioned last week, is now at 52 week highs and at levels not seen since April 2022

S&P500 Weekly Chart
The immediate levels to watch remain:
Upside target 4543 (the lower high of March 22)
Short-term support level 4056
Medium term support level 3840

S&P500 Weekly Chart - levels of interest
As you all know by now, prices never move in straight lines, therefore be prepared for a pullback at some stage as the index will need to regain its strength for another push up. This is why I note the downside targets as well, because for as long as the index remains above these points then the market is orderly. If it fails to maintain support, then we need to reassess our views. (Note for new readers: I don’t use charts to predict the future. Rather I like to use them more like a weather report. Eg if it is raining, don’t cut the grass.)
But withbears somewhat conceding to the bulls in the near term, please reacquaint yourself with last week’s Momentum Monday as to why the latest move has been positive for sentiment.
All this of course in an environment where the consensus for corporate earnings in the June quarter will likely fall. Interesting times indeed.
Next week we have US inflation numbers and a moderate read will add support to the market view that rates will remain stable at the June meeting of the Fed.
As has been the case for a long while now, we can remain exposed to markets, though we still need to be on alert.
AUS S&P/ASX200
The decision by the RBA to raise interest rates, including the likelihood that another rate rise is on the way drove another negative week for the market with the XJO down -0.3% for the week, our third in a row. Cracks widening within the retail sector, a stressed consumer and what appears on the surface a shell shocked government hasn’t helped contribute to

S&P/ASX200 Weekly Chart
The immediate catalyst of level of 6995 holds, and the bottom support of 6474 will hopefully not be tested. The chart still has a bearish feel, supported by calls from economists of an increased likelihood of a recession and more interest rate rises to come.
I honestly don’t know how many ways I can write “the market is on a knife’s edge” as I have said it for a number of weeks now.
The chart has moved from ‘bullish’ and ‘bearish’ feels like a well contested Test Match, yet we are still on track for a draw. Any mind space dedicated to this feels like a lot more effort than it is worth.
One thing I want to pay some attention too is the concept by some that the ASX200 lags the S&P500.

S&P500 vs ASX200 2 year Daily Chart
Over the past 24 months the difference in performance has been negligible (-1.23% S&P500 vs -2.55% ASX200). There have been periods of interchangeable performance where the S&P500 performed better in the lead up to 2022. The ASX200 then performed better in a relative sense as we didn’t fall by as much. And since the lows of Oct 22, the S&P500 has taken the mantle of best performer.
What does this all mean? It means the S&P500 has been more volatile over the past two years, however over a longer period the ASX200 has delivered the same performance with less stress. How would you have felt being invested in S&P500 during Jan - Oct 2022 when the market fell 25% versus our ASX200 which fell 12% over the same period?
Its important to note that often Australian / US markets don’t differ too much in terms of “direction” over the long term. The only thing that is different is the size of any particular move and the US traditionally tends to be the more volatile.
That said, this correlation has temporarily broken down since late April where there has been a clear divergence of the two indices. So if you believe that one will eventually revert to the other, the question is who will blink first? Will it be the S&P500 who comes back down, or will the ASX200 who goes up? I hope it’s the latter, but we shall see.

S&P500 vs ASX200 6 month Daily Chart
My last comment for Momentum investors, “less is more” in sideways markets. So wait for clear signals to act on.
Member corner
In this section we will provide a detailed chart assessment, on a maximum of ten stocks weekly, on companies from those of you in the Gallery.
If no one asks for a stock to be analysed, this section will remain blank.
Also please note, that while we may receive a number more queries than ten per week, we retain the right to save a stock for another week, or ignore it all together.
The analysis will be akin to what was covered under the “Stocks of Interest” within the previous Momentum Monday reports and is highlighted in the Shine Zone area below.
If you have a stock you would like analysed from a momentum perspective, please write it into the comments section below or email us at support@stockopedia.com.au.
ASX:HLI Helia
StockRank 91
Momentum Rank 94
QM Rank 78
VM Rank 99
A$3.21
Helia (ASX:HLI) (formerly known as Gentrack) are a dominant Loan Mortgage Insurance (LMI) provider in Australia supporting those who fail to meet sufficient deposit thresholds when acquiring a property. It is an interesting stock to analyse because the dynamics that drive earnings are well beyond simple housing demand housing demand - though it is a big contributor,.

ASX:HLI 1 yearDaily chart
The stock this week fell out of the “shine zone” as price has fallen below the 2.5x ATR, however does that make it a sell?
The price broke a very short-term support level of $3.25. Though I think the level of $2.76 would be more appropriate. However, does such a large potential drawdown make sense in the current climate?
The specific question was whether the current high margins can be sustained and the immediate answer is likely “no”, though they will stay high. It is important to remember that the company sources their funding from open markets which is becoming more expensive. Further, net earned premium (NEP), the company’s underwriting result, and insurance profit are likely to keep falling in the current climate, squeezing the revenue side.
But there are positives, it is a capital light business, can deliver it’s service on a needs basis (rather than have to build inventory), there is large demand for its services particularly from first home buyers, they maintain dominant positioning and their re-insurance program ensure that operational they can continue to operate within this tough environment. This is likely why the price held up so well since the annual report. However, as discussed, sentiment has changed this week on account of the latest rate hike and likely another to come. Therefore it is likely they will see a haircut to margins when they next report.
That said, exclude all that is written above, ask yourself, are the risks to the upside (do better than expected) or the downside (do worse than expected)? I say this because when you have money in a stock, you have money at risk. And holding a stock means you view risks to the upside (not the downside.) Whether an investor continues to hold is a balance between their strategy and where the risks lie.
That’s where Stockopedia helps. It makes the strategy part super easy, giving you the focus to assess the risks.
So in the case of HLI it is a high quality company, but where do the risks lie and are you comfortable with them? If so then $2.76 may be an appropriate stop loss level. If not then perhaps you can move it tighter. If you are petrified, then that short term level recently breached may be the trigger a trader needs? Only one person can answer that.
Last point, even if someone were to sell them, you can always buy back in if the risks abate. It's only brokerage after all!
ASX:DTL Data#3
StockRank 82
Momentum Rank 91
QM Rank 95
VM Rank 70
A$6.90
Data#3 (ASX:DTL) has had a great 12 months and holders should be congratulated for being on the ride.

ASX:DTL 1 year Daily chart
However, since falling out of the “shine zone” in early May, it has not been a buy, so the question is, is it a sell?
The request for DTL intimated that the stock was rolling over and there is direct evidence of that. Since reaching its peak close in April, the stock created a support level at $7.13 which it subsequently broke at in late May, and has since stayed below.
The price is also right on the 200 day moving average adding further risk to the downside. I feel the stock could quite easily fall to $6.23. Whether you are happy to cop that drawdown depends on your own personal circumstances and when you bought the stock in the first place.
Had I held for the last year (I don’t) I would be inclined to wait until then. All stocks need a breather, especially after strong runs. DTL is undeniably Quality with a strong book of clients, but obviously tough times will hit their clients as well. $6.28 would still represent solid gains and would allow the stock time for the economy to sort itself out.
Though these are interesting times and a reading of the previous annual report to understand who their clients are and how likely they will stick through the cycle is recommended? According to the company, “Approximately 66% of our total revenue is recurring, derived from contracts with government and large corporate customers to fulfil their essential IT requirements.”
For now analysts back that their clients will stay and spend.

ASX:XRO Xero Limited
StockRank 67
Momentum Rank 99
QM Rank 92
VM Rank 59
A$109.08
Accounting software provider Xero (ASX:XRO) has been in the shine zone for some time and has seen strong support for its price. I last spoke of XRO in February. At the time I said the stock needs to break $97.11. I also mentioned that investors may want to wait for a retrace, which actually didn’t happen. Instead, it went sideways for another month and a half (bullish signal) until it gapped up on the release of its result as it announced continued growth of clients and ARPU (Average Revenue Per User).

ASX:XRO 1 year Daily chart
The stock is now in the “shine zone” (since end of March) and its at 52 week highs
While obviously many will point to the risk to small businesses in the current climate, XRO offers a sticky solution that for as long as a business is able to stay open, therefore clients will remain loyal for as long as their lights stay on.
The market really liked the latest announcement not just because of the rate of earnings growth and cash flow improvement, but also because new management appears to have a more balanced focus on profitable growth and capital allocation, rather than just total re-investment into the business. Time will tell whether that proves a masterstroke or hindrance. But for now the market is giving it the thumbs up.
Given the recent rise, a close call stop of $97.11 would be appropriate.
Stocks in the Shine Zone
To learn about the Shine Zone and how to use it, you can read it here.
The rules for inclusion in this list are based on those I like to see in a stock before considering a trade in it:
QM Rank above 80
Price is above the 2.5x ATR
50d MA is above the 200d MA
Price is greater than the 200d MA
Market cap greater than $200M
To reiterate that the “Shine Zone” are rules for possible buying. They are not for holding and/or selling. Read the “how to” article above to learn more
Data is at 9 June and is sorted by the stock code.
Changes from last week
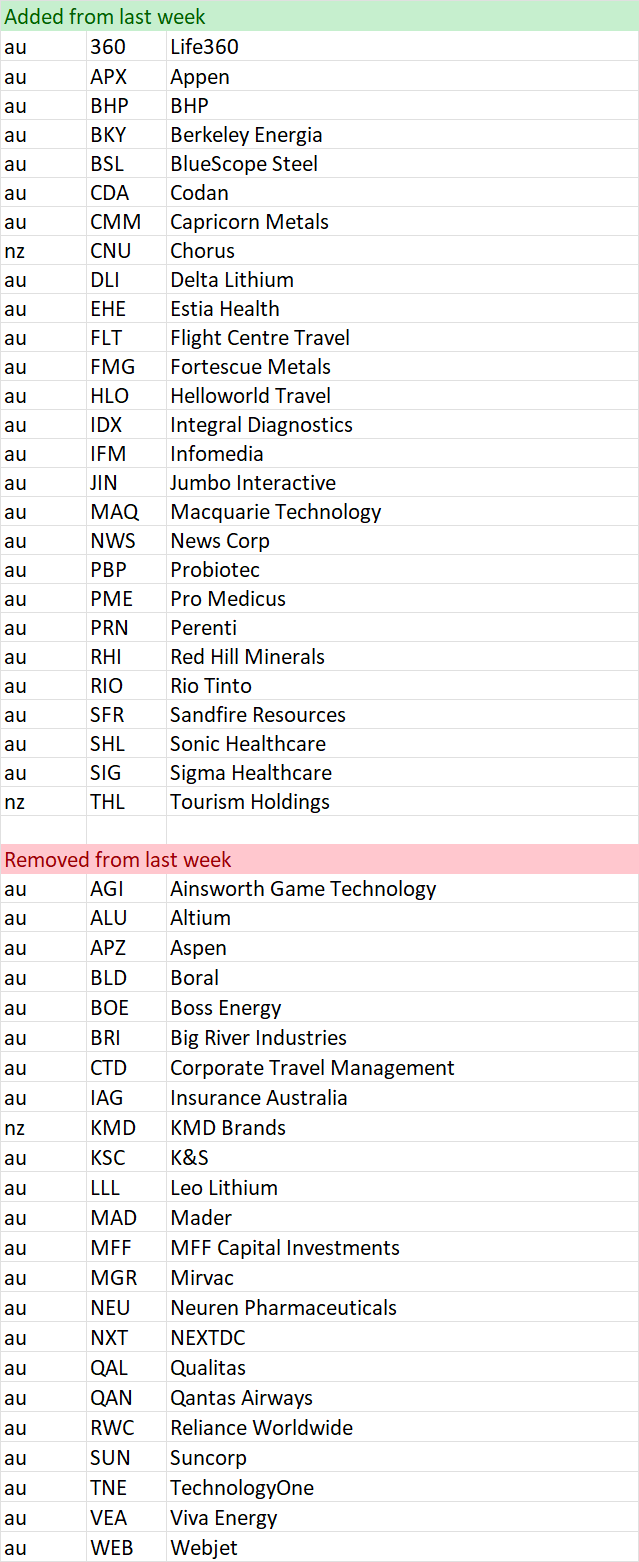
Shine Zone list as at 9 June

52 week high screen
In this section we identify stocks within 5% of their 52 week high based on the idea, supported by academic studies, that stocks close to their 52 week highs tend to outperform. Weekly changes to the list will also be noted.
If you wish to recreate this screen in the screener select "Price vs 52 high" greater than -5% and Mkt Cap greater than $200M
A stock coming onto the list is NOT an automatic buy, just as a stock that leaves the list is NOT an automatic sell. However movements on this list may alert you to interesting charts so be sure to look at the Stockopedia and the chart first.
Data is at 2 June and is sorted by the stocks closest to their 52 week high.
And remember, past performance is no guarantee of future performance.
Changes from last week
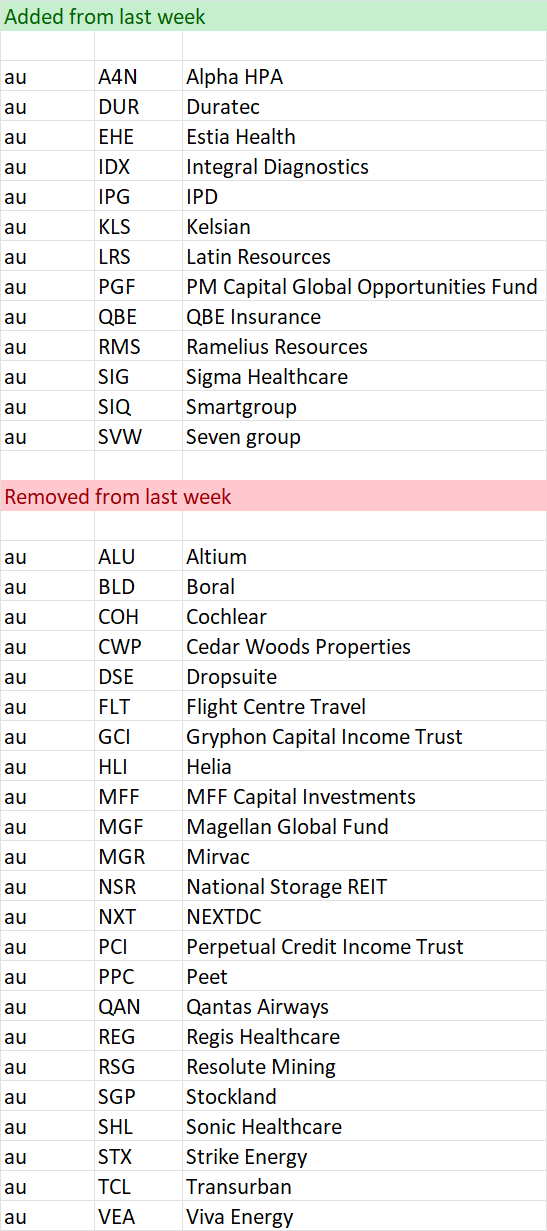
Stocks within 5% of their 52 week high as at Jun 9, 2023

_____
Important Information: Stockopedia Ltd ABN 39 757 874 670 UK business registration number 0637267 (“Stockopedia”) is an Authorised Representative of Daylight Financial Group Pty Ltd ABN 77 633 984 773 (“DFGPL”) which is the holder of an Australian Financial Services Licence (AFS Licence No. 521404).
Information in this commentary is current as at date prepared unless otherwise stated. However, please bear in mind that investments can go up or down in value, and that past performance is not a reliable indicator of future performance. For more Important Information please refer to the Disclaimer section of this website.
This communication may contain general financial product advice. It has been prepared without taking into account your personal circumstances, and you should therefore consider its appropriateness in light of your objectives, financial circumstances and needs before acting on it.
If our advice relates to the acquisition or possible acquisition of a particular financial product, you should obtain a copy of and consider the Product Disclosure Statement (PDS) before making any decision.
The author holds interests in stocks highlighted specifically in the article: XRO and other companies listed in the data tables . This position can and will change at any time without notice.
Disclaimer
This is not financial advice. Our content is intended to be used and must be used for information and education purposes only. Please read our disclaimer and terms and conditions to understand our obligations.
2 comments
Thanks Elio, great article. Mader (ASX:MAD) looks to have an intriguing chart setup with volatility and volume contracting nicely on a breakout retracement from a beautiful cup and handle pattern and would also appreciate your thoughts on TechnologyOne (ASX:TNE). A great example of a breakout from a sideways VCP currently is McMillan Shakespeare (ASX:MMS)
Thanks for the article. Audinate looks like it's had a lengthy Minervini VCP pattern form since September last year, and finally broke out on 25th of May. After a retracement to the point of breakout, it's turned up again perhaps for the next leg up. Thoughts?