Momentum Wednesday (in lieu of Monday) 28 December 2022

Welcome to this shortened trading week and to Momentum Wednesday (in lieu on Monday). Markets will also be closed next Monday as well so we too will alter the timing of this report to suit.
And just to start us on a positive footing, we at Stockopedia hope that you will all have a prosperous New Year, both in wealth and good health!!!
_______________
Anecdotally it is tough to generate any clear direction at this time of year... however it can definitely play a role in maintaining the continuation of a trend.
Therefore before we commence this week’s analysis, we caution reading too much into any signals provided at this time.
But of course, investors still need to respect the broader narrative and trade accordingly. (Otherwise why bother writing this week’s edition?)
S&P500
The S&P500 had its third negative week in a row. Further entrenching it within the down channel that has formed from the peak a little under 12 months ago now.

S&P500 Weekly Chart
2022 will likely be recorded as a down year for the S&P500, its first since 2018. The good news, barring disaster, is that it won’t be as bad as 2008 (GFC related) which was our third worst annual performance for the S&P500 on record.

S&P500 Performance since 1928 Source: MacroTrends.net
Bringing it back to the present day, Despite the downward move, we are still above the range of 3700 - 3740 meaning there is hope. We flirted with the top of the range on Friday which you can see on the chart. But for now we are holding.
Even lasts night’s fall (27/12) of 15.58 points to 3829.24 was not enough to break the line yet.
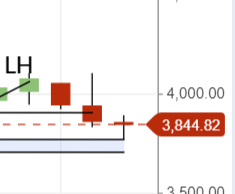
As a reminder, a break below this range will likely see a test of the downward part of the channel of between 3300-3400.
The lead up to the New Years trading Holiday in the US will likely be more keenly watched than usual, given where the index sits.
S&P/ASX200
Likewise, we too experienced our third consecutive down week for the S&P/ASX200

S&P/ASX200 Weekly chart
But as highlighted in last week's newsletter, there is hope that any pull back will stay above the range of 6760 and 6830, as a bounce off these levels would create a new higher low, and prepare us for a run at prior resistance levels.
The RSI remains above 50, despite the week, emphasizing the indecisiveness at the minute (given than an RSI of above 50 is normally associated with rising prices.).
Though I feel there is no need to rush any trade as the market could keep falling to 6470. So as has been commented on prior, it's best to be patient and trade only on the perfect set up. The risk is if the market moves against you, no QVM score will insulate you from a sell off and your stops being.
It is interesting to see that the 50 day EMA is acting as a mini support level towards the end of the week, being tested on 3 of the past 4 days. It will be interesting to see what happens once price moves off it (either up or down) as that could move short term sentiment.

In another pleasing note the MACD remains positive, though three consecutive down weeks has reduced the size of width the moving averages are further reduced, showing the shift in sentiment the last three trading weeks.

Stocks of interest
Author note: In line with the approach I am using with Stockopedia, I will focus the majority of my attention to stocks with a QM rating above 80 and market cap above $500M. To learn more please read the last instalment of my momentum journey here. I will discuss where their charts presently sit to provide context for potential and current investors.
These stocks are considered purely for the purposes of education. Be sure to read all relevant commentary to understand the context from which a chart is presented. It’s not always positive!
ASX:LOV Lovisa Holdings QM score 100
Lovisa Holdings (ASX:LOV) has been a mainstay in many a momentum portfolio for sometime now, but it would appear that some of the lustre is starting to wane.

ASX:LOV 6 month daily chart
It started at the end of November when the price most recently fell below the ATR indicating a possible change in sentiment was occurring. Since then, the price has tracked sideways waiting for catalyst either way to define its next move.
This protracted sideways move now sees the stock trading around the 50 day EMA, which it to has started to flatline after rising since July 2022.
I feel the price of $21.30 will be significant as that was the previous Higher Low (HL). Therefore it could also act as a parachute stop loss level for those keen to try their luck on the back of the recently completed Christmas retailing period. However my rule is to not consider a stock until the price is above the ATR so new investors may wish to see strength return first.
While it’s still early days and breaking below that level of $21.30 is unlikely to cause any significant sell down, it would indicate a new Lower Low (LL) and possibly the beginnings of a structural downtrend. Holders (like me) will definitely keep an eye on what happens next.
ASX:PMV Premier Investments. QM Score 99
Likewise with LOV, Premier Investments (ASX:PMV) has enjoyed a great ride to this point from the June lows, peaking during the business sales period of the year for the company.
The stock is well off its 2021 highs still, however the subsequent pullback experienced to the June/July lows had been relatively aggressive and for now it appears to have found a floor as indicated by the 50 day EMA crossing above the 200day EMA a few weeks back.

ASX:PMV 1 year chart
For now the price appears to be stuck in a range and anyone looking to take a position in PMV may best be served waiting to see which direction the price heads. If it breaks above the top end of the range ($25.73) that it has tested three times now, it could set up for another tilt at $30. If it fails to hold the $22.20-$22.28 range, its next level of support will be at $19, and then $15 beyond that.
It will be interesting to see if press coverage like this has an impact on the sentiment of the sector when combined with rising cost of living pressures and rising interest rates.
ASX:WTC Wisetech Global. QM SCORE 99
Another stock which is looking a little tired after a very strong and long run up is the premium IT large cap on the market, Wisetech Global (ASX:WTC) .

ASX:WTC WIsetech Group 1 year daily chart
In June this year the price formed a new LL, however, like many others, saw a strong rebound in prices to September taking them to new all-time highs. However, you will note for the three consecutive days that it traded at those highs, it was unable to sustain the run, and eventually has been stuck in a sideways channel ever since.
For those not in the stock, a clean break above all-time high levels will be needed to prove that this sideways move is behind it. Especially given the downside risk which is a pull back potentially all the way down to $34.63 as that is the last level of any structural support.
Holders therefore will be keenly watching the bottom support of the current channel at $51 - $51.20 as a break below that brigs the downside target above into play.
ASX:TNE Technology One. QM score 99
But it’s important to note that pullbacks are an important component of a stock's journey. Often the longer and harder the run up, the more susceptible it is to a big corrective move. Therefore pullbacks give the stock a chance to breathe, especially if they are highly priced, and to recoup energy for what will be hopefully a prolonged run up.
TechnologyOne (ASX:TNE) has been on a strong recovery of support levels in March and May. So much so it has achieved new all time highs of above $14.

ASX:TNE 2 year daily chart
The price is now experiencing what appears to be an orderly comeback and assuming it holds the previous Higher Low of $10.53, will continue to remain in an uptrend.
Investors in the stock may have noticed that the price has fallen below the ATR, therefore they will be on alert for a possible exit. Which level is chosen depends on their conviction in the business, and the size of their holding.
For those concerned of an aggressive pullback the 50 Day EMA level of $12.96 may be prudent as a stop loss level. Though it it is traditionally not a strong signal, this level may work as price can often bubble along a 50 Day EMA for some time and would allow a trader to retain their capital.
For those with a deeper conviction in the business, the $10.53 level would be adequate.
The stock however is still trading well above its 50 day and 200 day EMA, with both lines headed in the right direction, so for all intents and purposes this is not a chart under strain.
ASX:ASB Austal. QM score 93
A regular frustration for value investors is Austal (ASX:ASB) , who after announcing to the market in July this year that they had won a A$4.35bn contract for the detail design and construction of up to 11 Offshore Patrol Cutters (OPC) for the United States Coast Guard (USCG), with options for a further 10 vessels, saw their price jump 25%

Since the bounce and initial momentum run, the stock has lost the wind in its sails and has started on a downtrend with a subsequent Lower High and Lower Low since the recent peak of August 2022.
Unfortunately the next target is now $1.80 which would close the gap created on the announcement of the USCG deal. For those that believe inthe company, that may prove better buying.
However as the price is currently below the ATR and the two moving averages are converging it is clear the sentiment on the stock is negative (despite the positive re-rate on earnings from analysts over the past 12 months.

Though it is interesting to note that for the past three months there have been no subsequent upgrades to earnings expectations from the five analysts that cover the company. This may be contributing to the loss of interest in the story.
ASX:CIA Champion Iron. QM score 89
Since the great re-opening of China, sentiment for Iron Ore stocks has markedly improved, including for Champion Iron (ASX:CIA) who has seen its price come to life in the last 2 months. The stock looks pretty clear for a run to short term highs of $8.00.

ASX:CIA 1 year daily chart
If it gets there this will be a very significant level. One can see that the $7.80 to $8.00 range for CIA has been significant for sometime.

ASX:CIA 5 year weekly chart
Hopefully it can break above the range and continue on its merry way. However if it fails to break that level, the price over time could retrace to $4.80 before it prepares itselfd for another run.
For holders, no immediate action needs to be taken. Just be aware of the possible scenarios. For non-holders, perhaps wait to see what happens at the $7.80-$8.00 range before committing.
ASX:QAL Qualitas QM score 92
One would think that given the negative coverage of the sector that real estate stocks would be on the nose.
On relatively new listing is Qualitas (ASX:QAL) , a financier to the sector, and it shows no signs of weakness at the minute as the price has risen strongly

ASX:QAL 1 year chart
It has just recently broken out of a rising wedge pattern which is quite a bullish signal. Normally rising wedges are associated with the start of a downtrend as price breaks below the wedge pattern. But in this instance QAL bucked the trend and is now at all time highs.
Price is above the ATR, Moving averages are all going the right way, and a rising OBV is supporting the rising price. Investors taking a position now will need to insert a parachute stop that suits them (For more on the concept of setting a parachute stop please read the article reference above). For those already in the stock who have enjoyed this strong run up, if this proves to be the short-term peak, then there is no need to worry for as long as the price stays above $2.39, and a stop can be set from there.
ASX:GEM G8 Education. QM score 90
It has been a very long time since we have spoken about G8 Education (ASX:GEM) positively from a chart perspective, though given recent moves, hopes spring eternal that a floor has finally been hit

ASX:GEM 1 year chart
But GEM has a lot of work to do. It only recently broke above the $1.13 short-term Lower High and is looking like it is ready to make a tilt at $1.18.
That said, the important level is $1.30. This has been a solid resistance level over the past 2 years (tested in 2020 and 2021) and therefore, any hopes of a recovery will look more promising on a break of that level.

ASX:GEM 5 year chart
The ATR has turned positive and OBV has supported the recent rebound. Also the 50 day EMA has started to head in a north-easterly direction the possible shift in sentiment.
However be aware, even if the price breaks $1.30, GEM is notorious for false signals so be sure to keep your stop losses tight.
ASX:IEL IDP Education. QM score 88
Idp Education (ASX:IEL) has seen the price retrace from +$30 in November. The current pullback is not overly concerning, however it does mean that the short-term high of November is now actuallly a Lower High when compared to the previous peak of March 2022.

ASX:IEL 1 year chart
Therefore we are on the look out for structural support levels to act as a possible exit point if the price is unable to stop falling and correct itself.
The first level would be around $26.14 which was a support level tested twice in August 2022 and September 2022. Holding support and bouncing off it will be a bullish indicator (in my view). For investors who have held the stock for a very long time, the level to watch is $20.80 which coincides with the low in June 2022
Important Information: Stockopedia Ltd ABN 39 757 874 670 UK business registration number 0637267 (“Stockopedia”) is an Authorised Representative of Daylight Financial Group Pty Ltd ABN 77 633 984 773 (“DFGPL”) which is the holder of an Australian Financial Services Licence (AFS Licence No. 521404).
Information in this commentary is current as at date prepared unless otherwise stated. However, please bear in mind that investments can go up or down in value, and that past performance is not a reliable indicator of future performance. For more Important Information please refer to the Disclaimer section of this website.
This communication may contain general financial product advice. It has been prepared without taking into account your personal circumstances, and you should therefore consider its appropriateness in light of your objectives, financial circumstances and needs before acting on it.
If our advice relates to the acquisition or possible acquisition of a particular financial product, you should obtain a copy of and consider the Product Disclosure Statement (PDS) before making any decision.
The author holds interests in the following stocks mentioned in this article: LOV, WTC, TNE, IEL. This position can and will change at any time without notice.
Disclaimer
This is not financial advice. Our content is intended to be used and must be used for information and education purposes only. Please read our disclaimer and terms and conditions to understand our obligations.
8 comments
AND.... why have YAL, WHC et.al. fallen.
No specific reason other than what I responded to under the TER article recently. Often after such a long and strong run, these are the stocks that will fall heaviest when markets get nervous as investors lock in profits.
Hi Elio,
Nice article, thanks.
Can you do some stuff on an Aussie NAPS ? Maybe good time of the year to start a portfolio for the community to follow.
Thanks
Gary
Hi InvestTrader,
Yes we will be replicating the concept of the NAPS portfolio here in Australia. A quant driven NAPs portfolio would be a good exercise for all as an education piece. I have found this old article written by Ed himself which you can read here. It is a great explainer (and thoroughly entertaining) of the NAPS concept and how it can be applied. In won't be too much of an intellectual leap to see how it will be applied in a OzNAPS setting. Thanks for the suggestion.
Disappointing- My Aussie subscription won't allow me access to Ed's NAPS article, which seems a bit odd as usually the articles are accessible? Can this please be reviewed. System wanted me to add a UK subscription ?
Yes - you need a UK sub to view the NAPS stuff. I have complained about this previously
If you have trouble accessing the old article... I have tried to fit much of it here. All data and commentary on markets is out of date and I have attached this article purely for education purposes only
____
By Ed Croft 2015.
"When I first started subscribing to stock market tip sheets in the 1990's, the concept of “New Year Naps" popped onto my radar. Many tip sheets would choose a handful of favoured stocks (naps) for the year in a special section of their January edition. I thought the phrase and practice was an odd idiosyncrasy until I started to spot racing tipsters and bookies refer to naps when considering racing certainties.
It seems that the origin of the phrase 'a nap hand' comes from the traditional English card game called “Napoleon". In the game each player is dealt five cards and declares how many tricks they think they can make. A “Nap Hand" is a declaration that you can take all 5 tricks - so it's only ever used when you've got very strong odds. I've never played or heard of the game Napoleon but apparently it used to be quite popular. The phrase 'nap hand' seems to have been adopted first into horse racing and from there eventually into the tip sheet tradition.
But we don't do tips…
Now, before we publish some Naps, we need to make some disclaimers. As most readers will know, the entire philosophy behind Stockopedia.com is not to 'tip' stocks. Why don't we tip? Firstly and most simply - we don't believe we need to. The history of stock market returns shows that simple rule-based stock picking models have been far more consistent and effective than human forecasts.
The history of human forecasting is riddled with failure. Left to our own biases, we tend to project what's just happened, so our forecasts often lag reality rather than predict the future. Those that want to read up on the appalling accuracy of human forecasting should read Sin 1 (the folly of forecasting) in James Montier's excellent Seven Sins of Fund Management.
In contrast, for the last 80 years or so since Ben Graham began his work on classic bargain investing strategies, simple checklist based approaches have been shown to be far more consistent at beating the market. Put simply, statistics trump stories in stock market strategies, and that's where we put our bets at Stockopedia.
More importantly, we believe everyone is capable of making their own investing decisions. Rather than mirroring the 'broadcast' approach that most financial publications take, our philosophy is to put the best possible tools at your disposal and provide the education to use them wisely so that you can select your own stocks.
A method for our New Year Naps
So it's within this framework that we thought we'd try out an angle to create our own set of New Year Naps - not as a set of 'tips' - but as the outcome of a checklist of rules as follows:
Rule 1. High StockRank - Order the UK stock market by descending StockRank
We've researched the StockRank in detail and believe it's a robust methodology. Portfolios selected with the ranks have performed well in backtests and in 'the wild' - strongly outperforming the FTSE All Share since launch in 2013. There's no reason why good, cheap, improving shares should not continue to outperform their opposite - expensive, deteriorating junk - so it's the basis for generating our Naps list.
Rule 2: Not hard to trade - Remove all stocks which are highly illiquid
We've removed hard to trade stocks from the list as they can be risky, most investors don't want to own them and they can be expensive to trade. So no stocks with less than a £20m Market Capitalisation and no stocks with a bid-ask spread > 5%.
Rule 3: Diversify - Select the single highest ranked stock from each sector
The very top 10 stocks by StockRank include 4 Consumer Cyclicals, 4 Industrials, 1 Financial and 1 Basic Materials stock. Only 4 sectors are represented out of 10 possible. Building a portfolio with such heavy weighting in single sectors can be highly risky - what if the economy tanks when you are loaded with cyclicals? There are 6 other Economic Sectors - Energy, Telecoms, Technology, Healthcare, Utilities and Consumer Defensives - and we thought it more interesting and prudent to cover the highest ranking share from each with an honourable mention for the second best ranked."
Great - look forward to it.