NAPS Portfolio Q1 2025 Review - and a new all time high

Well the last few weeks have been a bumpy ride to say the least, but oddly enough the The NAPS Portfolio closed yesterday at a new high. This is a portfolio that I’ve been running for ten years on a fully systematic basis, just buying a portfolio of 20 high ranked stocks and rebalancing annually. It’s got a terrific track track record. This year, we thought why not challenge it with a discretionary portfolio, based on similar principles, but incorporating a few more dynamic rules from the research insights we’ve garnered over the years. This portfolio is called the QVM Portfolio and was seeded with the same 20 stocks as the NAPS. After a bid for Alliance Pharma in January, this position was switched into the next highest ranked pharma stock - SDI. So while there is some divergence already, it’s minimal, so we’ll discuss both together.
Q1 Performance
Forgive me for quoting this performance up to the 23rd April rather than the end of quarter, but the numbers are broadly similar. The NAPS are up 7.3% year to date, with the QVM up 6.9%. The switch from Alliance Pharma into SDI has created a small performance drag. Nonetheless, both portfolios are significantly beating the FTSE All Share +0.6%, and at new all time highs. =
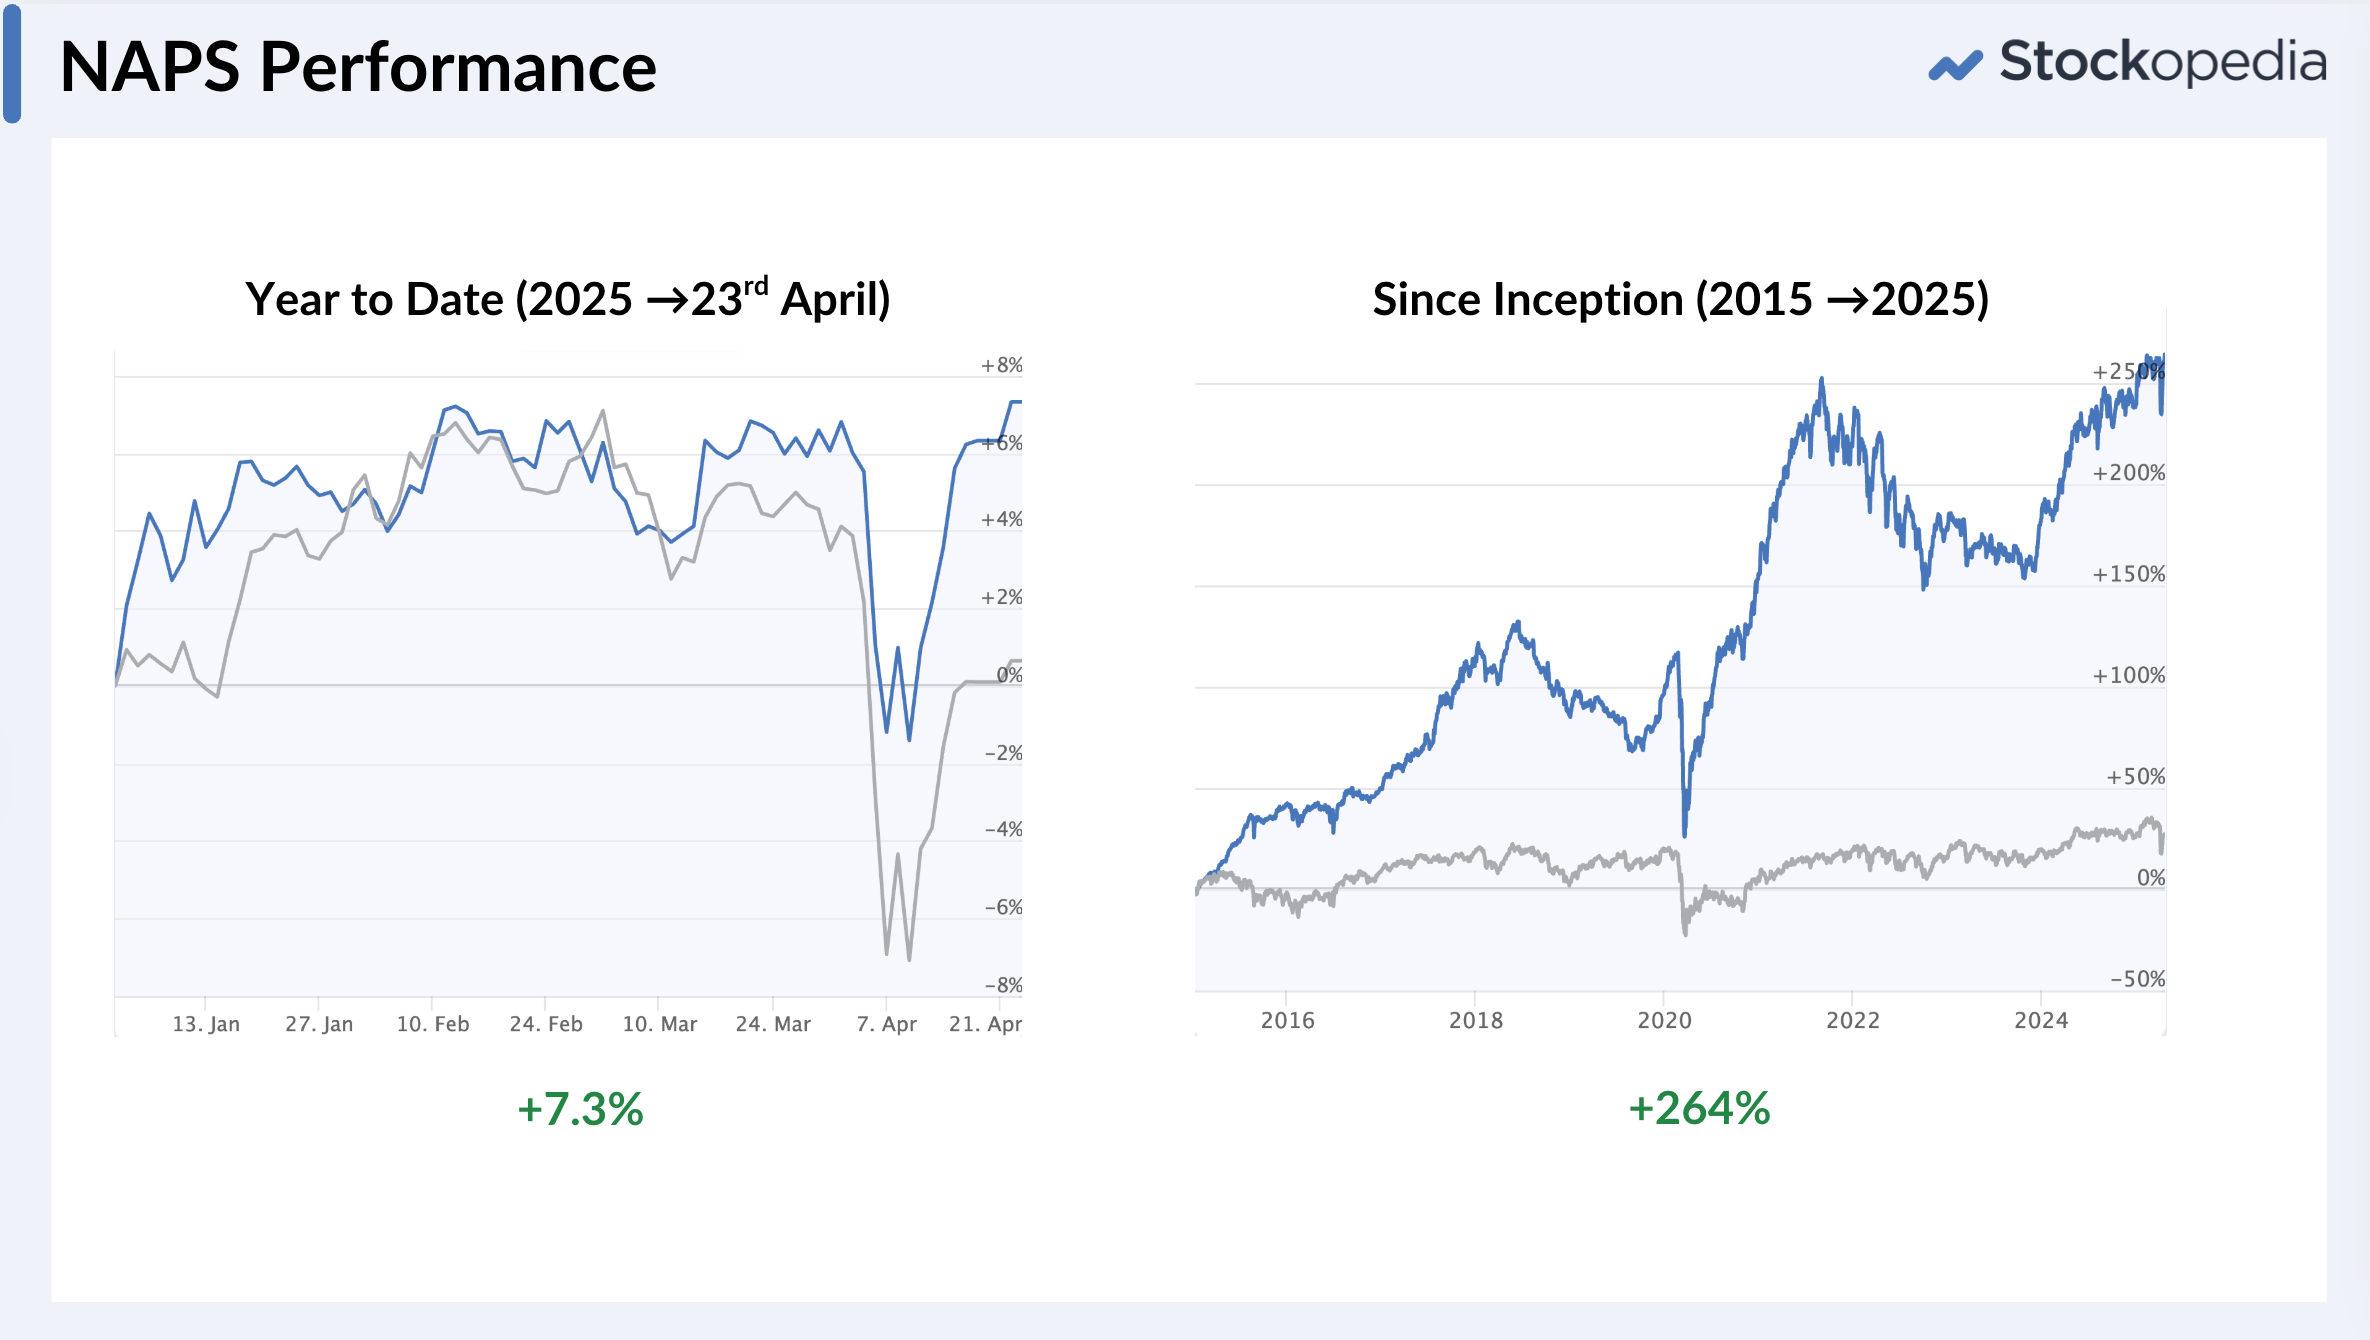
This is a good result in what’s been a very turbulent market period. The portfolios fell significantly during the Trump Tarriff Turbulence, but have rebounded quickly. In fact, in spite of all the negativity around markets at the moment, the new all time high makes me optimistic for the coming year.
Winners and Losers - some themes
I can’t stress enough how important diversification across sectors is to the performance of the portfolio. The chart below shows the biggest 7 winners and losers in the 20 stock portfolio. Two key winners themes stick out…
- Two junior gold miners have been the strongest winners year to date - Metals Exploration and Serabi Gold (+61% at the time of writing last night - though has tumbled 15% from there on a placing this morning). Gold is a great diversifier, and it’s a hedge in times of market turbulence with the gold price at a new all time high. There’s not too much research on junior gold miners in the UK, but they’ve been on a tear in the last 18 months. Altyngold just missed the cut but has outperformed both.
- Two big retailers make the winners list, which I’m sure is a surprise to many. Everyone has been so bearish on the retailers due to the National Insurance hikes, but Kingfisher and Currys are holding up well. Currys has released a string of “ahead of expectations” announcements, so it surprises me even more that Kingfisher has outperformed.
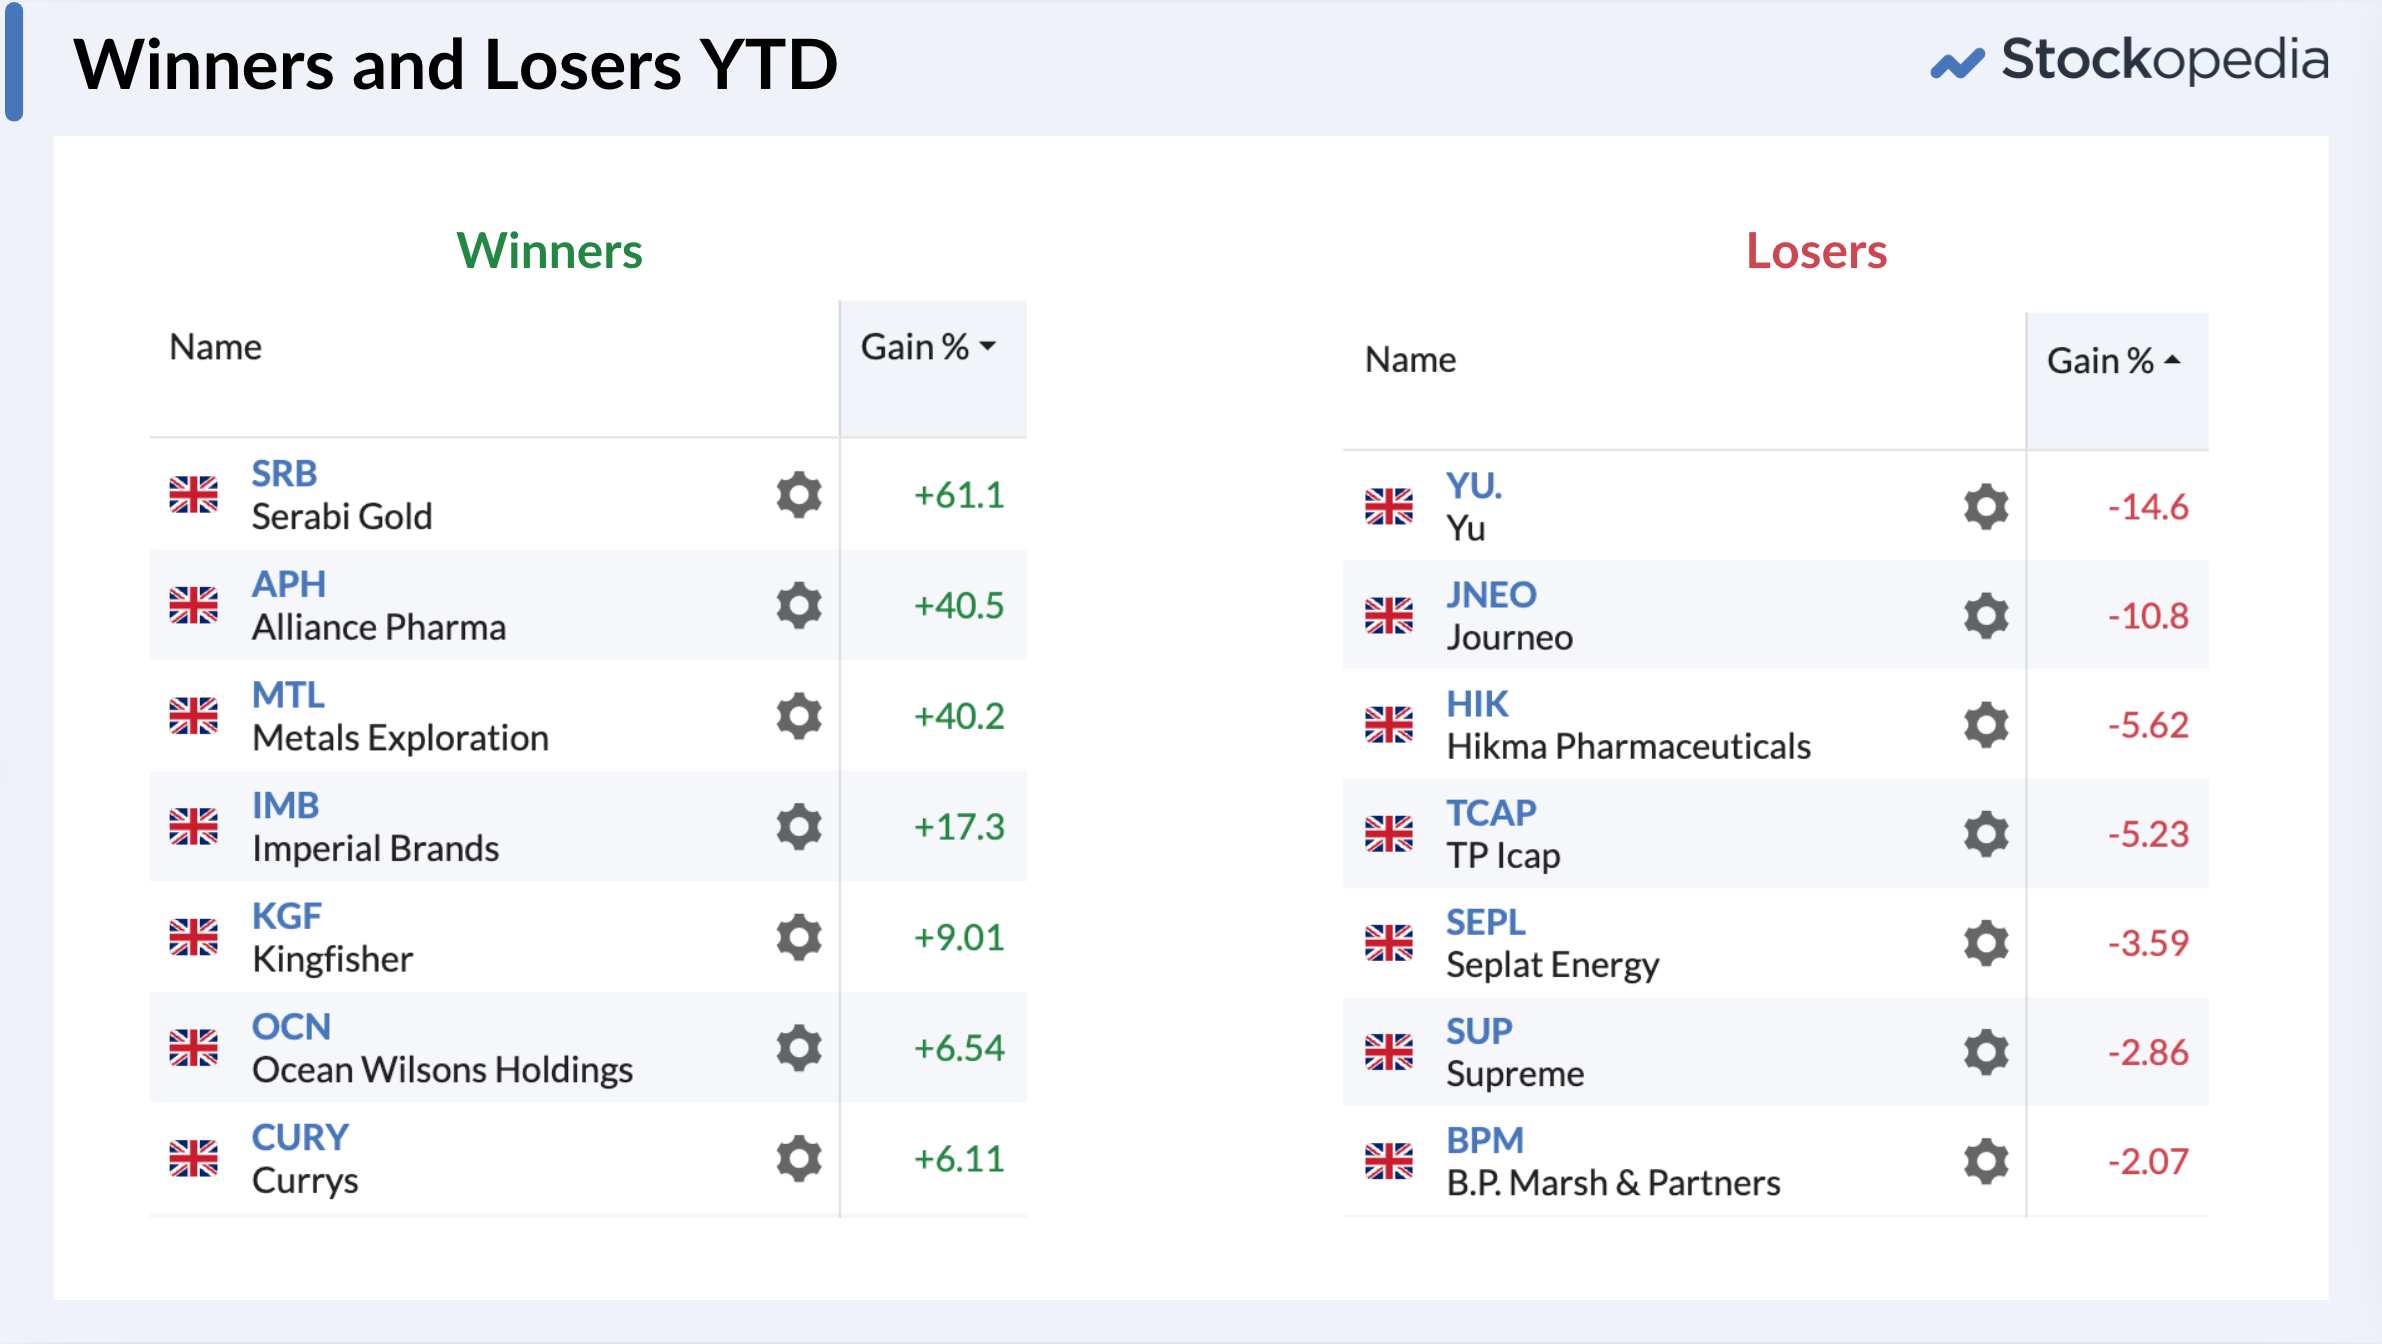
And there’s one major loser theme. Yu Group and Journeo are the worst two performers, but they are the two stocks I know the most about. We all suffer from confirmation bias, and when I saw the list at the start of the year I was quite pleased to see these two on the list.
It’s a strong reinforcement of a key principle I hold in investing - beware your own convictions. Only on rare occasions are the biggest winners in a portfolio the ones that I hold the most knowledge about. It’s often those that I know the least about that surprise me to the upside.
When I first bought Yu Group, in January 2023, I knew nothing more about it than it was one of the top Value and Momentum stocks on the site (by the VM Rank). My interest in it grew as I realised nobody was really talking about it, but it kept performing extraordinarily well (see this article). I finally had a good handle on the company by the start of this year after it had tripled for my family portfolio. It’s now the worst performer for the NAPS down 17% ytd! Ouch.
I’m still in profit on this position, but my point is this. I tend to get to know shares better when they start performing well. I take more interest. I seek more information. I confirm my biases. A narrative starts to form. I get more bullish. I get attached… and the predictable happens… I lose my discipline.
Keeping your discipline the NAPS way
I like to simplify effective stock market investing into easily understandable models. The key to long term outperformance is not to attempt extraordinary things, but to do ordinary things extraordinarily consistently. Having a mental model helps. There are three key principles to effective portfolio strategy, which are outlined in the diagram below.
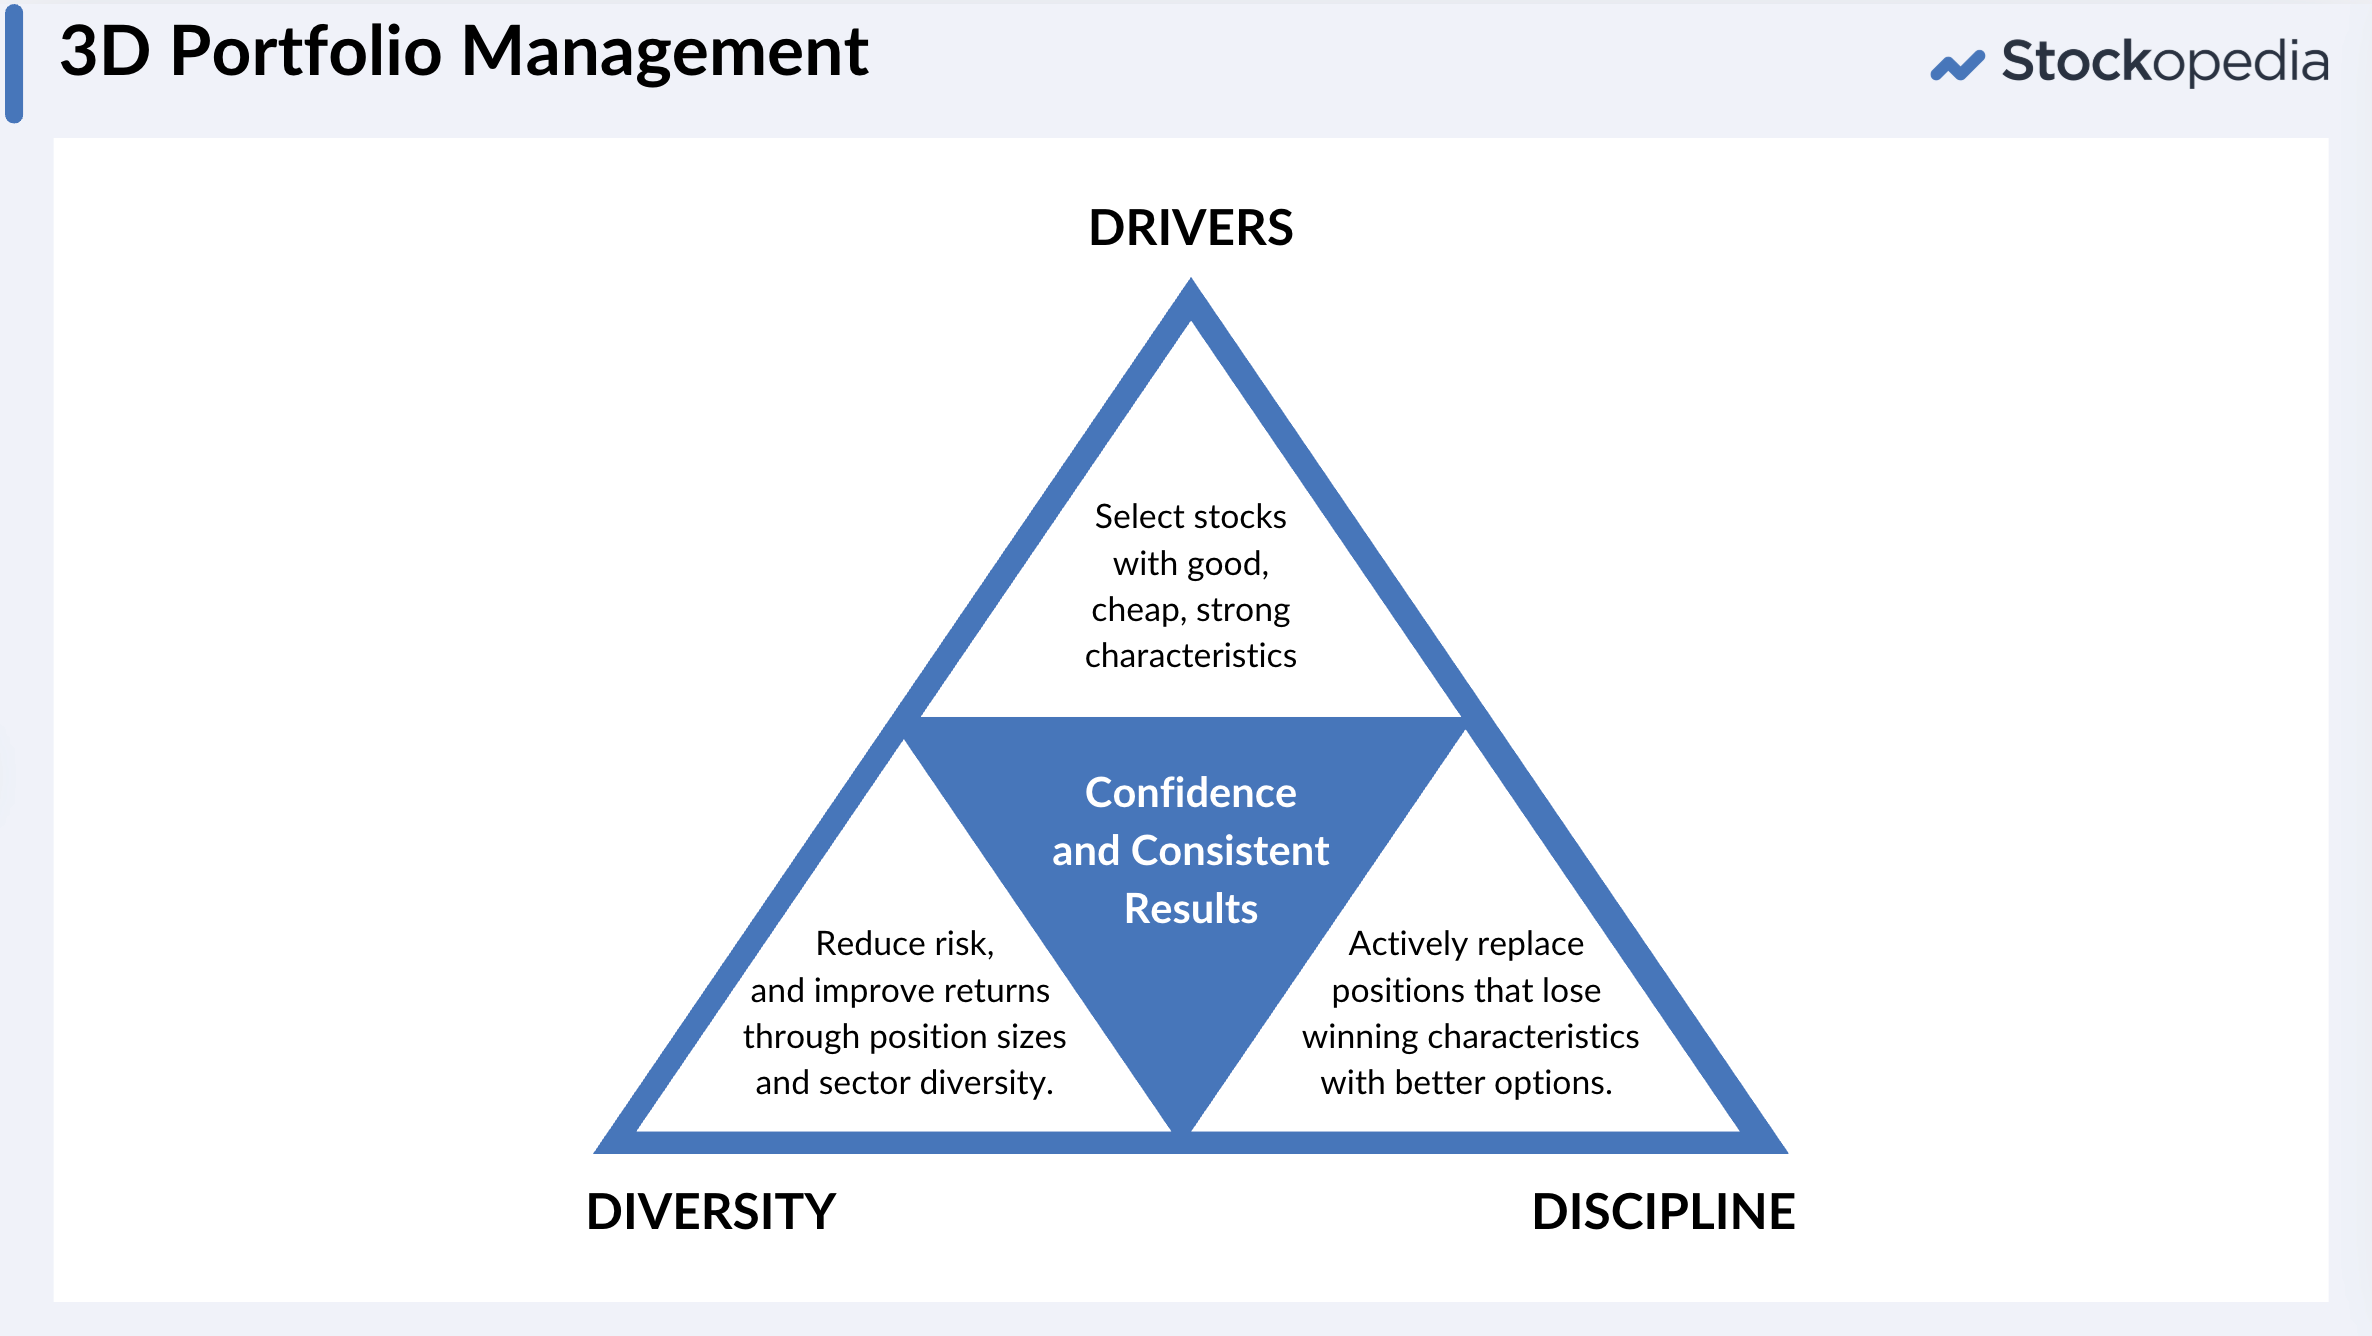
- Firstly, you need to ensure your portfolio is exposed to reliable return drivers. That means owning shares that have a reasonable likelihood of outperforming. The NAPS uses the StockRanks for this - to ensure all the stocks owned are good quality and/or reasonably undervalued and/or have strong momentum.
- Secondly, diversification is key. I’ve seen seriously good investors overweight positions to such an extent that they throw away a decade of outperformance in one bad year. And I’ve seen others load up on a single sector megatheme to amazing short term gains before a decade of regret. You have to hedge your own ignorance. We are not that smart. The NAPS holds 1-3 stocks across 10 sectors, equally weighted. It works.
- Thirdly, discipline. Over time, things change. A company has a profit warning, gets overvalued or runs out of trading momentum. Even Warren Buffett doesn’t buy and hold forever - think of his sales in Apple and Tesco. Buy, hold, sell, repeat is a better mantra. The NAPS uses a simple 1-year rebalancing cycle that works. It keeps rotating the portfolio back into high StockRank shares. Rinse and repeat.
There are all kinds of variations on the above 3D theme. The NAPS is one set of clear rules that implements the principles. It’s simple and it works, and it’s compounded at over 13% annualised over a decade. You may disagree with the NAPS’ implementation rules, but it’s hard to disagree with the 3D principles. What is important is to craft a set of rules that you believe in that align with the principles.
More to say
There is a lot more to say about the NAPS/QVM portfolios year to date. There have been many sets of results, but as yet no profit warnings. Yu Group got rather close to a key stop loss level at the extreme of the Trump tumble. But all in all, there have been no major issues in the portfolios that have required any changes. One of the keys to long term performance is doing rather little. As Jesse Livermore once said:
It never was my thinking that made the big money for me. It always was my sitting. Got that? My sitting tight!
So (in the QVM portfolio) we’re sitting tight. I’m anxious about the Trump dramas, anxious about the economy, anxious about Yu Group’s -14% YTD, anxious about everything really. Maybe just maybe this is a wall of worry, and the portfolios will keep climbing.
Disclaimer
This is not financial advice. Our content is intended to be used and must be used for information and education purposes only. Please read our disclaimer and terms and conditions to understand our obligations.

41 comments
I bought into NAPS early on but on a very small scale. I am a novice! Six months in, is it time to dump the "losers" and reinvest in the "winners", or do you recommend stick?
Very helpful.Through dumb luck I hold a lot of these! Nice to have a fellow traveller!
Well done Ed, but regarding Journeo (LON:JNEO) I would always defer to Peter Lynch's maxim, know what you own, as opposed to a more mechanical method of stock picking, although pehaps not as succesful in the short term.
Just my view.
Ed, you stated "Yu (LON:YU.) got rather close to a key stop loss level" what is this level please.
I run a 20% mental stop loss, so am now out of Serabi Gold (LON:SRB) but still made a profit and sleep well.
"Ed, you stated "Yu (LON:YU.) got rather close to a key stop loss level" what is this level please."
I'll be honest, I have yet to commit fully to a stop loss process for the QVM portfolio. Nonetheless, I'm keen to differentiate the QVM portfolio from the NAPS. Stop losses tend to work best when they are coupled to the natural volatility of a share. There's no point running a 10% flat stop loss process for a share that has a 1 year volatility of 60% - you will be stopped out far too often.
This is a rough guide based on the RiskRatings, but can be adjusted using actual 1y vol of each share (which is in the database). These levels are roughly around half the annual volatility. If one is excellent at timing entries they could be kept tighter (e.g. at low risk points, whether at breakout on earnings surprise in a growthy stock, or near a moving average on a natural correction point in a value stock).
In the case of Yu Group - it's a "Speculative" share - and it got to -24% not quite at -25%. There is an argument not to use stops in market crashes - as you can impair your returns on any rebound... but rules are rules.
Apologies I was looking at the wrong screen! I originally put up the correct NAPS from Jan but calculating the AS as of today not from Jan, so it is incorrect. The snapshot I fortunately kept is from Jan 3rd and is just in +ve territory. I've kept in NEXN even those it's moved to a US listing. The idea tho is to swap stocks in and out when they go below the 100MA and replace them with the best stocks from the current NAPS screen. Unfortunately I cant back test this as there is no historical screening on Stocko.
The below is today's NAPS results sorted on best AS from each sector. Can only get 17 results even tho expanding the NAPS criteria for most sectors to 3 stocks each but keeping Utils and Telecoms to 1.AS is > 20. I eliminated at least 3 Reits can you believe as they are takeover candidates but showed high AS (it works!)
Thanks for this. This fits in with what I`ve found. I still think your idea is a great one, just that you need a filter to ensure you trade it in bull markets , not when the market is in a bear market or has a liquidity crunch like a couple of weeks ago and sells everything, even the good stocks on margin calls.
Yes I'd be using a market regime, still doesn't get you out if there's a black Swan event tho
I presume there is also a case for looking at a regression trend and buying in the discount zone (bottom half of the trend)
I havent fully tested this, but tried looking at a couple of shares at the bottom of a strong regression trend in February, these being Carnival and International Consolidated Airlines and both of these failed spectacularly. For example here is IAG at the bottom of a strong rising regression trend late February.
And this is what happened afterwards
These are only a couple of shares, and most bullish theories have failed since February, so think its a perfect valid trade, as long as you place a low close to the bottom of the recent price action, as you dont want to be in a momentum share going ex-momentum.
I also notice that you suggested buying below the half way point (I looked at close to the bottom regression confidence line), which I havent tested, so the trend maybe slightly stronger here, but would you need a wider stop loss if price goes to the bottom regression line, which if its 2 standard deviations away could happen 95% of the time, unless I`ve got my mathematics wrong.
On the positive side, however you have shares like XPS Pensions, which have come back to the lower regression line four times in the last two years, each time a profitable trade.
Ive shown weekly candles here but you could have got a better entry on daily candles. So sure its possible to do this, just need to test what would be a good risk reward scenario for such a trade
I must confess I bought somewhat blindly into the apps when I first joined but found very quickly that timing was everything. Quite often I’ve found that the targeted shares in the official naps have gone up a lot by the time I get to them or don’t look quite as good value as they once did. I’m more picky about my timing now. My naps criteria selection is running at 10.9% right now. That’s after taking the hits with Yu which I got out of. I’ve now supplemented it with some higher dividend stocks as I feel that things are moving sideways for a bit now and having some actual cash coming in which doesn’t force me to sell shares to realise profits for reinvestment is an advantage.
I have tracked what I considered the top 20 UK shares by annualised slope on 6th January 2025, and its delivered a return of -7% since that date. I admit I havent picked these based on sectors, but I would be very surprised if this methodology had delivered 25% since the start of the year. As Clenow says in his book, this strategy is only for when the respective index is above the 200 day moving average. Momentum investing does not tend to work in bear markets. This was sorted by 89 days annualised slope, whilst Clenow used 90 days. I used 89 days as David Paul reckons this is a magic fibonacci number.
What is AN slope and how to you screen for it Dog? Cheers
ANN Slope is annualised slope. You can get this figure in Sharescope for any period length under the Technical Analysis criteria in the Trend Line section. You can also get the annualised slope figure for past dates as well (ie the start of the year) However you cant get R-squared figure in Sharescope. However you can get this figure (and annualised slope) by using Trading View graphs, using one of the indicators Paul mentioned. But I havent found r-Squared that useful, I`d rather just look at a graph and see if the price is moving smoothly from bottom left to top right. The highest annualised slope shares tend to be the ones with the highest r-squared figures, and looking at a graph can filter the ones out which have been subject to takeover offers, or just move in a very volatile manner from A to B.
Ok thanks graph bottom left to top right I can recognise!!
How the axes are configured though can make ordinary seem very good and vice versa....
cheers
NAPS continuing to smash it and beat all other portfolios. Frustrating but humbling not to be able to beat it!!!
Ed, if one was starting a portfolio following these NAPS at this stage of the year would you simply invest in each of them with equal weight or do some rebalancing now?
This can be done at any time of the year. I would start afresh, ie do a new selection today, not based on a previous selection and equal weight.
@raigersfield. Personally, if I was starting a new portfolio now, I'd want to own the stocks that have the ideal characteristics now, rather than those that had the idea characterstics on January 1st. So I'd run the process as of today.
It does raise the question of "what's the best time of year to start a NAPS portfolio" which is a question I don't have an answer for to be completely honest. I have a feeling that early January is quite a good time, as it's before the January trading statement season. But I don't have any hard data on this.
I have been running virtual NAPs portfolios since Dec 2024. Choosing the appropriate selection in the first week of each month.
As of today the portfolios are running roughly as follows:
Dec -2%
Jan +6.5%
Feb -2%
March +2.5%
April (so far) +0.4%
January does seem to have been an excellent month to have started a NAPs portfolio this year.
Absolutely. I’m now looking at the naps for nightly to give me ideas on what else to buy into should I sell out of anything.
Thanks very much for your Naps article Ed. A very reassuring read to somebody like myself just started with Stockopedia and already enjoying the many articles and huge amount of data available. Having adopted the Naps screen after some initial mistakes, I have been encouraged to see how quickly it has rebounded from the dip caused by the orange moron's ideas on tariffs. I am happy to sit tight through periods of volatility although I wonder how long falling confidence in the US dollar will keep the values of SRB and MTL so high.
His latest excursion into cryptocurrency may well send gold miners higher still yet? Like you I discovered Yu and Journeo some time ago and have followed their ever expanding order book and growth, leaving me surprised to see their lack of growth, but no less confident in their security especially as wide swings in value are typical for Yu during annual periods.
My main surprise has been how well consumer defensive stocks and Curry's and Kingfisher are performing two, I would never have thought of without my subscription to your services.
Paul, thanks for sharing your interesting approach yielding good results. How do you calculate your adjusted slope?
In google sheets
Excellent review, insightful. Thank you Ed.
Thanks Ed. Reviewing the NAPS portfolio I setup using your rules but selecting based on the best trend using adjusted slope, has returned 25% since January. Maybe a blended approach is worth considering. Only Gulf Keystone Petroleum (LON:GKP) has lost money
Paul - yes there's definitely more performance possible with other approaches! Great that the trend adjusted slope is adding so much value
If you could explain a little more about the adjusted slope concept that would be very useful. Thank you.
AS adjusts the coefficient of determination (R squared) to account for volatility in a share price. The closer to 1 R squared is the better the trend (1 is perfect) the sp almost moves in a straight line. e.g. R^2 for Verona Pharma (NMQ:VRNA) is 0.93 and the sp moves at almost 45 degree angle until recently. The idea relates to the tendency for trending stocks to continue trending (Serabi Gold (LON:SRB) and Rolls-Royce Holdings (LON:RR.) are recent examples) You want to be in these stocks if youre into momentum investing. Ed wrote an article on it
Thank you.
Paul kindly shared how to put this together in Google Sheets in a comment on this thread:
https://www.stockopedia.com/co...
How did Warehouse REIT get in this portfolio. It was going nowhere on 3rd January 2025- cant believe its annualised slope was greater than banks like HSBC, Barclays, Nat West. Also wouldnt shares like IAG and Carnival have been in this portfolio in January
Just trying to understand the range of stocks you evaluate in a given sector Paul. NAPS simply chooses the 2 stocks with highest stock rank in each sector. If you’re using r squared are you evaluating ever stock or choosing the top 10 based on stock rank and then applying r2 ??. One other question if I may…. What period of data are you using for your r2 formula?
Apply the NAPS rules (but to get 20 stocks you may have to choose 3 from each sector as some stocks in an individual sector may have no momentum) then select based on highest AS as per Clenow but AS has to be >20 (or higher if you want). It's only an idea tho, I cant back test as I've no access to historical data from Stockos database so cant get what NAPS would be at any point in time
Hi Paul can you show us how to do this currently, then we can see how it pans out prospectively. Did you publish it here before? Very interesting! Cheers.
Remind me what the sell rules are for the NAPS besides a takeover
What sell rules? AFAIK, there are no sell rules, they are held for 12 months.
I thought the sell advice was if the stock rank dropped to was it 72 or 76 (can’t remember which but it’s somewhere on stockopedia consider selling the share).
Thanks Ed - and some good tips here. Intrigued by your experience with YU and the fact that it has slipped so much this year - albeit making a comeback as far as I can see. You might be interested to compare YU with Pozitive Energy which as far as I can see is a very similar business - but not quoted so need to lookup the accounts at Companies House. They look to me like a licence to print money - twice the size and much bigger profit margin. Not regulated like the companies supplying domestic so no price caps and they can tie in their customers for the length of the contract - No £50 exit fees.
One to print out and keep. Thanks, Ed.
Excellent, as ever. Thanks a lot Ed.
Perhaps the under-performers are providing an opportunity. E.g. if memory serves, PAY just missed the cut for the NAPS. Today, it's had a favourable review in the DSMR and you can buy it about 17% cheaper than at New Year.