New Year Naps - Top Stocks for 2024 and a few random samples

It’s been a topsy turvy year in the UK stock markets. A bull trap rally into February heralded a slow grind down towards new lows in late October. It seemed like yet another year of declining UK stock markets was on the cards, but Santa’s Rally brought some cheer with a rapid recovery from the lows. Most UK indices posted gains for the year: FTSE All Share +3.8%, FTSE 100 +3.8%, FTSE 250 +4.4% (as of 28th December). It’s been more of a struggle in the FTSE AIM All Share , which was down 8.2%. FTSE indices are market cap weighted, which isn’t reflective of most private investor portfolios, so I prefer to benchmark against the equally-weighted, annually-rebalanced 90+ StockRanks, which are up 4.4%.
Naps Portfolio Performance
It’s within this muted backdrop that I compare the performance of the 2023 NAPS Portfolio. This is the “No Admin Portfolio System” that I’ve now been running here for 9 years.
It’s a simple, systematic investment strategy that takes no more than an hour to administer each year. There’s no stock picking, no reading of the runes and no emotional hemming and hawing.
It’s based on the principle that good, cheap, strong shares tend to beat the market - on average over the long run. So if you buy a diversified portfolio of these kinds of shares, you should do fine.
In essence, the algorithm is: Buy the 20 highest StockRank shares, diversified across ten sectors. Once per year, rinse and repeat. I’ve fiddled with the rules a bit over the years, probably to little gain, but the long term performance has been quite satisfactory with a 182% gain over 9 years.

The above charts do exclude dividends and transaction costs. Including dividends for the FTSE All Share gives the total return a boost to 60% over the last decade. Still a wide margin away with the NAPS having typically yielded dividends of over 3% annually.
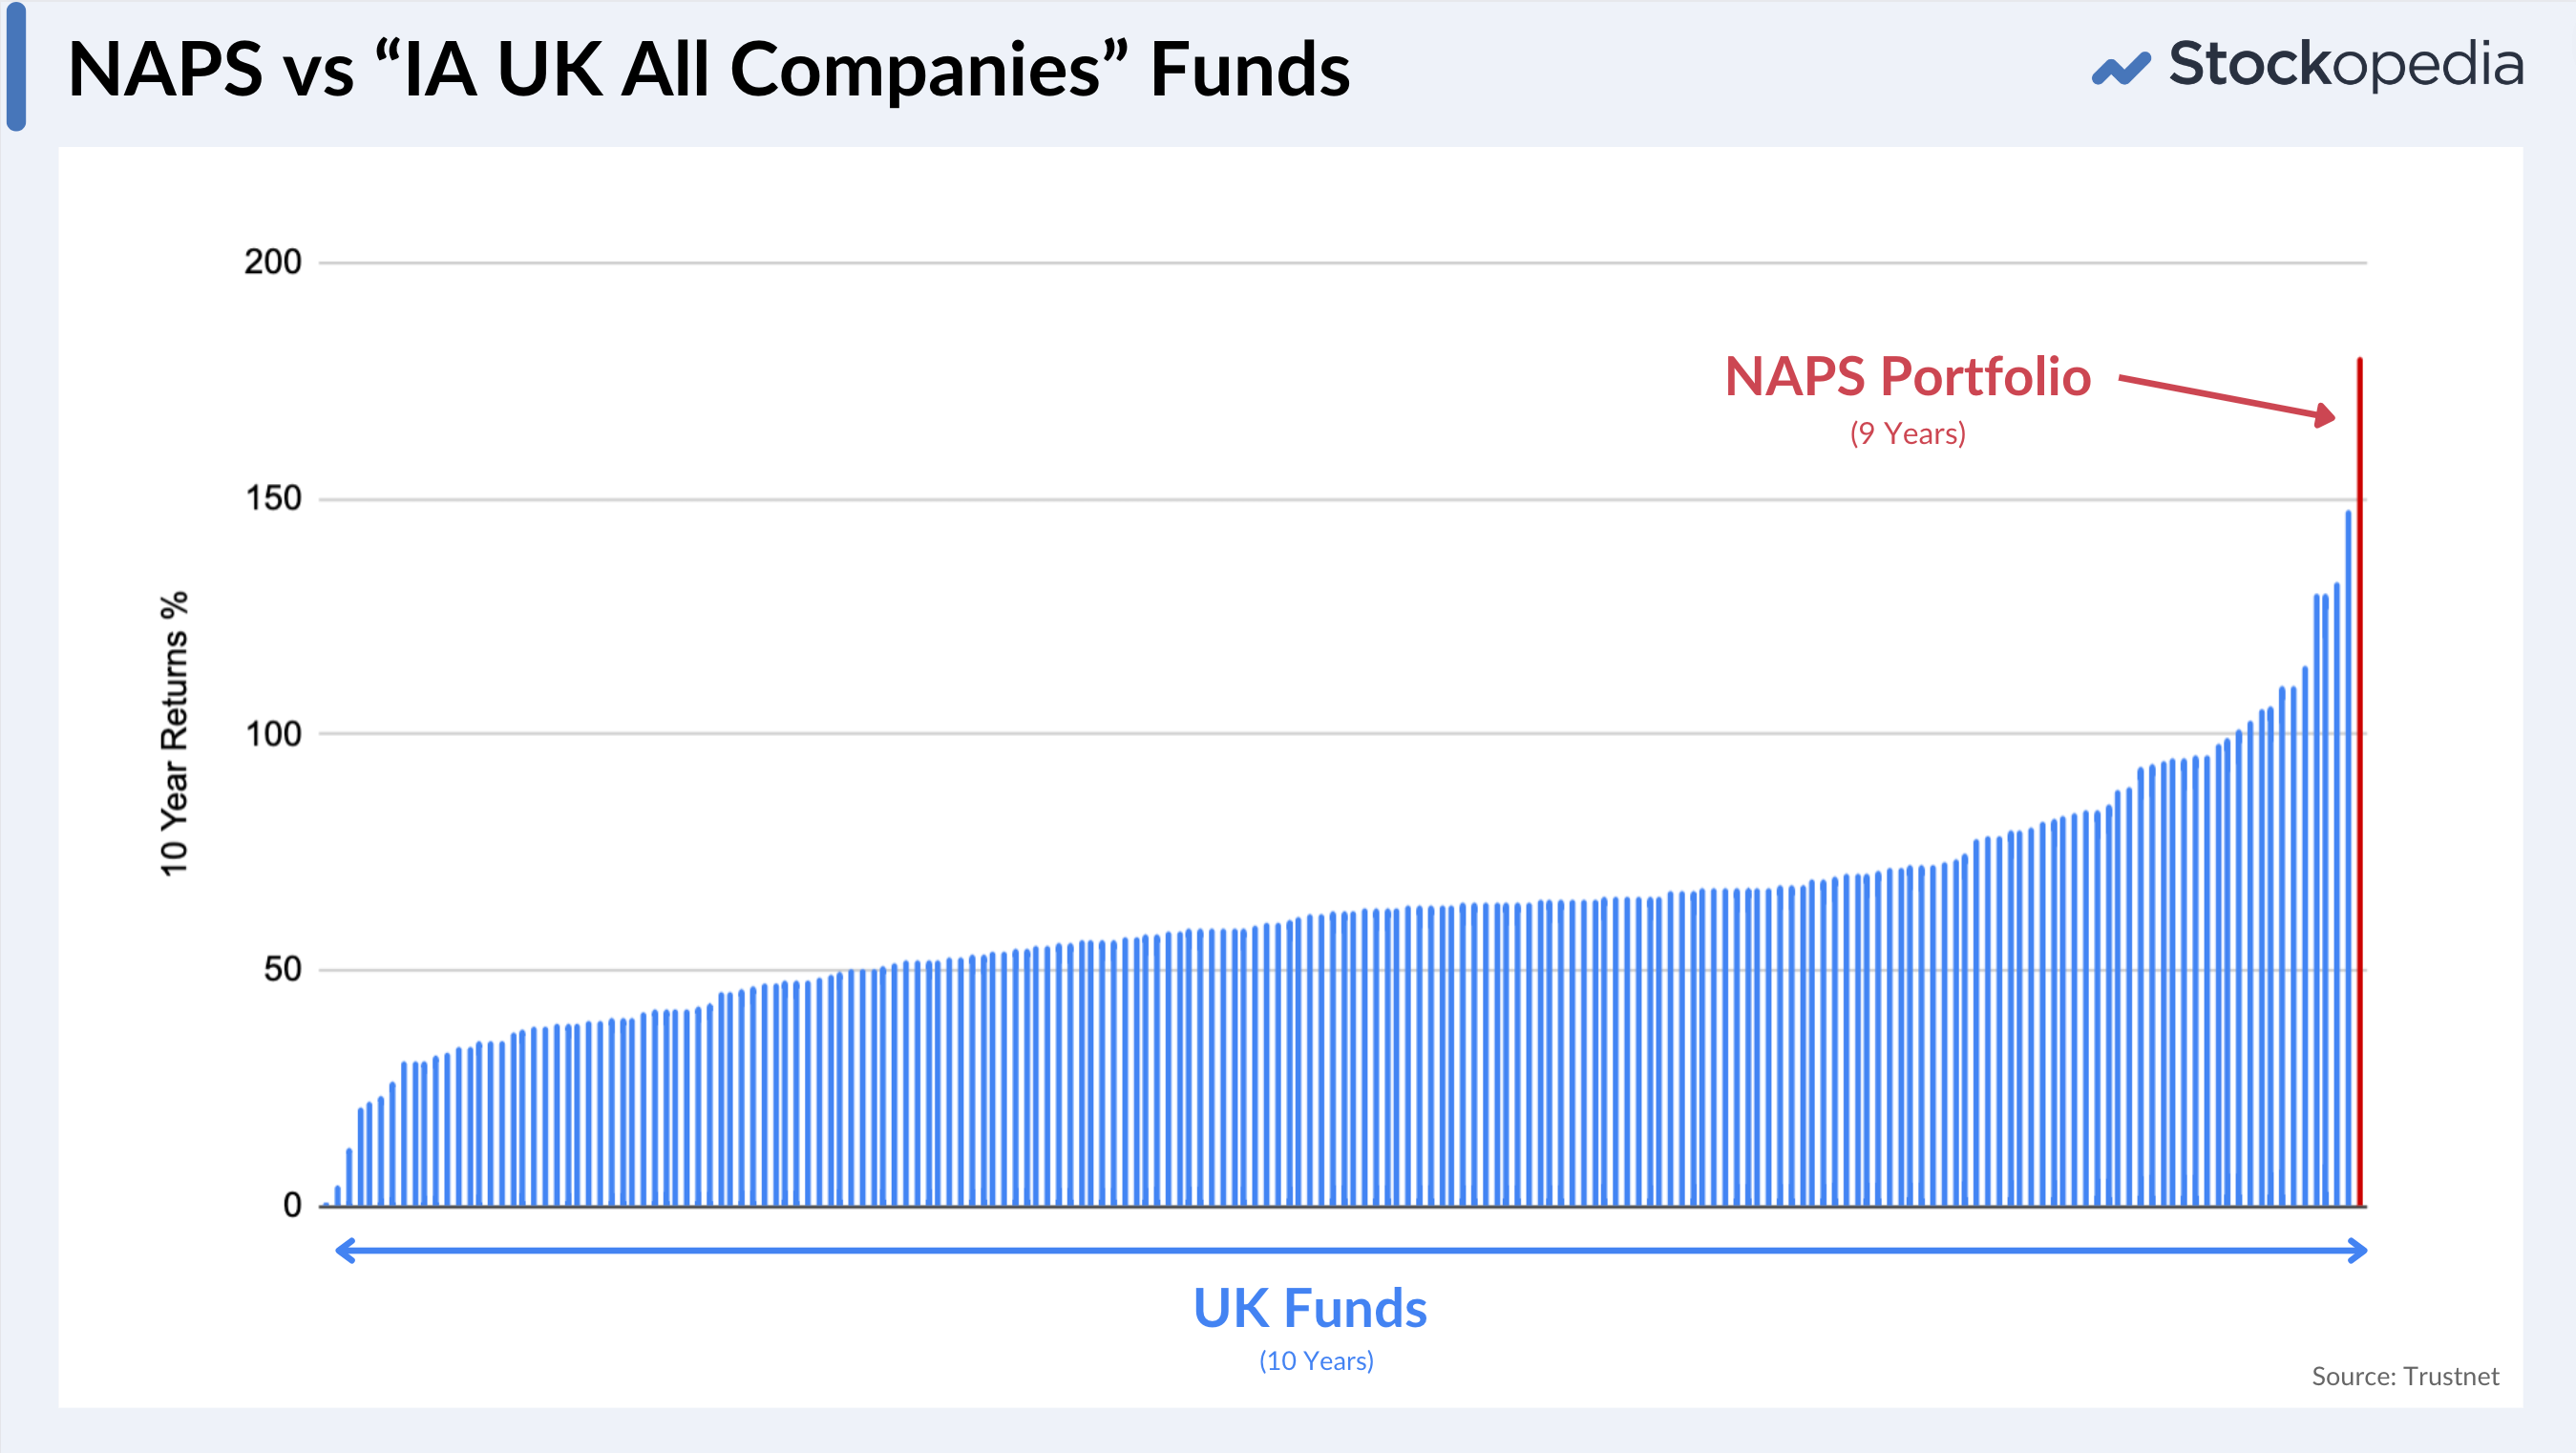
Nonetheless a fairer comparison may be versus Actively Managed Equity funds in the UK, as if you can’t beat fund managers, there’s little point running your own money. While the NAPS only has 9 years history, it’s beaten the performance of all 187 funds in Trustnet’s “UK All Companies Sector” fund database over 10 years. Over the last 5 years, it's in 15th place. If there’s ever an advertisement for the benefits of DIY investing there it is. Our annual survey of subscriber performance suggests that so many of you do far better than this - congratulations.
Nonetheless, 2023 has been a pretty mediocre showing for the NAPS, recovering from a 9% loss in late October to a 1.9% return by year end. Over the last 2 years, the portfolio is down 13% and has underperformed the FTSE All Share. This has bothered me.
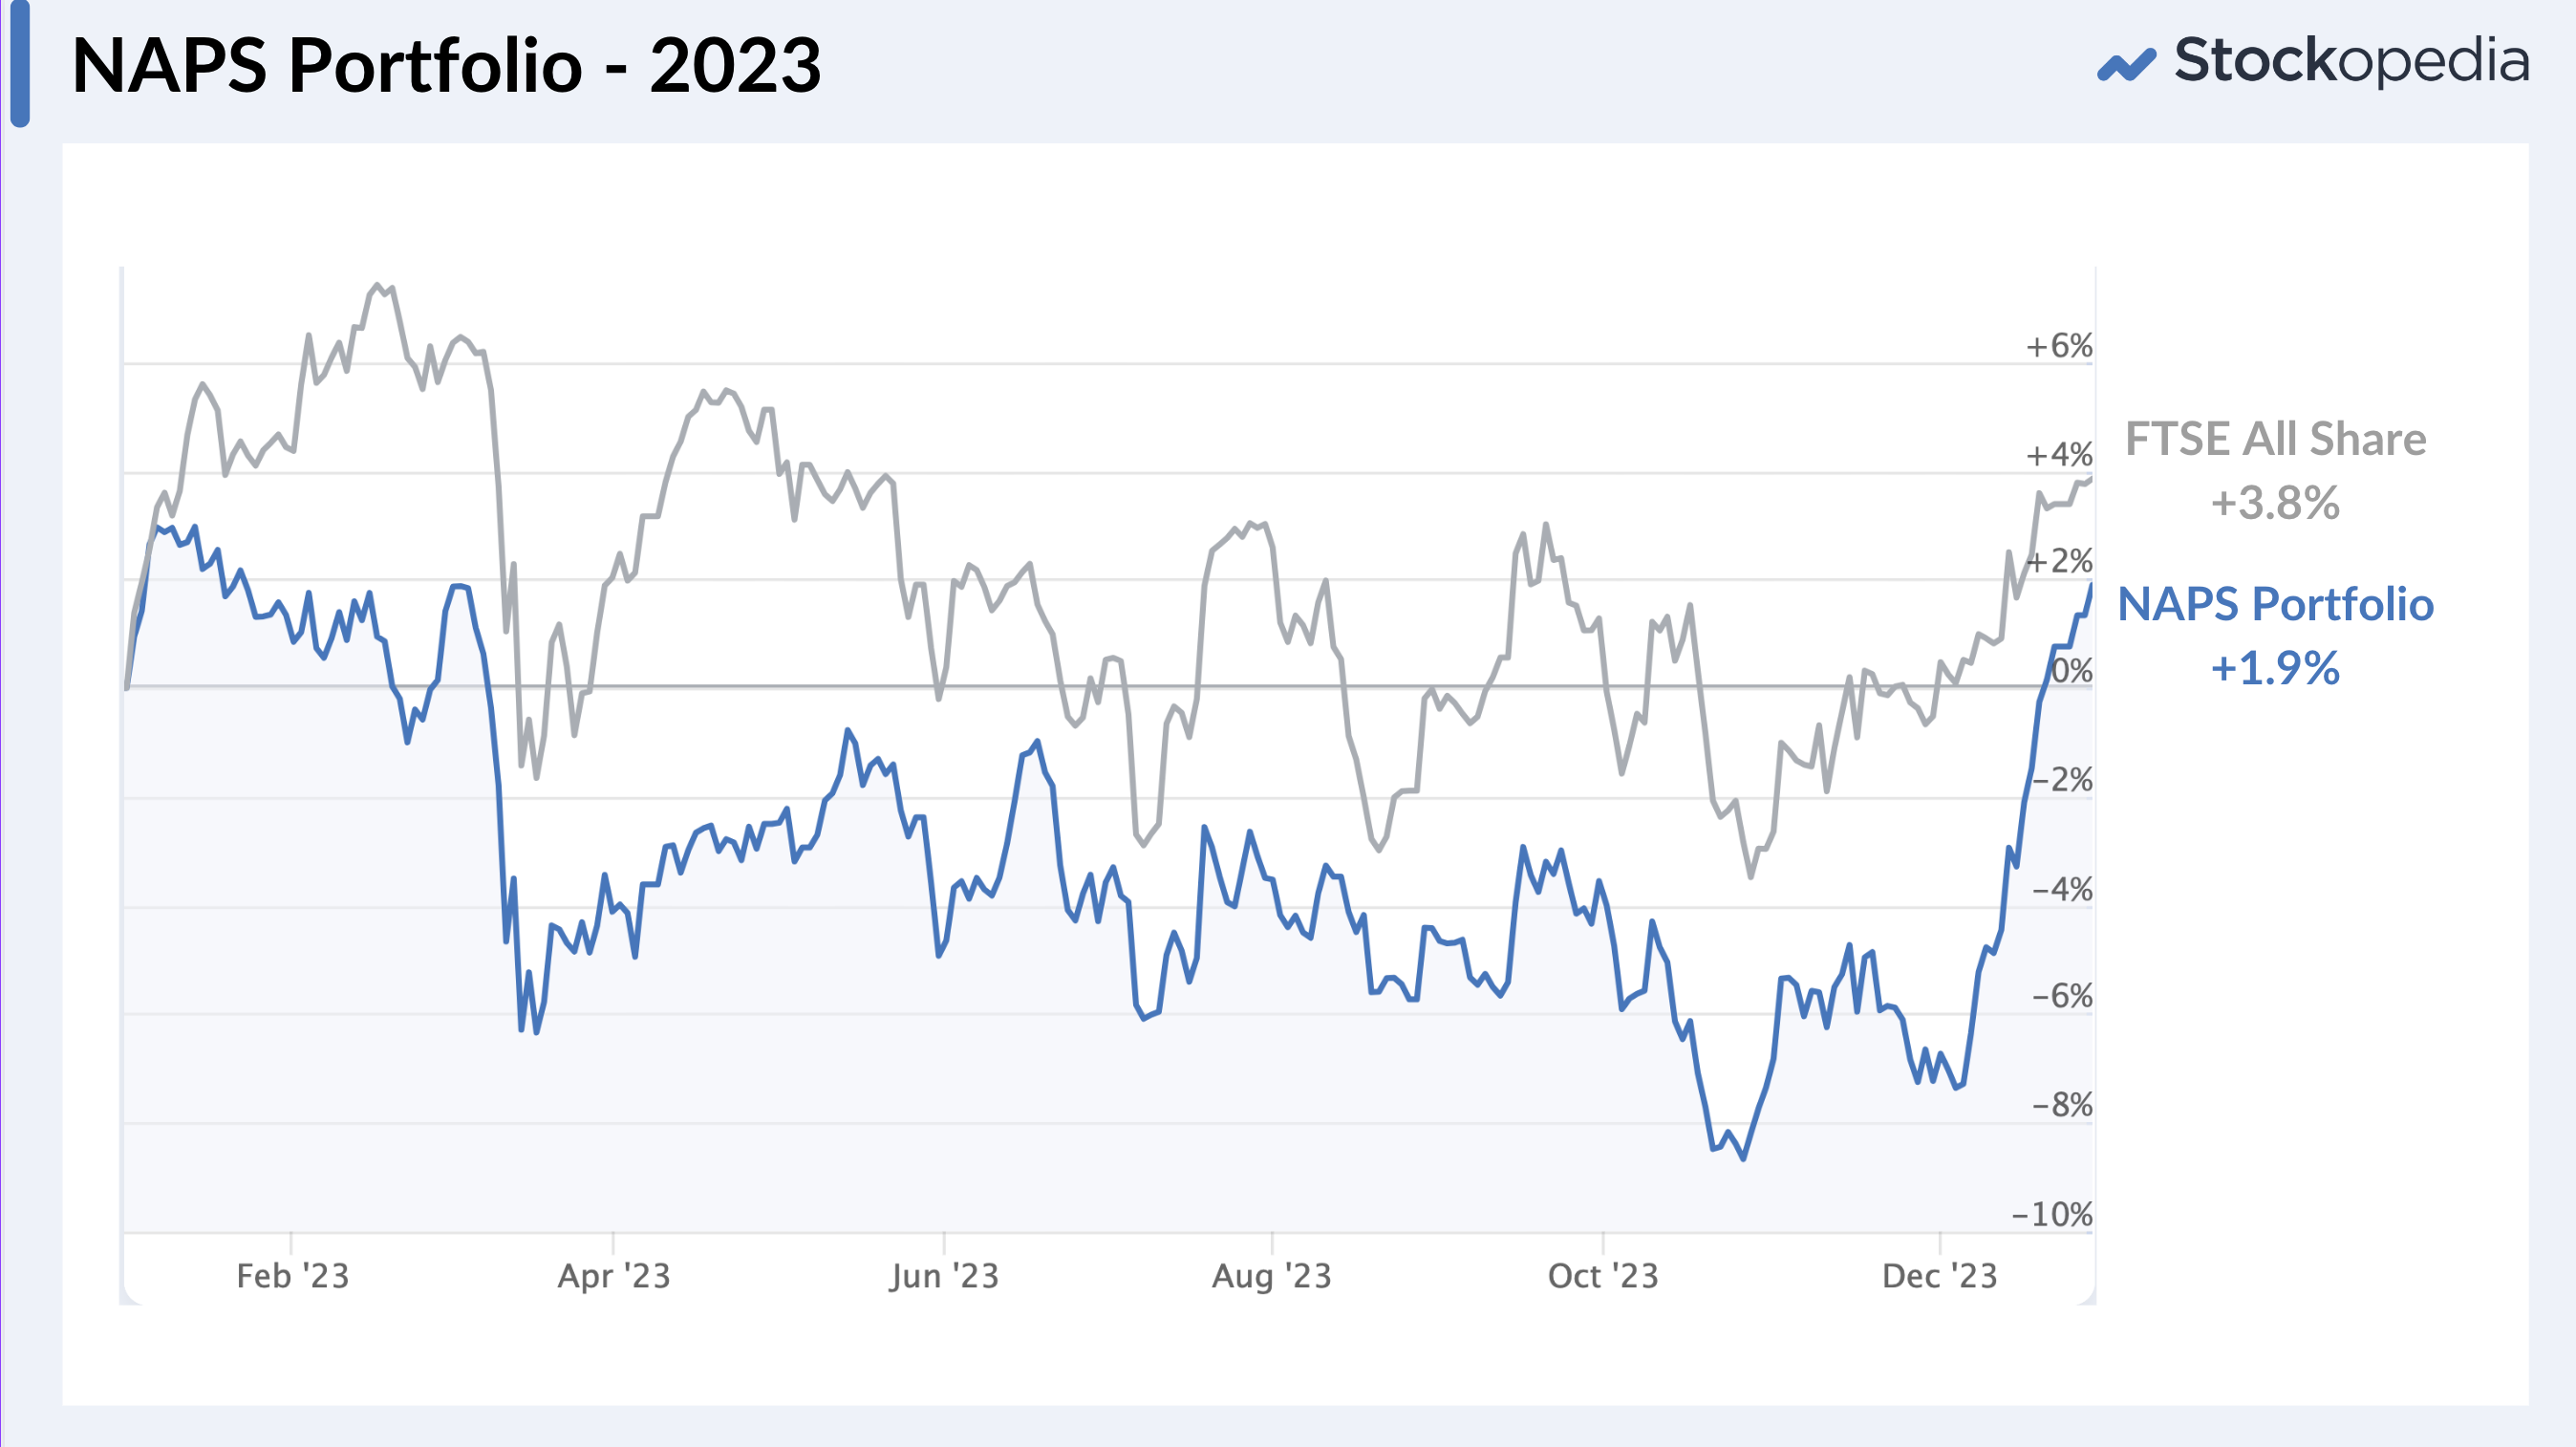
There’s not much you can do about the markets, but long periods of underperformance lead to mental anguish. The risk is that you throw in the towel on a proven approach, and go return chasing elsewhere. Never a wise move. So why have the NAPS underperformed of late?
It’s not exactly been a stellar set in 2023. Warpaint London (LON:W7L) has been a two-bagger, but there have been only 9 winners against 11 losers.
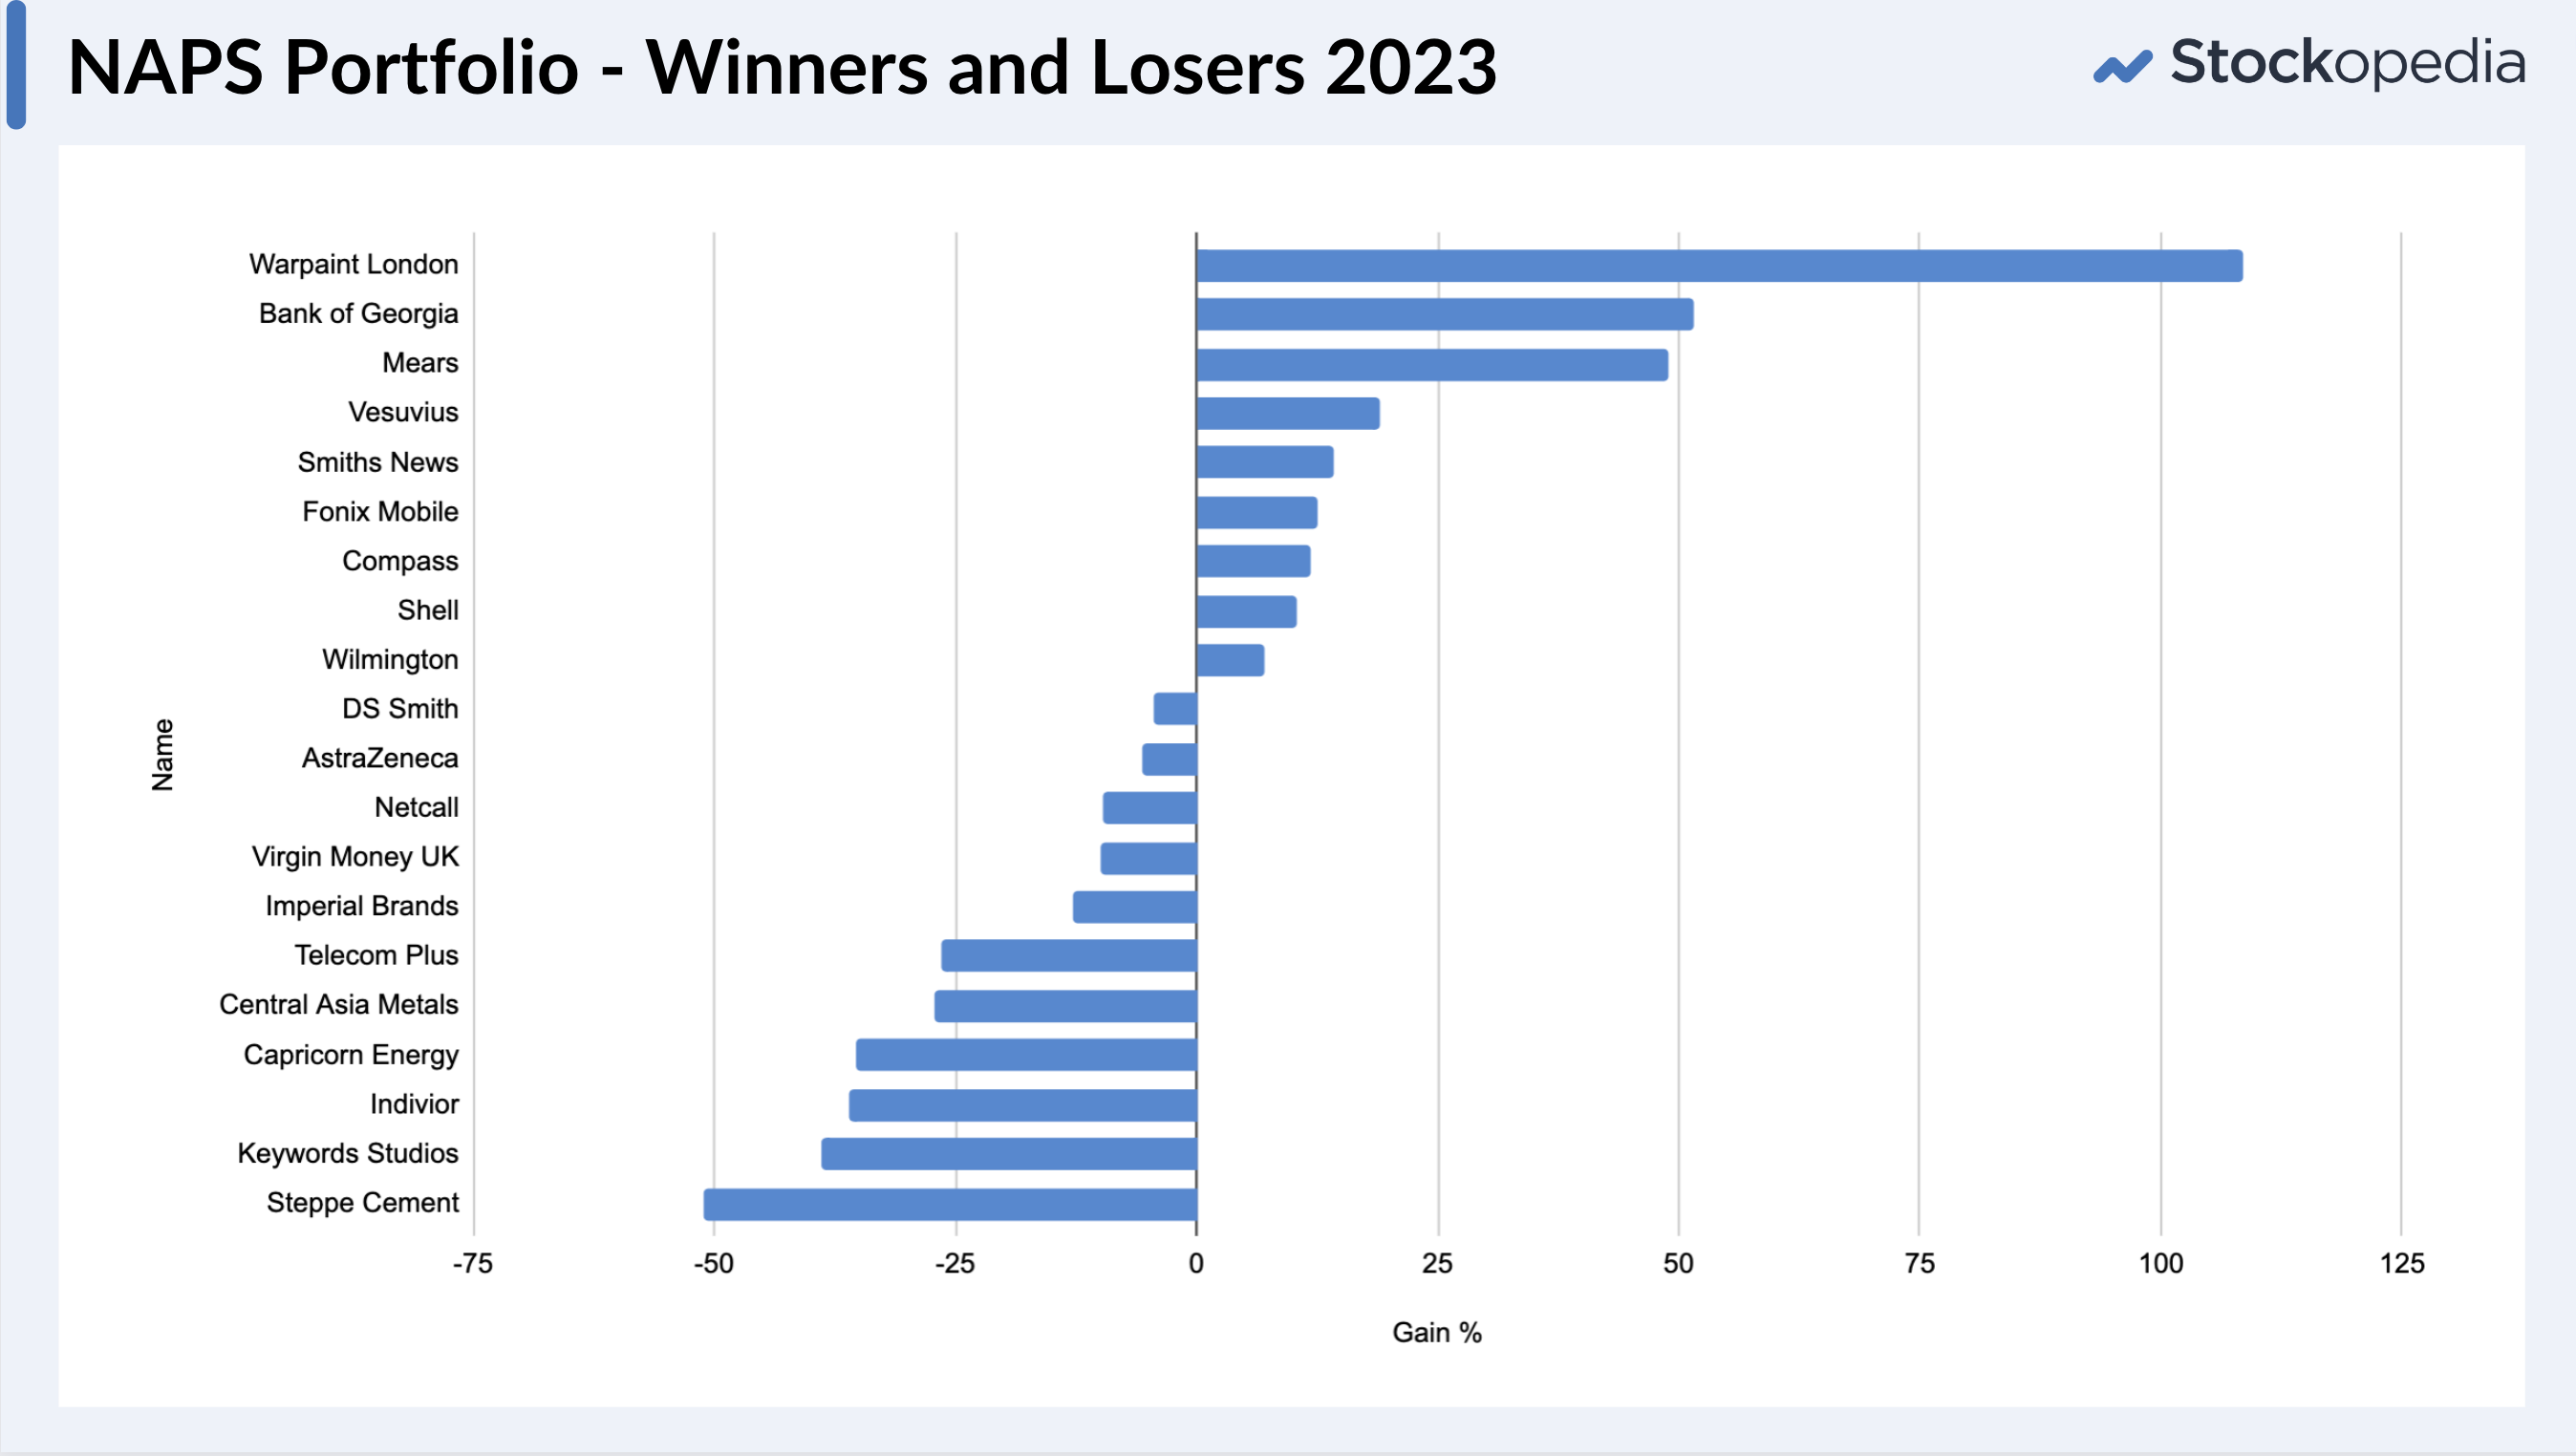
There are a fair number of nasties in the set. Steppe Cement (LON:STCM) down more than 50%, Keywords Studios (LON:KWS) suffering, while utilities, healthcare and telecoms, usually sources of defensive spine, were weak.
What’s most annoying is that the final day ranking shuffle on the 31st December last year swapped out Yu (LON:YU.) for Telecom Plus (LON:TEP) , an unfortunate late replacement that swapped a 145% potential winner for a 27% loser. Just that one wiggle in the ranking system left an additional 9% of gains on the table for the year.
That’s chance, but I do feel rather robbed.
Just how random are the returns of NAPS Portfolios?
The 9% Yu Group vs Telecom Plus portfolio swing just goes to show how variable StockRank portfolio outcomes can be. But just how variable?
There are 121 stocks in the 90+ ranking set in the UK at the moment, excluding tiddlers below a £10m market cap and the smattering of investment trusts. It’s unrealistic (and very expensive) to own all of them. Anyone using the ranks to build a portfolio, whether via discretionary stock picking or systematic approaches, invariably ends up owning a sample.
The NAPS owns 20 high-ranked stocks, which is a manageable amount of positions to run. But owning just 20 ensures the eventual performance outcome will differ considerably from the overall 90+ StockRanks.
To satisfy my own curiosity, without hopefully starving my cat, I built a little random portfolio builder to check out the distribution of NAPS-esque portfolio returns.
Here are the performance histories of 100 randomly selected high ranked NAPS-esque Portfolios, each diversified across 10 sectors in 2023.
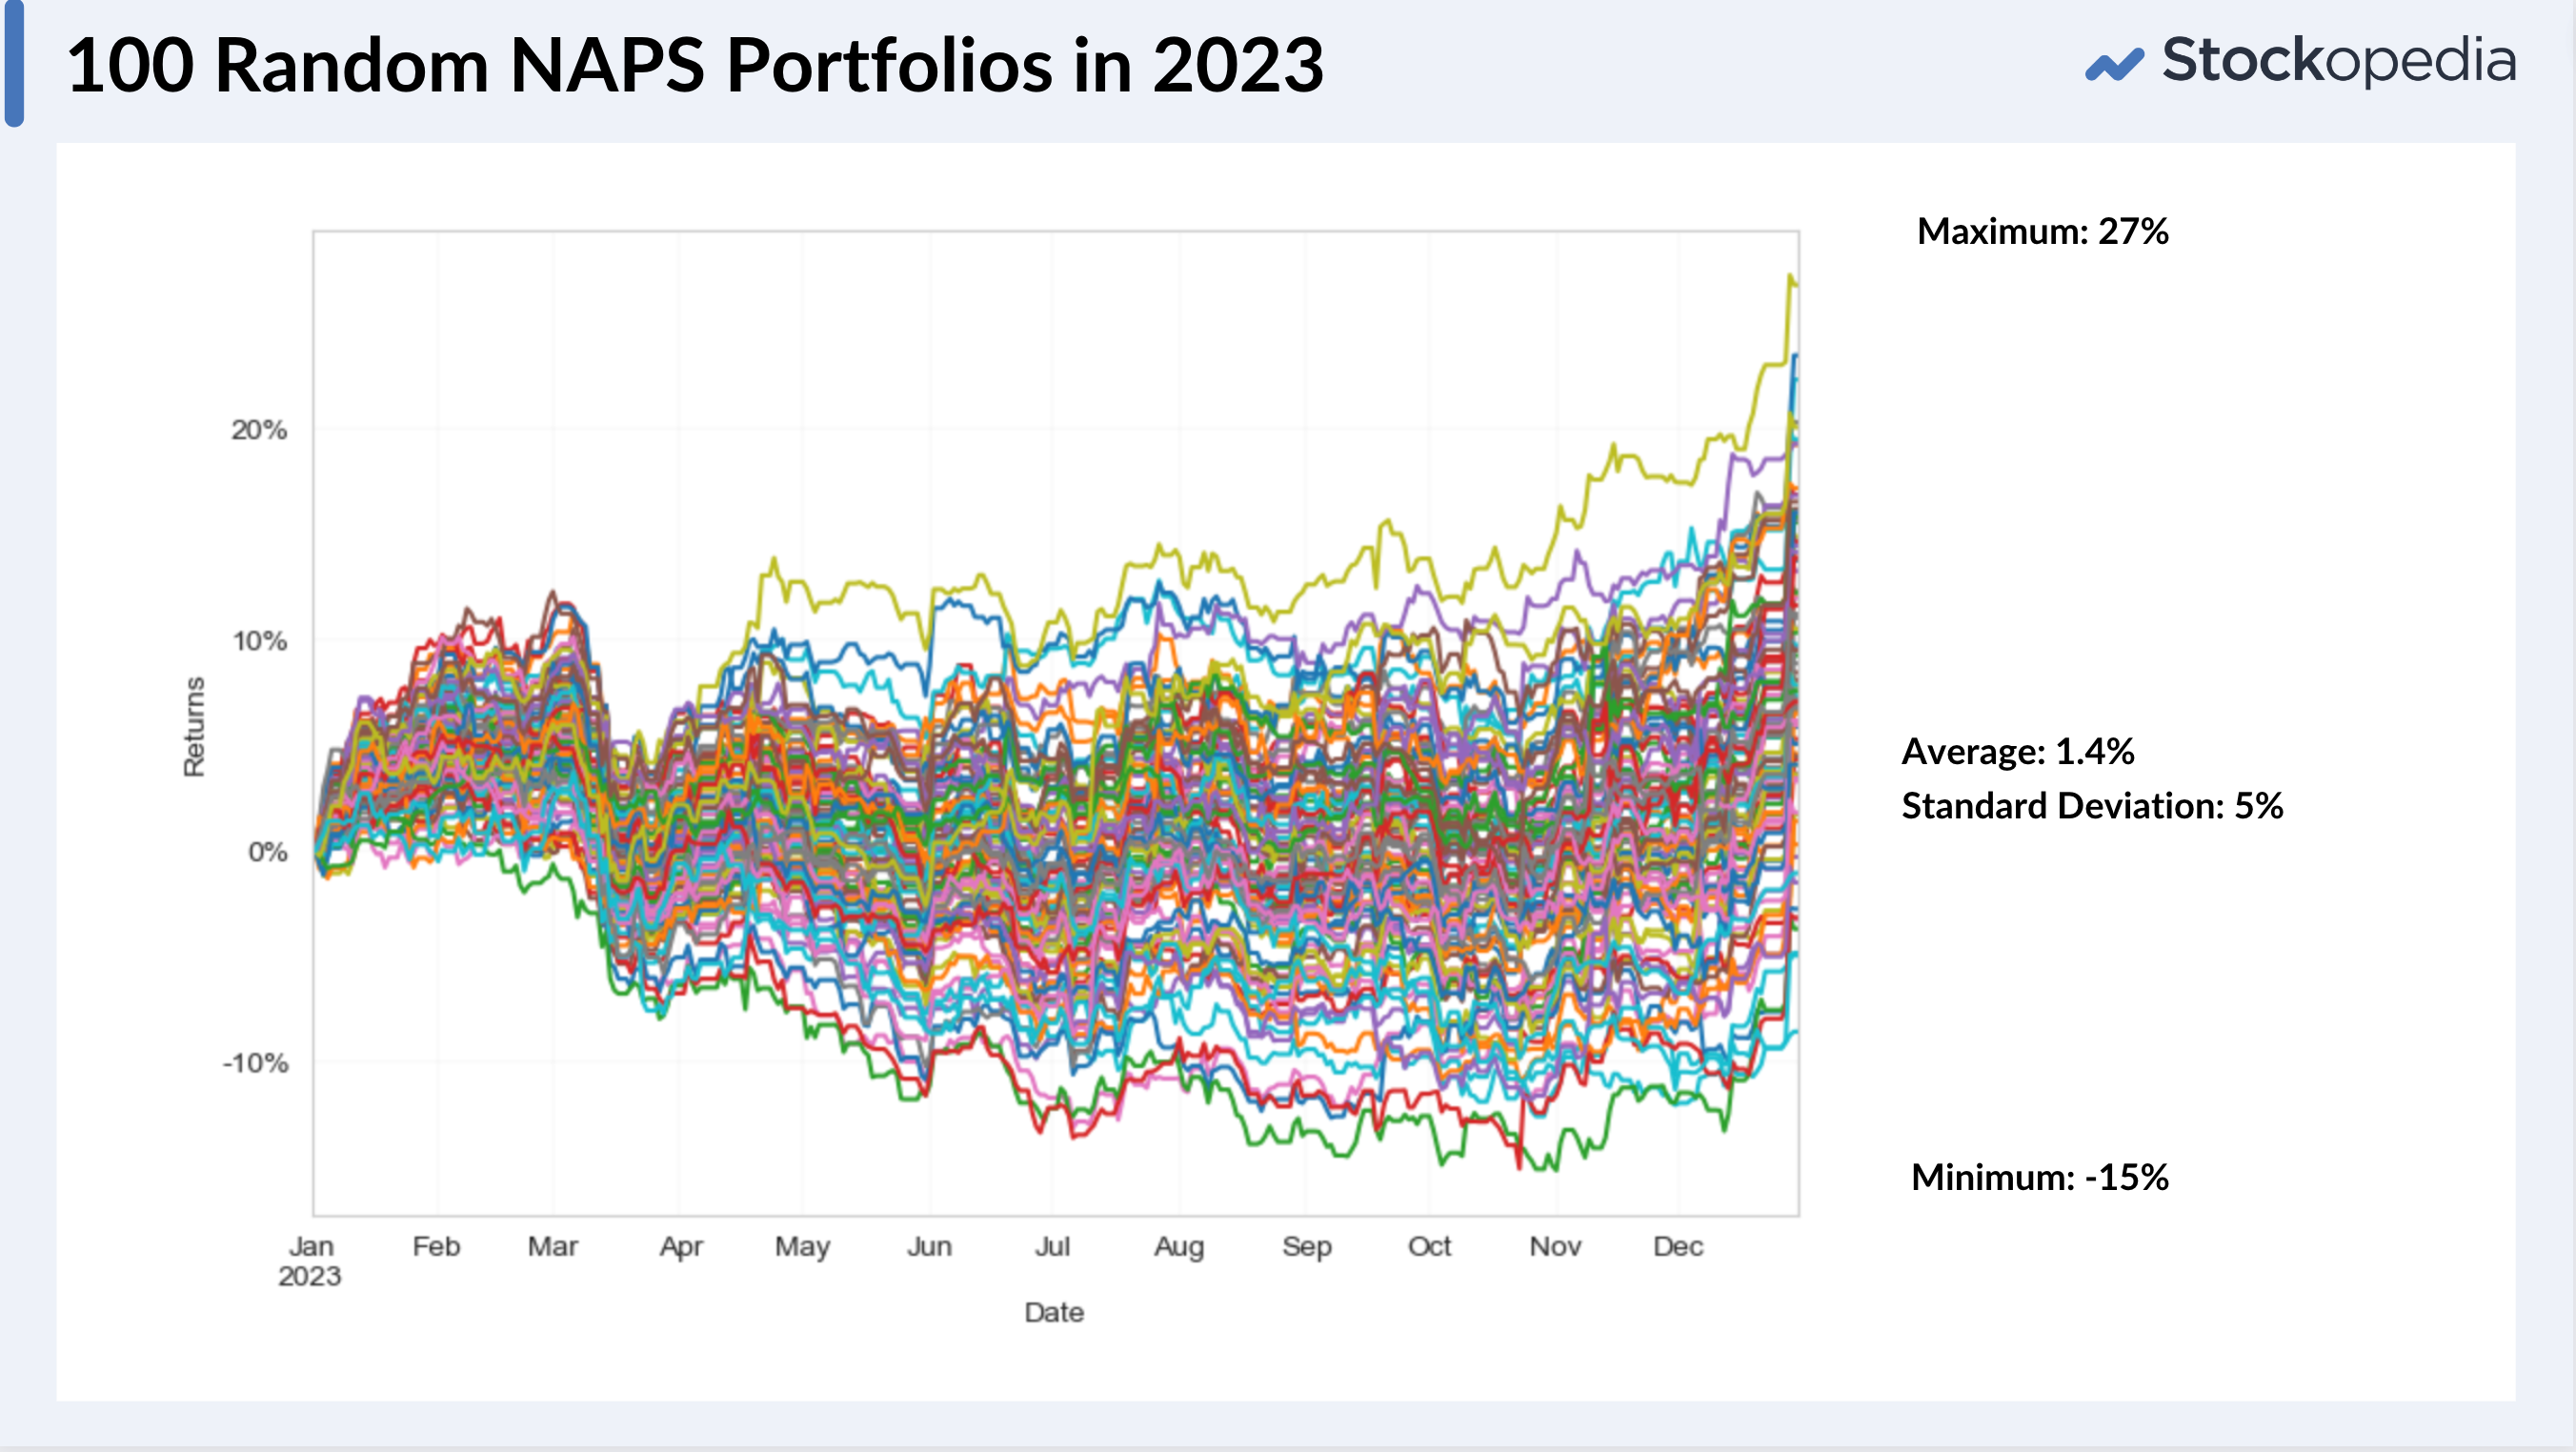
The above line chart doesn’t show all the portfolios, but the average was a 1.4% return, the maximum was 27% and the minimum a horrible -15%. Thankfully the latter is a highly unusual outcome. The “standard deviation” was 4.8%, which essentially means that two thirds of the portfolios returned between -4.8% and +4.8% of the average. So two thirds of the portfolios returned between -3.4% and 6.2%. Smaller portfolio sizes (e.g. 10 stocks) would have a wider range of outcomes, while larger portfolio sizes (e.g. 50 stocks) would be narrower.
Here’s a better illustration of the distribution as a histogram. Apologies for non dweebs, but I love this kind of visualisation as it lays out the variety of outcomes more clearly.
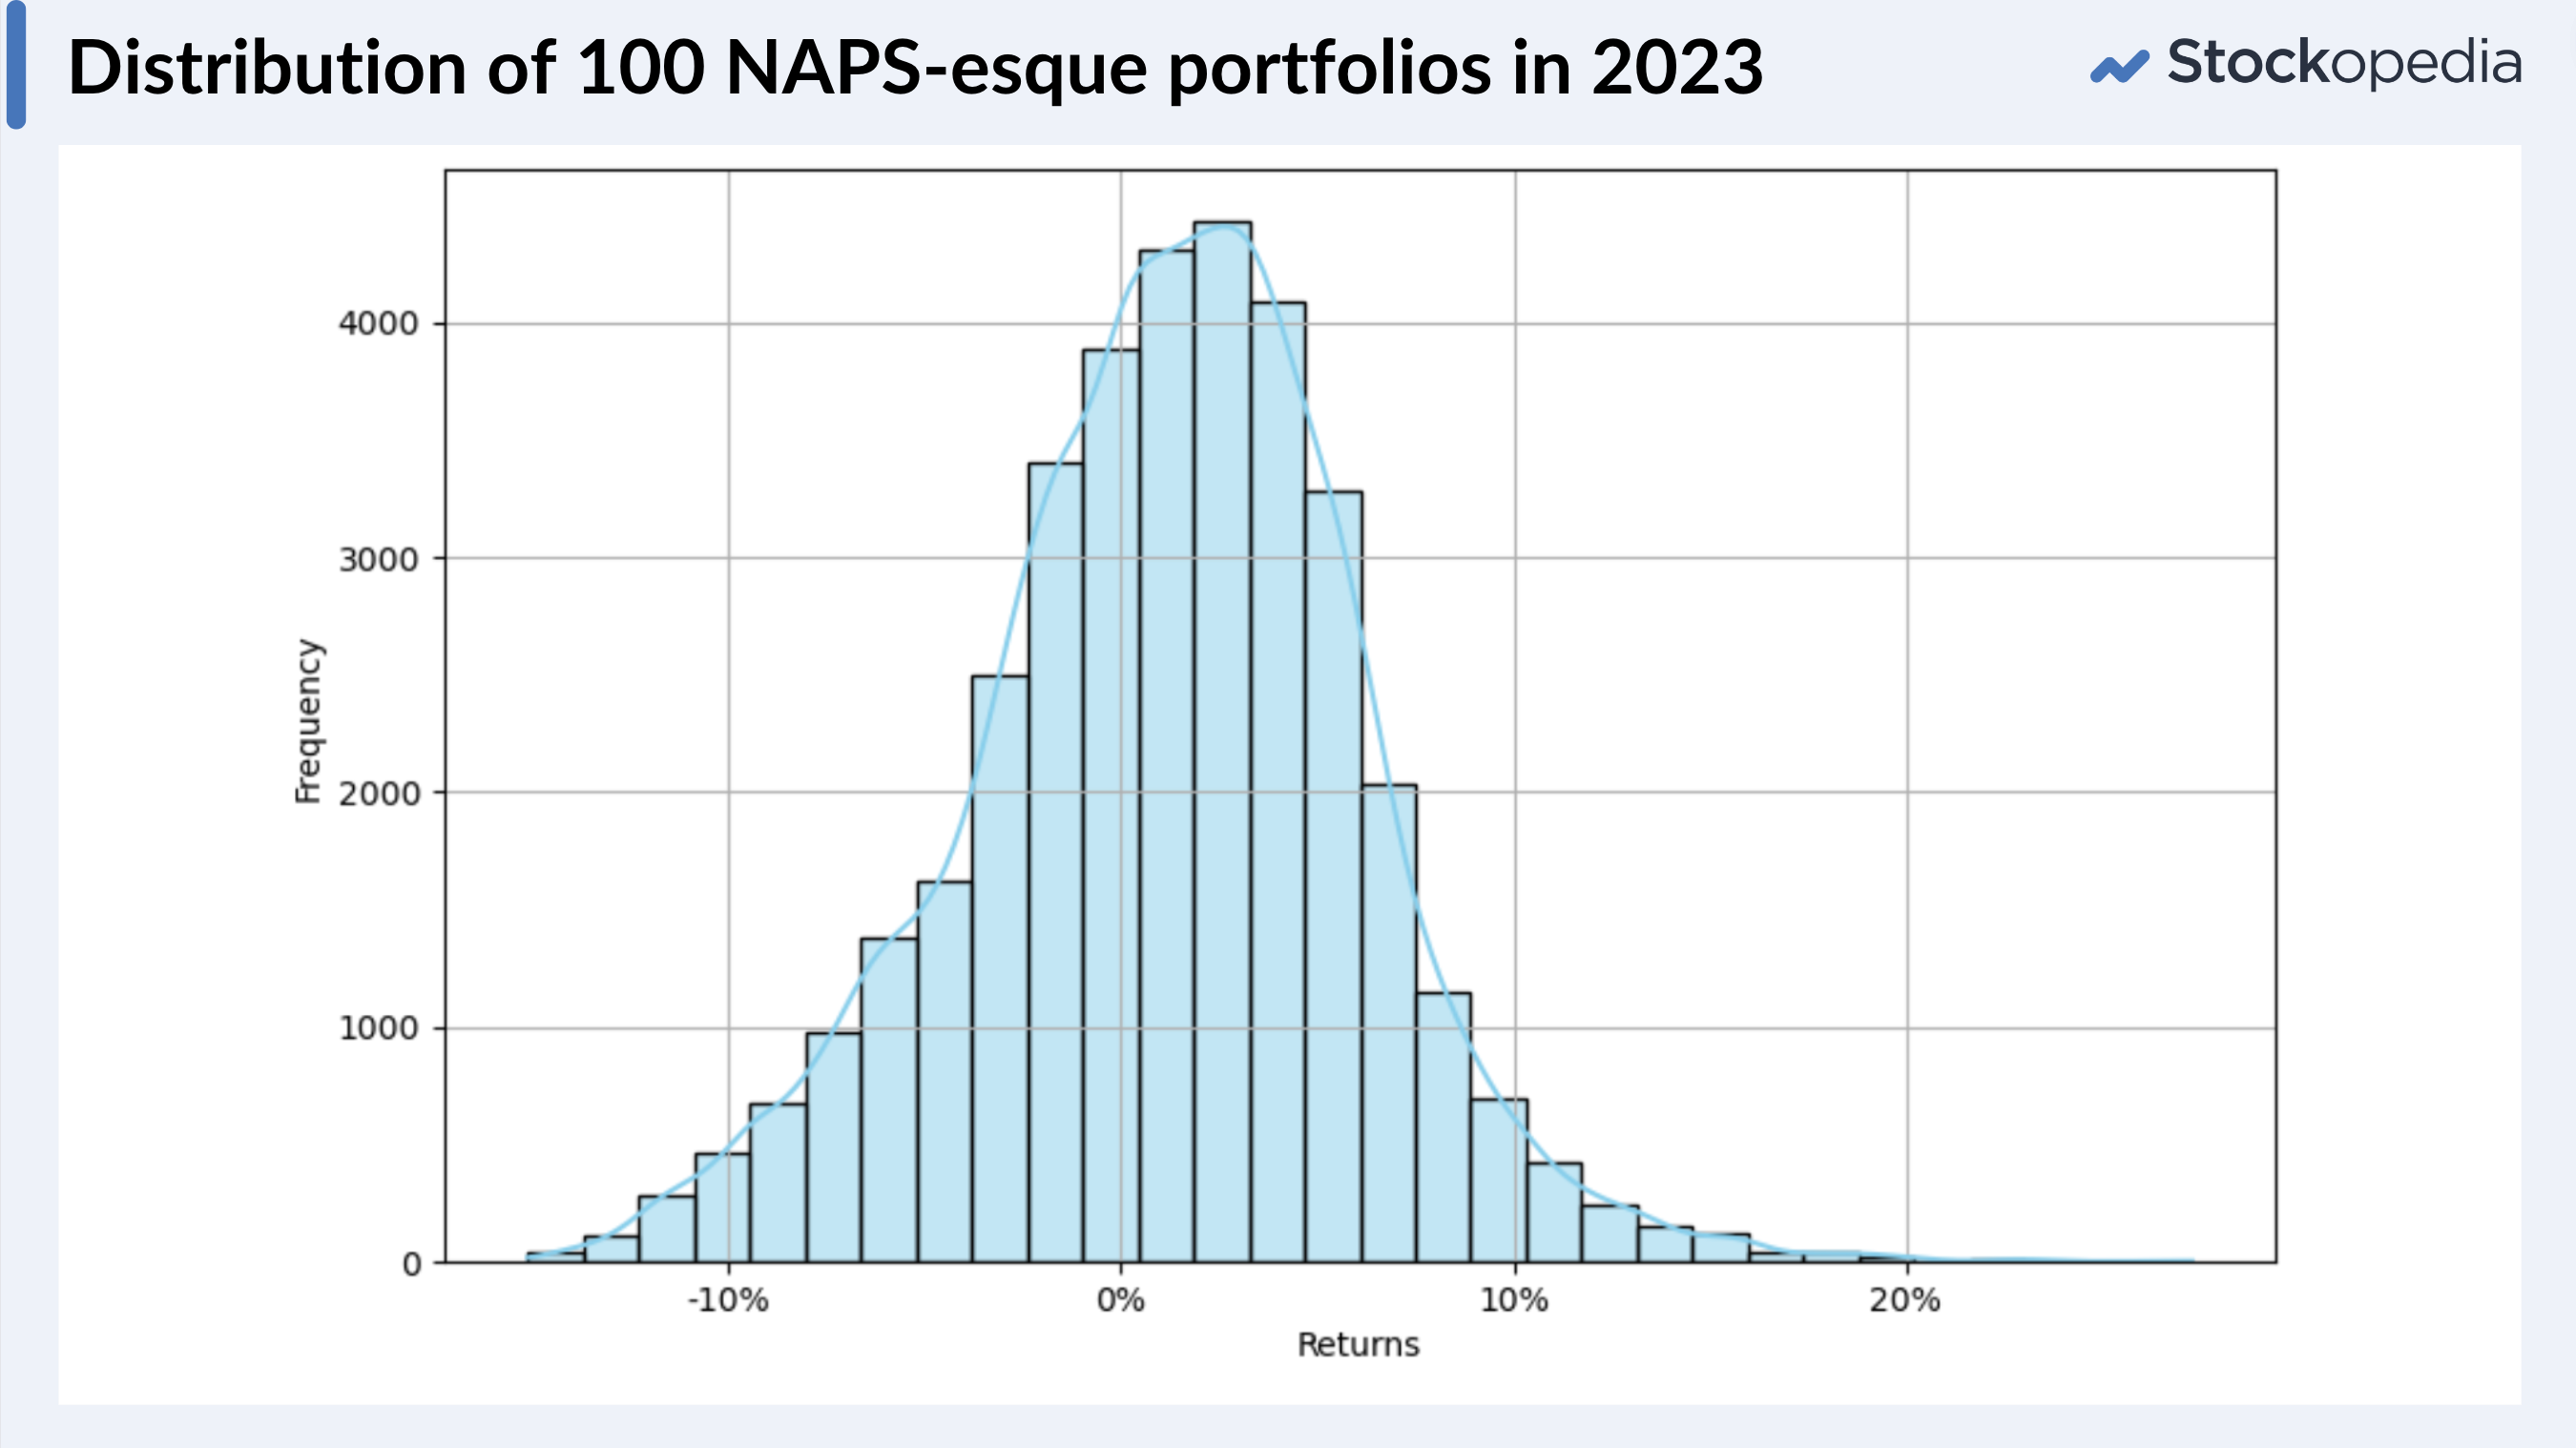
The 1.9% return for this year’s NAPS has proven to be just above average. That’s a pretty fair outcome and I can’t complain. But one would hope that the NAPS construction process, which picks the highest-ranked stocks in each sector (rather than generally high ranked stocks), might skew the portfolio returns upwards in the distribution.
That’s certainly been the case historically. Back in 2015, the first year for the NAPS, the portfolio absolutely rocketed out of the blocks with a 43% portfolio performance. The average “NAPS-esque” portfolio for that year would have returned 15%, so 43% was perhaps a lucky outlier. Here’s hoping that 2024’s NAPS Portfolio benefits similarly!
The 2024 Portfolio
This will be the 10th year of the NAPS Portfolio, and it may well be the last. We are thinking carefully about whether to launch a well considered set of model portfolios across a range of investment styles. These are likely to be systematically guided and cover both capital growth and income preferences. I’d be very interested in the comments to know if this would be of interest.
The 2024 Rules
The last few years have seen the NAPS portfolio divert away from using the core StockRank (QVM) as its ranking method, towards a portfolio built half with high QM (quality and momentum) shares, and half high VM (value and momentum) Shares. I personally use the VM Rank a lot in my own portfolios as I like it’s brutality in finding unloved turnarounds. But a heavy momentum weighting is never ideal when recovering from the lows of a bear market.
So for this year I’ve decided to revert back to basics. We’ll be using the core QVM StockRank, with the following rules:
- 20 stocks from all 10 sectors. No more than 1 utility and 1 telecom. Maximum of three in any other sector.
- Minimum £10m market cap
- Ranked by StockRank descending.
It’s easy to use the Screener or the Sector pages to compile a set of candidate stocks in this way. Rank by StockRank (or other rank) and start selecting stocks two by two from each sector as you go down the list.
It can be sensible to include a liquidity rule to avoid high bid-ask spread stocks if your portfolio size is large. I have in the past used a Spread < 500bps (5%). Metals Exploration and Renold in the list below are just above this cutoff, but with a median bid/ask spread of 0.21% it is a fairly liquid list.
The 2024 Selections
Please note that this educational content only - not investment advice. So please do bear all of this in mind. These are not recommendations. To reiterate, the NAPS process is a completely data-driven approach, without any discretionary choices in the selections. There’s no assessment of the suitability of these as investments for individuals and their preferences, risk tolerances nor their investment goals. So if in doubt, please seek advice.
In terms of diversity, the rules spit out 1 microcap, 6 small caps, 7 mid caps and 6 large caps. That’s a good spread, with some robustness from the large caps. Given my recent timing articles about a new uptrend in the FTSE AIM All Share, the more risk tolerant may be willing to skew more towards small caps.
| Name | Market Cap (£m) | StockRank |
|---|---|---|
| Seplat Energy (LON:SEPL) | 735 | 99.1 |
| Shell (LON:SHEL) | 166836 | 99.2 |
| Macfarlane (LON:MACF) | 183 | 98.4 |
| Metals Exploration (LON:MTL) | 54 | 98.7 |
| Costain (LON:COST) | 173 | 99.4 |
| Vesuvius (LON:VSVS) | 1305 | 99.9 |
| Renold (LON:RNO) | 79 | 100 |
| Redrow (LON:RDW) | 2019 | 99.3 |
| Card Factory (LON:CARD) | 371 | 99.5 |
| Smiths News (LON:SNWS) | 126 | 99.7 |
| Marks and Spencer (LON:MKS) | 5377 | 96.7 |
| Greencore (LON:GNC) | 470 | 99.5 |
| Bank of Georgia (LON:BGEO) | 1819 | 98.5 |
| TP Icap (LON:TCAP) | 1500 | 99.9 |
| Hikma Pharmaceuticals (LON:HIK) | 3929 | 84.9 |
| GSK (LON:GSK) | 59651 | 90.5 |
| Ingenta (LON:ING) | 20 | 92 |
| Computacenter (LON:CCC) | 3410 | 95.4 |
| Airtel Africa (LON:AAF) | 4878 | 94.4 |
| Good Energy (LON:GOOD) | 59 | 99.8 |
Some of these shares are well researched by the community, in the Small Cap Value Report and third party publications. That’s quite satisfying as I like to see shares in the NAPS that discretionary stock pickers have growing interest in. Moreover, quite a few have been showing up in my “Multibagger 2x2x2” screening framework, which suggests the list has opportunity for margin and P/E multiple expansion.
Keelan Cooper has been kind enough to help write up some briefs of the 20 stocks below. Many thanks to him indeed.
Energy
Seplat Energy (LON:SEPL)
£730m Mkt Cap, Oil & Gas.
Nigeria-based oil producer, Seplat Energy, has been on a strong run in 2023. The company’s shares are up almost 25%, as it continues to grow its operations, pay large dividends, and generate substantial free cash flows.
Seplat produces just under 50,000 barrels of oil equivalent per day (9 months 2023 production of 48,152 boepd) from its operations in the prolific Niger Delta. As oil prices remain elevated, this has translated into $172 million worth of free cash flow so far this year (9 months). A price to free cash flow of 3.9, highlights just how impressive this cash flow generation is compared to a company of its size.
Whilst growing operational costs and a debt pile of $348 million on the balance sheet may be a cause for concern for some, at current oil prices, the company can comfortably keep making notable profits and paying down debts. Despite slightly lower oil prices, the net debt figure has dropped 23% from the same point in 2022.
As the company pursues growth via an expanded drilling programme in Q4 2023, and completes work on its ANOH gas plant, Seplat could be set for another strong year ahead should energy prices remain favourable.
Shell (LON:SHEL)
£167bn Mkt Cap, Oil & Gas.
Oil and gas behemoth, Shell, has outperformed the wider UK market this year, but the share price remains below its multi-year highs that is reached in mid-October 2023.
Shell’s share price pullback mirrors the recent fall in oil prices, but this hasn’t stopped the company from continuing to print cash. Scale economies are incredibly apparent in Shell’s operations. The company breaks even at an oil price of $30 per barrel, at $40 per barrel it’s able to pay a dividend and at $50 per barrel, it can carry out buybacks. At the time of writing, the oil price sits just below $80 per barrel.
In the company’s latest Q3 results, it announced that is would be commencing a $3.5 billion buyback programme over the next 3 months, meaning buybacks for H2 2023 would total a whopping $6.5 billion. When you add dividend payments into the mix, shareholder distributions are set to equal $23 billion in 2023.
Even though Shell plans to limit capital expenditure in the coming years and focus on controlling costs, new projects are estimated to bring an additional 500,000 barrels of oil equivalent per day of production online by 2025.
Basic Materials
Macfarlane (LON:MACF)
£186m Mkt Cap, Containers & Packaging.
Serial acquirer, Macfarlane, has demonstrated a unique ability to grow its operations both organically and inorganically over the last decade. The company has carried out 17 acquisitions since 2014, most of these being smaller bolt-on acquisitions, that quickly become earnings-accretive.
Its strategy has enabled it to become the market leader in the provision of protective packaging materials in the UK. The company generates annual sales of just under £300 million from its products and has managed to consistently grow its profits and earnings every year since 2012.
The shares have crept up only slightly in 2023, and remain attractively valued at a price-to-earnings ratio of 9.4. The 5-year average ROCE and ROE of around 15% imply that a higher valuation may be warranted by the market in the future.
Macfarlane’s recent acquisitions of Suttons (Feb 2023) and Gottlieb (April 2023), along with its European operations, are providing an additional boost to sales as the company disclosed that it is facing a period of subdued demand in the UK in its half-year 2023 results. Nevertheless, profits for the full year 2023 are expected to come in as forecasted.
Metals Exploration (LON:MTL)
£55m Mkt Cap, Metals & Mining.
Metals Exploration was one of the top mining performers on the UK market in 2023. The company’s shares have doubled in value since the start of the year, as it feels the full benefits of stronger gold pricing and growing production from its operations at the Runruno mine in the Philippines.
The company announced record operating profits in H1 2023, reaching $31.1 million, up from $9.4 million over the same period in 2022. Metals exploration is now on track to produce between 78,000 and 81,000 ounces of gold in 2023, at an all-in-sustaining cost of around $1,160 per ounce. At current gold prices, the company is making a margin of just over $900 per ounce.
Indeed, the incredibly profitable operating environment means that the company is forecast to earn just under $60 million in profits this year. At the current market capitalisation, this suggests a price-to-earnings ratio of just 2.2 for Metals Exploration, making it one of the cheapest stocks on the market.
There are always larger risks inherent in investing in small-cap mining companies, but the risk vs reward seems to be stacked in favour of the latter in 2024.
Industrials
Costain (LON:COST)
£175m Mkt Cap, Construction and Engineering.
Founded in 1865, Costain Group is one of the leading infrastructure solutions companies in the UK. The company develops pioneering solutions that transform the performance of the infrastructure ecosystem across the UK’s energy, rail, water, transportation, nuclear, and defense markets.
Costain has enjoyed an excellent 2023, which has been reflected by the share price rising 70% since the start of the year. Due to the strength of the company’s operating performance in H1, where operating profits increased 7.1% and the order book visibility became clearer, Costain has also discussed resuming dividend payments.
Another key milestone for the company over the last year was the triennial review of the pension deficit, which has led to substantially reduced payments. The overall fundamental picture for Costain now looks more promising, and a Piotroski F-Score of 8/9 is testament to this.
The key attribute that is worth closer attention is the company’s ever-growing cash pile, which now stands at £132.1 million, or roughly 75% of its entire market capitalisation. Indeed, the company’s operating margins of 2.3% don’t give it much leeway should the economy take a turn for the worst, but the mountain of cash on the balance sheet provides a notable margin of safety for investors.
Vesuvius (LON:VSVS)
£1.3bn Mkt Cap, Machinery, Equipment and Components.
Molten metal flow engineering and technology specialist, Vesuvius, has seen its share price rally by almost 20% since mid-November, on the back of a strong trading update.
The company, which primarily serves the steel and foundry industries, announced that it was on track to meet its full-year targets after it had successfully differentiated its product offering, made market share gains, and maintained resilient pricing. This is evidenced by the company’s excellent quality characteristics, with a near-perfect overall Quality Rank of 98.
As a global leader in its field, Vesuvius invests plenty into R&D each year, operating six hubs around the world. The company’s technological prowess enables it to simultaneously optimise pricing and gain market share, revealing signs of moat factors. Vesuvius is targeting profitability (RoS) margins in excess of 12.5% by 2026.
While steel and foundry markets outside of India have experienced softer demand in recent months, Vesuvius believes that its investment in expanding production capacity in India, Eastern Europe, and Mexico over the past two years will place it in a good position to serve the forthcoming steel market growth.
Renold (LON:RNO)
£79m Mkt Cap, Machinery, Equipment and Components.
Renold is one of only a handful of companies on Stockopedia with a 100 StockRank. The company, which manufactures high-precision industrial chains and related power transmission products, boasts excellent all-around fundamentals.
Renold has managed to outperform the FTSE All Share by 56.8% this year, in line with the growth it reported in its operating profits. Its latest interim results highlighted a 56.3% increase from the prior year to £15 million. Net debt also fell slightly to £28.3 despite the bolt-on acquisition of Davidson Chain in Australia.
Furthermore, the company’s pension deficit, which was previously a cause for concern for investors, has been reduced to £52.7 million. All of these improving attributes are reflected in its fundamentals. For example, by a price-to-sales ratio of 0.31, or a return on equity of 36.3%, or by the analyst forecast chart, which shows sharp upward revisions to EPS estimates.
As the second largest industrial chain manufacturer in the world with a <10% market share, Renold certainly possesses a certain savoir-faire. In his book, “Hidden Champions of the 21st Century”, the business consultant Hermann Simon discusses the idea that small to mid-sized firms, which operate in niche markets and are market leaders in their industries, tend to become very successful. Renold shares many such characteristics.
Financials
Bank of Georgia (LON:BGEO)
£1.8bn Mkt Cap, Banking Services.
FTSE 250 Bank of Georgia Group, a standout performer in 2023 NAPS Portfolio with a 51% gain, revisits for 2024. BGEO Group split in 2018 into a pair of listed UK stocks - BGEO (a pure play banking entity) and Georgia Capital (a diversified investment vehicle) which have both performed well. The bank has established itself as a dominant force in Georgia’s retail and corporate banking sector, vying with TBC for leadership with a third market share.
Georgia's robust economy, bolstered by GDP growth exceeding 10% annually in recent years and unique free trade agreements with both the EU and China, provides a fertile ground for the bank's growth. Strategically located between Europe and Asia, BGEO benefits from an increasingly liberal market environment and ongoing reforms aimed at deeper European integration.
Its strong Q3 2023 performance, highlighted by a 23% increase in profits and a remarkable 31% return on equity, underscores its financial strength. Additionally, the bank's focus on digital innovation, including a "Financial Super App," coupled with a strategic share buyback program and solid capital distribution, further solidifies its position as a leading banking institution in the rapidly expanding Georgian economy.
TP Icap (LON:TCAP)
£1.5bn Mkt Cap, Investment Banking & Investment Services.
A frontrunner in global financial markets infrastructure, TP ICAP is renowned as the world’s largest inter-dealer broker in energy and commodities, with subsidiaries like Parameta Solutions providing OTC derivatives pricing data, and Liquidnet in dark pools.
The company’s strategy orbits around three key objectives: “business transformation” - especially deploying its new integrated Fusion electronic platform; “diversification” into emerging markets like renewables and digital assets; and “dynamic capital management” with commitment to freeing cash to return to shareholders via a 50% payout ratio.
ICAP seemed to overpay when it bought Liquidnet, in September 2021 for $700m, which became a drag on the share price, and shareholders are now pushing ICAP to spin off Parameta Solutions. Parameta is reputed to be worth the entirety of ICAP’s £1.5 billion market cap, which, if true, suggests the rest of ICAP comes in the share price for free.
In his speech at Mello, Lord Lee talked about the fact that you can’t go too wrong buying stocks at the “devils double” with a P/E below 7 and Yield above 7. TP ICAP on a forward P/E of 6.9 and Yield of 7.2% fits the bill.
Consumer Cyclicals
Redrow (LON:RDW)
£2bn Mkt Cap, Homebuilding.
FTSE 250-listed housebuilder Redrow saw its share price soar 25% over the last 2 months as inflation has started falling more quickly than anticipated, which could lead to the Bank of England deciding to reduce interest rates early next year. Most UK housebuilders have finished the year on a similarly strong note, with expectations that we’ve now seen the end of quantitative tightening.
Whilst it has been a difficult period for housebuilders dealing with higher build cost inflation and reduced demand due to the more burdensome interest costs of mortgages, it looks like Redrow has dealt with the challenges quite well.
Redrow was able to return £133 million in the form of a share buyback and interim dividend paid to shareholders in 2023. Its return on equity stood at 19.9% for the full year, demonstrating its excellent quality characteristics even in difficult times.
The company’s latest AGM update in November 2023 highlighted weaker trading than expected during the Autumn period. However, it still expects to meet its profit before tax target of between £180m and £200m and have over £150 million in net cash at the end of June 2024.
Card Factory (LON:CARD)
£370m Mkt Cap, Specialty Retailers.
Card Factory, the FTSE Small Cap cards, gifts and party supplies retailer, has demonstrated remarkable resilience and growth since the challenges of the pandemic. Through 2022, the company's sales surged 27% to £463m, with pretax profits and EPS seeing significant increases. Card Factory’s vertical model, in which it manufactures all its own cards from its UK operations, somewhat protects it from supplier issues. Under CEO Darcy Willson-Rymer, the company's expansion into the gifting sector is just beginning, complementing an already strong greeting card business.
While growth in 2023/24 is more moderate, Card Factory's potential in gifting and international wholesale partnerships, particularly in the US, shows promising potential. Willson-Rymer's ambitious target of £650m in sales by 2027, supported by significant technology investments, positions Card Factory for continued success. It was able to navigate the pandemic with no additional fundraising and thus no share dilution for investors. With revenues now ahead of its pre-pandemic peak, and profits returning to those levels, a share price at a third of its 2015 peak seems anomalous.
Major Shareholder Teleios Capital Partners has been reducing their stake, which may be a headwind to the share price, but a P/E Ratio of 8x forecast earnings seems too low for a good business.
Smiths News (LON:SNWS)
£126m Mkt Cap, Media & Publishing.
Smiths News, which can trace its origins back to 1792, when it first started delivering the nation’s newspapers, has finished the year up around 8.5%. However, as my colleague Oliver Cooper recently pointed out, there has been a notable breakout in terms of volume. The average daily volume over the last 10 trading days is 147% above the average volume traded over the last 3 months, which could indicate a strong start to 2024 for the company.
Smiths News has done an excellent job of creating efficiencies and improving margins over the last few years, to mitigate the impact of the structural decline of sales volumes in the UK’s newspaper and magazine market. As a result of the changes it has made, which included the disposal of loss-making assets, it has managed to turn a profit in each of the last 3 years.
Despite a notable lack of forward-looking growth, the company looks exceptionally cheap on a variety of valuation metrics. A price to free cash flow of 3.8 and prices to sales of just 0.11, imply that there could be a unique value opportunity at play. Furthermore, a forward dividend yield of 7.94% might provide an added incentive for income investors.
Consumer Defensives
Marks and Spencer (LON:MKS)
£5.4bn Mkt Cap, Food & Drug Retailing.
One of the best success stories on the London Markets in 2023, Marks & Spencer has seen its shares advance by a staggering 115% after it started the year trading at 126p a share. It’s been a remarkable turnaround for M&S, which has managed to increase revenues, cut costs, and drastically improve profitability in a very short space of time.
Central to these efforts has been its focus on expanding and further improving the quality of its food range. In the company’s latest H1 results, published in November 2023, it announced that food sales were up 14.7% year on year, far outperforming its mainline competitors. M&S has been able to gain market share as a consequence.
M&S has also worked relentlessly at reducing structural costs across the business, delivering £100 million of cost savings in H1 and aiming for £400 million in total savings by FY 2028. This can now be seen by its industry-leading quality metrics.
The increased profitability and free cash flow generation mean that the company can now focus on reducing its debts, restoring its dividend, and continuing to reinvest into the business, including its Ocado operations. Let’s see if M&S continues on its strong trajectory in 2024, analyst forecasts certainly seem to think so.
Greencore (LON:GNC)
£459m Mkt Cap, Food & Tobacco.
Greencore, a leading Irish manufacturer of convenience foods, reported strong financial results in November 2023. Despite exiting low-margin business, the company achieved volume growth ahead of the market average, with adjusted operating profit reaching £76.3 million in FY23, equivalent to a 5.7% increase. The strategic focus on stabilizing the business and rebuilding profitability was marked by the completion of "Horizon 1" objectives and the transition to "Horizon 2."
Cost control measures and efficient operational initiatives enabled Greencore to navigate input cost inflation successfully. The company's net debt to adjusted EBITDA reduced to 1.2x, and return on invested capital (ROIC) increased to 8.9%. A continued share buyback program reinforces the commitment to returning £50 million in value to shareholders.
Greencore's diversified operations, with 23 manufacturing units and a robust distribution network, supply major UK supermarkets (like Tesco’s, M&S, and Aldi), convenience outlets, travel retail, discounters, and more. The company's strategic pillars for growth include broadening its product proposition, deepening customer relevance, and achieving further differentiation.
Despite market challenges, Greencore remains confident in delivering within the range of current market expectations for FY24. The company's shares were up nearly 50% in 2023, as its improving fundamentals and positive price momentum gained speed.
Healthcare
GSK (LON:GSK)
£59bn Mkt Cap, Pharmaceuticals.
Biopharmaceutical giant, GSK, reported some impressive performances from its diverse product portfolio in the company’s latest Q3 results. Total sales grew 10%, and there was a commendable 33% increase in vaccine sales, particularly driven by the successful launch of Arexvy, the world's first RSV vaccine.
GSK’s commitment to innovation is evident in its R&D investments, which were worth £5.5 billion in 2022. The company continues its focus on key therapeutic areas like infectious diseases, HIV, respiratory/immunology, and oncology. Its wide-ranging portfolio generated £29.3 billion in medicines and vaccine sales in 2022, and it continues to fortify its position with a robust pipeline boasting 18 assets currently in phase III/registration.
CEO, Emma Walmsley, recently re-iterated that GSK's progress in vaccines, combined with its ultra long-acting HIV portfolio and respiratory prospects, point towards a bright long-term outlook for the business.
Indeed, the company now believes that EPS is set to grow by 17 to 20% (up from 14 to 17% before) for FY 2023. Despite GSK’s exceptional growth, momentum, and quality metrics, its share price remained relatively flat this year.
Hikma Pharmaceuticals (LON:HIK)
£3.9bn Mkt Cap, Pharmaceuticals.
Hikma Pharmaceuticals is a global pharmaceutical company with operations across three key segments: Injectables, Generics, and Branded. In its November 2023 trading update, the company reported robust performance, particularly in its Branded and Generics businesses, prompting an upgrade in full-year guidance. The Injectables segment also witnessed decent growth globally, with notable expansion in MENA, Europe, and North America, overcoming short-term supply constraints. Despite these challenges, the company is investing extensively to enhance manufacturing capacity and product pipelines.
The Branded business is experiencing strong demand, especially for chronic illness treatments in MENA, offsetting currency devaluation and facility closures that have slightly impacted profitability. Hikma's half-year results in August 2023 showcased an 18% revenue increase, a 35% surge in core operating profit, and a robust balance sheet.
The company recently appointed a new CEO, Riad Mishlawi, who is now leading efforts to expand manufacturing facilities, launch new products, and reinforce its position in oncology medicines. Despite positive results and an optimistic outlook, the market response has been subdued since the November trading update, presenting a potential opportunity for investors given the company's low price-to-earnings ratio of 10.6.
Technology
Computacenter (LON:CCC)
£3.4bn Mkt Cap, Software & IT Services.
Founded in 1981 by British entrepreneurs Peter Ogden and Philip Hulme, Computacenter has emerged as a leading global technology and services provider, listed on the London FTSE 250. The company enjoyed a stellar 2023, as its share price climbed by 44.5% to reach highs not seen since April 2022.
H1 2023 results illustrated a robust 26.8% growth in revenue, setting the stage for the company's 19th consecutive year of adjusted earnings per share growth. Impressively, Computacenter has managed to achieve a 3-year EPS compound annual growth rate of 16.1%. A focus on strategic initiatives and a reduction in inventory have also contributed to a strong balance sheet and net cash position, reinforcing its financial strength.
The recent Q3 2023 trading update also aligns with expectations, showcasing robust performances in Germany and the US. Despite facing challenges in the UK, Computacenter maintains optimism for FY 2023, anticipating sustained profitability growth and the expansion of market share. The company's commitment to long-term resilience, strategic investments, and consistent growth positions it as a distinctive opportunity within the UK technology landscape.
Ingenta (LON:ING)
£20m Mkt Cap, Software & IT Services.
The minnow of this year’s set at only a £20m market cap, Ingenta is an Oxford based publishing services provider that’s been listed for decades. It provides content production, delivery and commercial management software and services to publishers across academic and trade verticals. The group is actively targeting expansion into the music, gaming and media markets where it perceives its IP and royalty management expertise as being valuable. Recent contract wins show some green shoots.
Management have achieved £4 million in cost reductions since 2017 to turn the group sustainably profitable, with £11m in sales and 80% recurring revenue generating high returns on capital, profits are forecast at £1.8m this year.
As a niche business, offering often bespoke solutions and consultancy, the growth potential may be perceived as limited. No borrowing, 80% recurring revenues, and client relationships spanning decades do give comfort though that the business is sustainable. Nonetheless, it is moderately valued, dividend-paying and buying back shares. The business progress has seen the share price triple over the last few years. Seems too small to be listed, could it be acquired?
Telecoms
Airtel Africa (LON:AAF)
£4.9bn Mkt Cap, Telecommunications Services.
Airtel Africa, the second-largest telecom operator in Africa, has reported robust H1 2024 performance, showcasing its leading position in the telecommunications and mobile money sector. With a customer base of 147.7 million, including 59.8 million data customers and 36.5 million Airtel Money users, the company has experienced 23 consecutive quarters of double-digit revenue and EBITDA growth. Notably, in H1 24, Airtel achieved a 19.7% revenue growth in constant currency, driven by the expansion of its 4G services across all 14 markets.
The company's strategic focus aligns with the demographic trends in Africa, capitalising on a young and growing population, urbanization, and limited infrastructure. Airtel Africa aims to reduce the digital divide and enhance financial inclusion by delivering affordable telecom services and fostering digitalisation uptake.
The company's growth strategy encompasses network enhancement, distribution expansion, and maximising the value of data-based services and mobile money. Despite foreign exchange headwinds, the financials continue to demonstrate resilience, with EBITDA growing by 20.7% on a compound annual growth rate over the last 5 years.
Whilst the late Jim Slater said that “elephants don’t gallop”, this large cap trades on a price to earnings growth ratio of 0.8, and has strong price momentum over the past month.
Utilities
Good Energy (LON:GOOD)
£63m Mkt Cap, Electric Utilities & IPPs.
Good Energy, the renewable energy services supplier, has sprinted out of the blocks in the last few months as its share price doubled. Some recent windfall energy trading profits, due to smart wholesale costs hedging, boost the cash balance to £34m which is more than half the market cap. This values the rest of the business, excluding cash, on less than a P/E of 7. The company does warn that these H1 windfall profits are temporary and losses will accrue in H2, but nonetheless the future could be optimistic for GOOD.
The company is changing strategy away from energy supply (for which regulations require low margins) and into higher margin, and higher growth, energy services. These include solar installations in a market that’s forecast to grow at 10% annualised to 2030, but also heat pump installs which may be set to accelerate. It also owns Zap-Map which is the leading electric car charge point app in the UK, independently valued at £15m or so with a million downloads and almost £2m ARR.
The company is positioning itself to acquire regional players to scale its installation services, and benefit on the backend post-installation via tariff, monitoring and finance packages. As with all small caps, plenty of execution risks, but with increasingly green-conscious energy consumers Good Energy has a growth market to play in.
Wishing everyone a prosperous 2024!
Disclaimer
This is not financial advice. Our content is intended to be used and must be used for information and education purposes only. Please read our disclaimer and terms and conditions to understand our obligations.
84 comments
Yes I actually rejoined hoping to catch the latest SNAPS selection or at least something in it's place?
You can always do your own. You just pick the top 2 in each sector. But there was nothing in the Health sector, unless you include Beximco Pharmaceuticals (LON:BXP), which is a dual listing.
If Ed is not doing one, l can supply one. But l exclude wide spreads, over 5% and high debt.
l usually do them monthly but have lost some interest recently.
Can we have the SNAPS for 2024?
I was just wondering if there is to be a SNAPS24? I found the NAPS23 very useful
Ref Good energy would I be correct in presuming that they rely on the largesse of customers to pay above cap prices (voluntarily) so they can be seen to be getting top banana green credentials? If this is the case I would massively worry that if we were to get glut of cheap energy deals could that not put them in a position where they couldn’t cope if the price differential was too much? At present it all seems like a closed ship cartel with limited supply at too whack prices - at some stage though I would expect more options for customers and better deals to come to market ? When that would be I know not. Another worry would be that now green is big and established enough any positive subsidies would start to be removed as the main job over getting green to be the majority player in town is done.
Are holders happy this company can compete on open fair and free of subsidies and box ticking world?
Good Energy has also tanked since the start of the year and in my NAPS portfolio is showing a 23% loss - 8% down today alone - which makes me wonder if I should just cut my losses on this share, and redeploy the money in June at the 6 monthly review of the portfolio, rather than just hoping for a recovery.
I know selling is not in the spirit of the no-admin approach, but I am inclined to being more active this year, after the last couple of years which haven’t been great.
I noticed that Good Energy started falling after a recent Mello presentation. if anyone here watched that presentation, you could perhaps fill Derek in with its contents. it might have been the same presentation that is on InvestorMeetcompany though.
GOOD Is a speculative small cap - so volatility of 45%-70% per year is par for the course (either way!).
One has to make a decision as to whether to use stop losses or not and at what level. It really does depend on one's personal circumstance, timeframe, activity level, capital preservation needs, volatility of the share etc. We can't give financial advice of course, so it's really a personal decision.
Nice to see Redrow pop up 15% today, which, of course, compensates. It's pretty normal in the NAPS for some Stocks to do well and others to do poorly. In any average year over the last 10, 90+ StockRanks tend to have a distribution of 55% winners and 45% losers, but the winners tended to win more than the losers lose. In bullish markets, the distribution can be as high as 80/20.
Hi Derek,
I own and I'm watching Good Energy (LON:GOOD) and as you state it has dropped around 23%.
Looking at the chart below the share price has dropped down to the support line (red horizontal dotted line). Hence, the share price might bounce back from its support line because twice previously the share price has bounced back from support and gone on to make new highs. The good news is that the 55dma (black line) is well above the 200dma (red line). Should the black line cross below the red line this is known as the Death Cross and at that point I will definitely sell.
Likewise, GOOD has a resistance line around 420p so should the share recover then it will probably take a few attempts to breakout above this price level. If you look at the Stochastic it is down to 10, anything below 20 in my opinion is viewed as oversold. I'm happy to keep holding GOOD because it has some very good fundamentals. As Ed has pointed out, volatility is to be expected with speculative shares. One option would be to give GOOD until the end of the week and see if the share price starts to recover, if is doesn't then look to sell it next week, this is something I've done in the past whilst I've slept on a share for an extra day or two.
David.
Many thanks to both David and Ed
I have started a NAPs portfolio (my first) at the end of January 2024 and so was feeling as though Good Energy (LON:GOOD) might be a bit of a turkey as well, being down now 28%. I partly blame the fact that, despite qualifying for 7 Long screens, it may be facing a negative pile on given that it also qualifies for 1 short screen (based on it's Beneish M-Score). The suggestion being that it has a high risk of earnings manipulation given that it currently faisl 4 of 8 M-Score tests: reduced gross margin, slower depreciation rates, slightly excessive accruals, and excessive sales growth. I put these down to the change in business model in 2022 that has been described above and (I hope) merely adjusting to a new (improved) normal. My faith is also maintained by the fact that two directors have recently (12/2/24) bought new shares suggesting that they believe the numbers are not too good to be true. Not massive investments on their part but they are not jumping ship despite the market jitters and see it as an attractive price point. Besides that, PER(f) 8.2, no debt, ROCE more than doubled to 47.9, an increasing dividend and Book Value ps, EPS growth of 55.7% at a PEG of 0.2, there's a lot to like...
I will be waiting until 2023 results are out on 15/3/24 (beware the Ides of March) before deciding what to do but am hopeful that once last year's results are in that will provide a likely moment for the share price to take off again.
As well as the modest director buys, I see that Good Energy (LON:GOOD)'s broker forecast for 2024 on the StockReport has ticked up in the last few days. Also an intriguing TR1 with Ecotricity suddenly having 26% of the shares - knowing hardly anything about this company, can anyone quickly explain how this has likely reached this position with so little fanfare? EDIT - think I've answered my own question, linked to recent acquisition..
Ecotricity have held shares in Good Energy (LON:GOOD) since 2016 reaching 28% in 2022 when they held 4,740,091 shares. I can't see any other disclosures since then by ecotricity and the current disclosure states they hold the same number of shares, 4,740,091. There was a recent placing of 1,322,000 shares, so the total shares in issue has increased to 18,216,130, resulting in Ecotricity's holding reducing from 28% to 26%.
Thanks, think I was editing my post as you posted. The TR1 could have made this clearer but I guess those close to the company, unlike me, would have known what was happening anyway.
AAF - ouch, not a good start to the year for one of the 2024 NAPS investments. Depreciation of the Nigerian naira leading to a virtual halving in relation to the US dollar. See news piece copied below. I've had this on a watch list for ages but it never felt quite right to hit the buy button. This level of currency volatility has suprised, as has the rise in SP. Company reports in US$.
For anyone more knowledgeable than myself (not difficult) will the currency depreciation not cause a huge drop in any forcasted future revenue? Talk of 'constant currency' metrics is all well and good but what matters is the ability to pay international dividends and capital costs - that's going to be a head wind. The virtually halving of the naira makes me think this co. is going to have to run faster just to stand still - sure it has admirable growth plans and share buy backs planned but if the value of your income stream is dropping dramatically your fundamentals are going to suffer.
TOP NEWS: Airtel Africa shares up as plans share buyback; profit down
1st February 2024
(Alliance News) - Airtel Africa PLC on Thursday said it plans to launch a share buyback programme starting next month, as it reported a decline in profit and revenue amid a depreciating Nigerian currency.
The Africa-focused telecommunications firm said pretax profit fell to USD43 million in the third quarter ended December 31 from USD285 million a year before.
Revenue fell 8.3% to USD1.24 billion from USD1.35 billion. Total finance cost more than doubled to USD365 million from USD161 million, as the company noted an impact from foreign exchange losses due to the devaluation of the Nigerian naira.
On December 31, a dollar bought around NGN897, doubled from NGN448 a year before.
The naira plunged after President Bola Tinubu removed Nigeria's foreign currency controls. On June 17 alone, the dollar jumped by 41% to NGN656.51.
Despite the profit decline, Airtel Africa aims to launch a share buyback programme of up to USD100 million over a 12-month period, starting early next month.
Meanwhile, the company confirmed that Sunil Taldar will become chief executive officer on July 1. Taldar had joined the company in October.
Outgoing CEO Olusegun Ogunsanya said: "This strong operating performance has limited the impact that currency movements have had on the group. In this regard, whilst further currency devaluation, particularly in Nigeria, has weighed on our reported financial performance, it will not affect the execution of our growth plans."
Airtel Africa shares were up 3.7% to 116.40 pence each on Thursday morning in London.
A useful piece of work. It shows what we are up against and explains why annual investment performance can be so variable.
Thank you.
I understand fully why stocky doesn’t include divi data for commercial reasons - anything that requires extra costs and man hours has to be paid for somewhere - I accept this as the tools we get here fir highlighting investment choices are more than enough for my needs- but one does need to understand the limits of data screens etc if the elephant in the room of most of the positive return by way of dividends excluded from much of the output info.
If Stockopedia was FCA regulated Ed would not be permitted to publish this article. No regulated fund manager could ever publish anything like this, quoting statistics based on capital perfomance only.
If Stockopedia wants to take shots at the fund managers and decry their performance (and somebody should, I've no complaints about that) it may wish to consider publishing the performance of the NAPS portfolios to GIPS standards.
Then start throwing stones.
In the meantime, perhaps best not to stick out statistical analyses based on partial data. What on earth is the point of quoting standard deviations when your sample mean falls below the dividend yield.....??!!
For the uninitiated, could you please explain main aspects that should be taken into account to meet GIPS standards?
Most major asset managers will publish their performance to GIPS standards so that investors know they are comparing apples with apples.
Stockopedia can't do it:
"Because the GIPS standards require that the total return for the
benchmark be presented, a price-only index will not satisfy the
requirements of the GIPS standards."
Stockpedia is unable to factor in dividends - the charts are price only and will take a dip every time an equity goes ex-dividend (or a very big dip for special divis). Similarly it can make no allowance for the compounding of dividends. Over longer time periods that is like ignoring the entire positive return from the UK market.....and the price/date at which dividends get reinvested matters, you can't fudge things by adding a dividend yield to the capital performance.
Total return calculations are difficult and require accurate dividend histories as well as robust corporate action data for splits etc. However, there are retail products that can do it - Sharesight being a good example.
Stockopedia doesn't even include total return indices - if you load up your stocks into a Folio and then select an index as a comparator, that index will be price only. No fund manager would ever be permitted to do this - it would always be total return.
I questioned Stocko regarding the FTSE Allshare available as a benchmark for Folios, and the response was that they had chosen not to make the Total Return version available for "business reasons". Which is rather galling if you just spent a couple of days loading up your dividend history into Folios.
That could be because FTSE are charging more than Stocko wants to pay, or because it would make Folios look like they were underperforming (maintaining dividend data can be hard work).
very helpful, thank you, and a salutary reminder to watch out for!
Interesting as always.
Are you able to provide any update on the performance of the SNAPS and whether it outperformed NAPS in the second half of the year?
@Blissgull - unfortunately I am not tracking the SNAPS performance any longer. It would indeed be interesting.
Thanks Ed, great article as ever on NAPS. One of the strengths of this approach has been the consistency of running it for many years showing that the long-term performance has been very strong but that isn't true every year. Your randomised experiment also showed this effectively. One small thing, I believe there was a slight typo regarding standard deviation which understated the strength of performance:
The “standard deviation” was 4.8%, which essentially means that two thirds of the portfolios returned between -4.8% and +4.8%.
should have stated something more like this:
The “standard deviation” was 4.8%, which essentially means that two thirds of the portfolios returned between -4.8% and +4.8% of the average. So two thirds of the portfolios returned between -3.4% and 6.2%.
"The “standard deviation” was 4.8%, which essentially means that two thirds of the portfolios returned between -4.8% and +4.8% of the average. So two thirds of the portfolios returned between -3.4% and 6.2%."
Michael - you are absolutely right... I actually wrote this a few days before New Year when the return for the year was bang on 0%... so the copy was right then, but I updated all the performance figures for the year end numbers but failed to update this range!
Thanks for spotting. I have edited.
Thanks Ed - that explains it. Given the wide annual variability of running 1 portfolio like this it does make sense to have more than 1 running each year. We can also get historic performance of QVM deciles and from guru screens so for me the value of model portfolios would be largely from the commentary and from a commitment to run them for at least 5 years say to give a better sense of long-term performance as the NAPS approach has provided.
Another interesting list. I can’t quite work out why Good energy is in this list but Centrica is not am I missing something?
Good Energy was ranked higher on the 31st December. Centrica is ranked higher today.
There's only room for 1 from the Utilities sector.
that explains it thanks
Well that certainly moved the prices of the smaller caps: Good Energy (LON:GOOD) Ingenta (LON:ING) Macfarlane (LON:MACF) Metals Exploration (LON:MTL) and Renold (LON:RNO)
Here are the charts for all 20 today. Open it in a new tab (right-click option on most browsers) to see it clearly.
Yes but look a little closer and you will see most prices have increased on very little volume which means that the market makers have basically put the price up as they expect more demand (Possibly becuase they are arware of their inclusion here?) they arent daft. Price increases on almost zero volume should be treated with upmost skeptism. I'll wait until the price settles if I decide to buy any of these smaller caps and if it doesnt go back down oh well I missed that chance.
My wife and I have had mixed results over the past 5 years by following a NAPS approach. Our track record would be 2 years at +20% each year and three years in which we've lost between -3% and -5%.
In 2023 we added an EPS growth requirement along with a dividend requirement. We've done + 0.53% this year - but we've also picked up an average dividend of around 4%.
In 2024, we've added manual intervention into the mix so, no longer "pure" NAPS.
We avoid shares such as Costain where margins are wafer thin. We look for CROCI of around 10% though it's not a hard and fast rule, which is why the criteria isn't added to the share selection screen. It comes up in a separate informational screen which, I am sorry to say I have built in a competitor's system. We also avoid shares where analysts are forecasting a drop in EPS (e.g. that would rule out Greencore). Reviewing the 2023 portfolio it was buying into shares where, at the time, there was a declining trend in analysts' forecasts of EPS that killed performance.
Our overall portfolios performed better than the NAPS variant at +5.3% and +7.03% with dividends on top. Neither is great when our financial advisor managed +14.2% on the part of our money he manages for us!
I believe launching a set of model portfolios across various investment styles would be a good idea. It would also be beneficial to review and possibly include quality scoring, offering examples for low, medium, and high-risk preferences. While it will need to be clear that this isn't financial advice, such guidance can be invaluable, especially for those just starting out (and even possibly for experienced investors). I remember wishing for this kind of structured insight when I began investing years back. It's not just about the investment itself, but also about learning and growing as an investor. This approach could significantly enhance the appeal of Stockopedia, drawing users for both its educational value and its guidance, steering them away from less reliable sources like dodgy bulletin boards.
What I am suggesting is taking NAPS to the next level.
Excellent work by Keelan Cooper.
I setup several model portfolios including a NAPS portfolio which had a disappointing 3.27% return. One of the best tho was an adaptation using QM with a near 20% return. One of Laurens Bensdorp systems I adapted for the UK produced better results at 5.66% but my US system based on his method produced over a 36% return (not shown)
As people are aware the 2023 NAPS didn't perform very well last year and it ended 2023 just above break even, which was disappointing.
What is interesting is..... if Ed had nominated his 2024 stocks selected for this years 2024 NAPS, but instead listed them last year on the 1st January 2023 in his 2023 NAPS, then last years NAPS 2023 would have ended the year up about +40%. My prediction is that 2024 will be a good year for NAPS.
David.
That's a good point - so much for the lower momentum-weighting then! :-D
Interestingly only one has negative relative strength against the FTSE All Share over the last 12 months, and all 20 have had a positive share price return.
Despite that, the median trailing P/E ratio is 7.5x - so it's quite a value and momentum list after all!
Hi Ed & team, thanks for a great write up. I use the Stockranks a lot and find them very helpful, but lately I’ve been wondering about he Quality scoring. Costain (LON:COST) for example does not appear to be a high quality business. It has paper thin margins (when it’s making money at all), revenue has been going sideways for years (with negative forecast for 2025) and share count has increased considerably over recent years. CashFlow compared to normalised EPS is ok but not stellar. I was surprised to see it scoring 92 for Quality. Without seeing the full algorithm I can only assume that the main driver is the positive net cash position and earnings manipulation indicators (presumably it is simple to read the accounts?). Anyway, I though I would flag this here as while I can see it scoring well on value (purely basis the low PE) I just can’t view this as a high quality stock.
Interested in your views and insights.
Regards and Happy New Year!
Jonny
Ed, I'd love the winners/losers view to be a feature of the Stocko product, I know you can make one without too much effort in a spreadsheet, but the service has so many cool infographics/charts to visualise the folio this one seems absent!
Maybe it isn't and I just need to look harder...
I enjoyed reading this piece Ed. The summaries were useful as I hold one or two in your list and the other companies create some useful ideas.
I was wondering if it would be possible to compile "sector stockranks" or whether these are already available? The reason is that some sectors may simply be more attractive fishing grounds than others and a sector stock rank would quickly make the point. For example, in 2023 investments in Computer game companies doesn't seem to have gone well (as I know to my cost) and also companies that deal in forex trading also seem to collectively be struggling. On the other hand the building sector seems to be on the up.
Thanks for all your efforts and the super videos produced in 2023.
Jim
Jim - we do publish the average StockRank for each sector in Browse > Sectors.
Personally, I think we could do a better job on sector analysis all round. It's on the improvements list!
The idea of model portfolios is a good one. I use all of your screens as a first base for further research, not as an investment recommendation.
I ended this year +3%. Not brilliant, but I'm plus 50% since 2016 year end, plus 100% since 2013 year end, plus 335% since 2008. So a small victory for a slow plodder. I am a relatively risk averse investor, who thinks a fair bit about asset allocation. My thoughts are turning back to the UK, having previosuly been biased towards S E Asia as a source of growth and dividends.
Managed or self administered portfolio ? We recently said goodbye to the FA in regards to my wifes SIPP, the tea and biscuits was always a pleasant way to spend a morning once or twice a year but they happily take their fee come what may. Fact is they do very little for it. My cousin was driving around in an Aston at 35, who was paying for that then !
Was he an IFA Mike ?
Fascinating article, thanks Ed.
Just one small point. When screening for stocks, I never use the bid/offer spread. This is because actual prices for small caps are nearly always well within the published spread, often quite near the mid-price. You can see this by putting a dummy trade into any online broking platform - it will nearly always show a useful "price improvement" compared to the published price, because market makers compete for business by offering prices within the spread. They are not obliged to publish those improved prices.
Regards, Paul.
Great point, especially to anyone who’s new. I never realised that for quite a while when I was new 4 years ago. It hindered me from hitting the buy button a few times, especially #CER I remember , which I got stopped out at £2.25 in a freak spike down, in early trading one morning.
I regretfully never went back in for this very reason.
I'm finding spreads are getting wider, in the UK market, especially on small caps. Some prices are outside the spread or you can't even buy or sell small amounts. All prices shoukd be within the spread unless you buying/selling a unusual amount. There is very little volume and maybe only 1 marketmaker. Of course, if there is bad news then the spreads tend to get even wider. Early trading the spreads are wider.In the US spreads tend be much smaller, around 0.1%
Paul
Do you subscribe to Level 2? I'd be interested to know your views on its value to an investor such as yourself or many of us.
Regards
FREng
Hi FREng,
"Paul
Do you subscribe to Level 2? I'd be interested to know your views on its value to an investor such as yourself or many of us."
I did subscribe for level 2 price information for quite a few years, when I was doing more trading in spread betting accounts. It can help time trades - eg. I found that watching the level 2 prices could show a turning point, if there are say 4 market makers in a share, and one by one they start to raise their bid prices. That can often be a good signal to nip in and buy some, as chances are that the price is heading upwards, and you can quite often recoup the bid/offer spread and be in profit by the end of day 1.
Also if you're dealing in SETS shares, it's quite fun to watch the trades and the order book prices in real time, and sometimes that can provide trading opportunities if you spot patterns in the trades.
These days I don't really bother with trading anywhere near as much as previously, so I found level 2 data wasn't really worth the money, and it's a lot more expensive now than it was before.
You could always try it out, and see if you find it useful. More for traders than investors though, I would say.
Regards, Paul.
Thanks, Paul.
I find it helpful to look at the current day chart on ADVFN's free app before making a trade, to see the up to date momentum.
FREng
Thanks Ed for your year end and new year start insights and NAPS commentary. I started investing at the start of Covid and did initially well in 2020 but lost most of my gains in 21 due to all the classics beginners mistakes. I realised I was too emotionally impulsive and generally inexperienced to be a stock picker when the market was not bullish, over traded and thought I knew a lot! Eventually I couldn’t sleep at nights when things got tough. I decided the NAPS was the way forward. I started the NAPS at the beginning of 2022 and this was my second year of it. The first year was pretty painful but, in the NAPS we trust, so Indid it this year with some rules of my own. I decided to sell anything that went 25-30% down or put out a poor statement, and bought in again using the same NAPS method. I ended the year 6.1% up and without as much pain, though it did cease to become non-admin. Now I’m using the NAPS as my base with my own twists. Only time will tell whether this be folly. I one thing’s for certain, it’s been a really tough 2 years to have started the NAPS and to keep the faith. Your articles have really kept me from throwing in the towel , so thanks!
Hi Stone, I started within the same time frame you mentioned and it has been difficult. Last year I did a NAPS and was about 1% up. Didn't stop out early enough on 2 or 3 choices. I'm going to do the NAPS again this year with about 50% or my portfolio. I'm happy to see that some of the naps from last year carry on into this year which will save some costs.
This the last day I can post this
VectorVest is closing its U.K. service. Their calculation of value is partly proprietary, partly Macro, based on bond yields, partly earnings-yield. On that basis the half-dozen stocks at the bottom are selling at a premium,
Furthermore the problem I have with a fixed date to renew a portfolio as per NAPS system is timing. Therefore BGEO, SNWS, RNO, GOOD,COST, CCC, RDW, VSVS, AAF were all available much cheaper in Oct-Nov.
I prefer a system of alerts for interesting stocks and add to the portfolio over the whole year, aiming to buy most when sentiment is negative.
STCM and CAML from 2023 naps, therefore now merit attention.
Great article! Interesting point on benchmarking against the 90+ stockranks, any plans to add that as a benchmark option in the folios? Be good to also add multiple benchmarks perhaps if possible at some point.
I run a large cap QM fund which has achieved 26.8% this year (2023) after purchase costs but excluding dividends. Simple rules - market cap >2500M, QM rank >92, risk rating not highly speculative. Before everyone copies it, 2022 was spectacularly bad. The 2 year performance is -1.5% and it is only just positive over 3 years.
Hi,
Apologies for a noob question.
What is the "Multibagger 2x2x2” screening framework".
Is it a screen or does it refer to the videos I've found in the past articles you've published.
Happy New year.
Mark
Mark - there's reference to it in the Multibagger content at various points.
I'll add the links later - am on my phone!
Unfair to judge this performance to professional equity funds where they have to follow too much regulation and not just blindly choose 10-15 stocks.
It is my opinion also that any portfolio performance should be compared with the 3 US major indices as they are the most liquid indices and have outperformed over the years.
Overall a very poor performance in 2023 compared to US ; a brief look in 2024 it looks like a portfolio that will not bankrupt its holder.
Thanks
Yiannos - not like you to be antagonistic... but here's the NAPS against the S&P 500.
Yes the US has done well in the last 12 months, and certainly a smoother long term ride, but you can beat the US in Uk stocks over the long run.
Not like me no!
My post clearly referred only to 2023 performance as very poor compared to the US.
Personal opinions but still appreciative of your work-I wouldn’t read it otherwise.
I can spot a very GOOD multi bagger in your 2024 portfolio ; I currently do not hold.
Thanks
On the subject of stop losses I do not suggest that they should be particularly tight as considered by Rusty and it maybe this only works on a drawdown year or perhaps a catastrophic loss on a share.
On setting an alert at 20% followed by action at say 25%, and then reinvesting the proceeds equally on your two best performers at that time, the result I calculated was quite interesting.
At the end of the year, it had mitigated nearly 90% of the losses of the 4 worst performing shares in the year and would have improved the overall performance of the portfolio.
stop loss when spread betting.
I had a terrible experience a few years ago. I had a small bet on gold ( a fiver), and put the stop loss very far away at 100, knowing gold does not move that much in one session. I was stopped out the next day!
I contacted the IG because the minutes charts did not go anywhere near it. in fact the price had dropped only $5 .
They went through the chart with me and for two seconds gold had traded at $100 lower and bounced back.
my opinion: Market Manipulation.
I never put stop loss playing gold again.
Hi Ed, personally I would be sorry to see the NAPS portfolio go but would also be interested in the construction of model portfolios based on investing styles. I’m probably just being greedy and am happy to just soak up all the fabulous content you and the team keep producing.
i hope you do do varied portfolios especially for income we are always learning something. have a good year
Great article Ed, personally I would be interested in the model's idea especially if one was investment trusts based say a 60% growth, 40% defensive portfolio, would be interesting long term to see how this did against the standard 60/40 of 60% S&P 500, 40% 10 Year US treasurys.
Regards
Andy
Hi Ed - thanks for the thoughtful article. A few comments:
1. The histogram shows frequency in the y-axis that doesn’t seem to match the ‘100 portfolios’ described in the title.
2. You might want to see what a portfolio with the average /median returns for NAP (90+) stocks from each of the 10 sectors looks like since the randomly selected portfolios may be affected by sectoral effects if some sectors have a lot more stocks than others.
3. Airtel - the forecast normalised EPS figures have been declining (partly due to Nigerian FX weakness) which perhaps offsets the momentum argument? - and the numbers in the financials table seem to disagree with the forecast EPS figures in the chart on its stock page - sometimes this is xx differences but I think both are in USD - which is correct? I’ve seen this a few times on other stocks - do you have a check to flag when these disagree so it can be investigated and why is it differ ent?
4. The model portfolio idea sounds interesting - worth showing the turnover though and thinking how this can be managed since this can be very high for some styles.
Regards
Steve
Hi Steve
Hi Ed and team. Another fabulous article with excellent insights. A few comments from me if I may:
1 . "This will be the 10th year of the NAPS Portfolio, and it may well be the last." I don't follow why you would change this winning formula. Please keep doing it. If nothing else it showcases Stockopedia brilliantly.
2. "We are thinking carefully about whether to launch a well considered set of model portfolios across a range of investment styles." This sounds a bit like investment advice and might alter the nature of Stockopedia?
3. You say Momentum is less to be favoured in a bear market - why is this though? If something has Momentum in a bear market isn't that good?
4. Finally my annual request - More Folios Please!! I
In a way, the NAPS is a model portfolio itself, so I don't think having a range of them would be advisory. I like to think of it as educational and illustrative. We may well continue the NAPS, but I've talked before about wanting to run a more dynamic, systematic portfolio perhaps in tandem with the passive NAPS (codenamed the RIPS "rank inflection point system" ;-) ) .
I do think for subscribers some more actively managed portfolios would be engaging and provide more discussion of interesting opportunities as they come up through the year. Certainly, the Staff Investment Club Portfolio was very popular and extremely beneficial for our internal team. HSBC pulled the plug on us unfortunately, but I'm keen to reincarnate this in some way.
Regarding a lower weight to Momentum, well it's based on some academic research. Momentum returns can have a tendency to invert on strong rallies from bear market lows. It's often the most sold off stocks that rally back the hardest, while the low volatility 'high momentum' stocks that have held up the most often lag. Hence QVM it is for 2024!
Hi Ed. Thanks for your reply. I see you dodged the More Folios request! Haha.
RIP would be a good acronym for my portfolio at this moment in time :) The rank inflection does sound interesting though.
Many thanks Ed. I have mentioned in another thread that I have 6 separate portfolios of which four are managed by professionals and two by me. The two I manage have far outperformed any of the others and the thanks for this are undoubtedly you , the rest of the brilliant Stockopedia team and of course the Forum contributors. Naturally, I do my own research but it’s a hell of a lot easier to do this when provided with the knowledge that Stockopedia provides .
So may I wish you and all Stockopedia staff and members a happy, healthy and prosperous 2024
Caper4 - that's terrific! Congratulations on that result in what have been immensely challenging market conditions.
I do think professional money managers work under significant constraints that we're free from as individuals. Many professionals do a sterling job given the assets under management and liquidity constraints. Running a hundred portfolios, or hundreds of millions is a challenging task. Of course, they can only manage those assets in relation to the size of the assets, rather than the opportunity set available to each underlying individual!
One of the biggest reasons for weaker performance from professionals is that they are compelled by your risk rating to include assets out with equities, even if their prospects are less favourable than equities. For example, if you come out as a risk 7/10 they will almost certainly include some absolute return (most of which have flatlined for a decade), fixed income via funds (even when interest rates were low and then rising (precisely not the time to be holding) and property funds (most of which have really performed poorly) Even if these assets classes just stay flat, you could have 30% of your portfolio, or more, effectively doing nothing. You, on the other hand, are probably almost 100% invested in equities and provided you make half decent decisions, should out-perform your stockbroker/financial adviser. Its not that they are not as good/clever as you, but the FCA regulations force them to run portfolios in this asset-diverse way, even when their is no investment merit; its all about box-ticking, ass-covering and insurance against world collapse.
Actually - those funds in that sector are all fully invested UK equity funds. Not life strategies etc - nor bonds.
UK All Companies: Funds which invest at least 80% of their assets in UK equities which have a primary objective of achieving capital growth.
why professional underperform?
Because of their various charges!
On the subject of stop losses which I raised with you in July this year, I take your point about the benefit for the downside but not being great for absolute returns.
I had a view that I might roll the proceeds into NAPS leaders to see if this issue might be mitigated. I appreciate it would change the whole balance of the portfolio.
Ed, I know that you do not agree with applying stop losses to NAPS selections. It is, however, my opinion that stop losses should be applied to all investments.
For 2023 I bought £5000 worth of all 20 of your NAPS selections, so £100,000 in total. I applied stop losses following your suggestion of greater stop loss percentages for higher risk shares. My results were as follows:
Central Asia Metals (LON:CAML) current price 180.8 sold at 193
Indivior (LON:INDV) current price 1185 sold at 1413
Keywords Studios (LON:KWS) current price 1662 sold at 1988
Netcall (LON:NET) current price 90 sold at 79.61
Steppe Cement (LON:STCM) current price 23 sold at 34.22
Telecom Plus (LON:TEP) current price 1612 sold at 1476
So in total I received £1653 more for the shares that I sold than I would have made holding until the present. Obviously two of my sales turned out to be premature, but overall the stop losses saved me money.
The greatest decline in a single share in this portfolio was Steppe Cement (LON:STCM) at 50%, but in some years NAPS shares have declined by an even greater percentage.
John - I use stop losses myself.
The published NAPS doesn't use them (as it's a long only, fully invested portfolio), but that doesn't mean they can't be part of a NAPS-esque recipe. I've often mentioned this in webinars.
Research shows that stop losses will reduce downside volatility, without necessarily increasing absolute returns. Sharpe Ratios tend to be higher when using stop losses. Of course you have to have a re-entry plan!
Hi Ed & team
Blimey the tenth NAPS, I remember clearly the first one. How time has flown.
Thank you for another excellent write up, I will watch with interest to see what this year brings.
Also, a big thank you to you and the team for the great work you do at Stocko, it is invaluable to me and a few of my investor friends.
I wish you all a happy New Year.
Regards
Howard
Interesting you have gone back to QVM, I will be selecting a NAPS based on QM and VM stocks. We can compare results in a year. The problem with VM stocks I found was finding 10.
I will exclude any over 500Bps spread.
I disagree about Ultilities, I think one of the best sectors recently, with Good Energy (LON:GOOD) Yu (LON:YU.) and Centrica (LON:CNA), all performing very well in 2023.
Re. Utilities - I know, there have been some good winners (as mentioned).
Actually the greatest winner for the NAPS over the 10 year period (in terms of nominal gains) has been a utility Drax (LON:DRX) !!! Drax has gone nowhere, up and down over the decade, but the NAPS has picked it up on several occasions and gained from the share volatility.
Nonetheless, the utilities and telco sectors are very small in the UK. So reducing the weighting is a bit more market reflective.
I've actually calculated the average gain across all 9 years for each sector holding. See below.
With hindsight, perhaps we should have underweighted Energy and Financials sectors. But that's hindsight bias !
Yes Ults before Ukraine did not do much, apart from good timing with Drax (LON:DRX).
I did do some studies on stop losses on Naps, the results were fairly mixed. Only 2022 would stop losses, have really saved you money and that was the worst year ever. A few years ago, when there was 4 stocks that went up around 150%, stop losses set at around 10-15%, would have taken you out of most of them. A 20% stop loss maybe of benefit. It really depends, if there is a market correction, early in the year. If you sell due a stop loss, do you rebuy if price goes up or buy something else?
Ed, I'm getting so many errors, trying to post comments, today.
A 10% stop loss is far too tight. For riskier shares, 25% is more appropriate.
Another year, another NAPS - please keep it going - it is a great benchmark and it would be wonderful to see how it plays out over the next ten years.
I'd also love to be able to model my own portfolios - can you could increase from 10 ?
Have a great 2024