Price-to-Sales: The King of Value Factors

So far, I have written about many of the well-known value ratios: Price-to-Tangible-Book-Value, 52-Week Lows and earnings-based metrics. However, one classic remains: Price-to-Sales.
Price-to-Sales studies
Although the academic finance literature primarily focuses on Price-to-Tangible-Book, Price-to-Sales has a long history among practitioners. For example, in his book, What Works on Wall Street, Jim O’Shaughnessy describes Price-to-Sales as the King of the Value Factors. And I can see why:
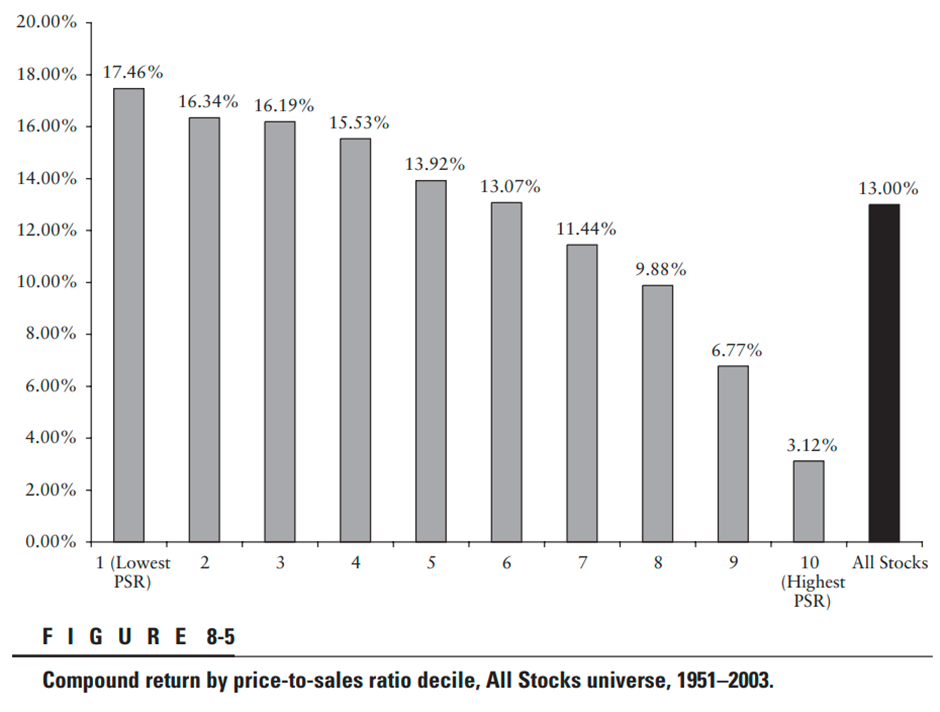
In his study of US stocks from 1951-2003, buying the lowest decile of stocks on Price-to-Sales generated more than a 17% compound return. Better than Price-to-Book, price-to-cash flow or Price-to-Earnings. Although, the differences were not huge, and more recent studies have tended to prefer earnings-based metrics for the best-performing lowest decile. What is noteworthy, however, is how badly the highest Price-to-Sales decile did. This generated just a 3% compound return, less than inflation for the period. In the same study, the highest Price-to-Earnings stocks also did poorly. However, they still generated a 9% annual return since this was a strong period for general stock market returns in the US. This is far more than high Price-to-Sales stocks managed. So if you want to implement a long-short value portfolio, Price-to-Sales may be the one to use.
The problem of high Price-to-Sales
Even if investors are not interested in such quant adventures, it is worth bearing in mind what a high Price-to-Sales ratio means for a stock. While a small company is growing revenue rapidly, investors can justify paying a high Price-to-Sales ratio. However, when it comes to larger and more mature businesses, it can often be a signal indicating overvaluation. One of the most famous explanations of the pitfalls of buying a mature company on a high Price-to-Sales ratio comes from a March 2002 Bloomberg interview with Scott McNeely. McNeeley is the former CEO of Sun Microsystems and was commenting on his own company’s valuation at the peak of the dot com bubble:
At 10 times revenues, to give you a 10-year payback, I have to pay you 100% of revenues for 10 straight years in dividends. That assumes I can get that by my shareholders. That assumes I have zero cost of goods sold, which is very hard for a computer company. That assumes zero expenses, which is really hard with 39,000 employees. That assumes I pay no taxes, which is very hard. And that assumes you pay no taxes on your dividends, which is kind of illegal. And that assumes with zero R&D for the next 10 years, I can maintain the current revenue run rate. Now, having done that, would any of you like to buy my stock at $64? Do you realise how ridiculous those basic assumptions are? You don’t need any transparency. You don’t need any footnotes. What were you thinking?
There are currently 10 UK stocks with a Price-to-Sales greater than ten and a market cap of greater than £700m, excluding REITs, VCTs, etc. These include some great businesses with some strong moats:

However, investors should be aware that by paying such a high price for these stocks, they are betting on these businesses having very significant growth potential, not just a competitive advantage. The 5-yr Sales CAGR shows that several of these businesses have struggled to grow rapidly in the recent past.
Take Auto Trader (LON:AUTO) for example:
When paying almost 25 times earnings for a business, investors are usually looking for EPS to be growing 20%+. However, in this case, the 5yr EPS CAGR is only 10%, and EPS growth is forecast to be just 6%. If their market-leading position doesn’t lead to significant EPS growth soon, then investors will generate returns below the general market rate by owning this stock. If profits fall or margins take a hit due to competition, investors will lose a lot of money. O’Shaughnessy’s study of investing in high Price-to-Sales stocks suggests that many of these high Price-to-Sales stocks will be terrible investments.
Value, GARP & Quality
Price-to-Sales is a popular metric for many growth investors. The reason is that it can be useful to assess companies that have yet to break into profitability and where other metrics can’t be applied. And it can be a very effective tool for identifying stocks with Growth at a Reasonable Price. However, this certainly won’t be the case for this value screen. Of the 1258 UK stocks with a Price-to-Sales ratio greater than zero (i.e. excluding stocks with no revenue or those that, via quirks of accounting, have negative revenue), the lowest decile of 126 stocks have a Price-to-Sales less than 0.33. The average growth rank is only 55, so this is not going to be a GARP selection.
The low Price-to-Sales stocks are also likely to have relatively low gross margins. The average gross margin of these stocks is just 24%. Logic dictates that if a company has high revenue and a high gross margin, the gross profit would also be a significant figure. This sort of company is likely highly profitable and unlikely to trade at a low multiple of that profitability. So this screen is not expecting to find companies that are quality compounders.
Screening Criteria
In order to narrow down this list of stocks via further screening criteria, it is worth thinking further about the nature of these stocks. This screen will likely pick up companies that are either going through a difficult period or undergoing a turnaround. Such companies may be loss-making in the short term, and I don’t want to exclude these since this screen will pick out companies that won’t be picked up by an earnings-based screen like the one I developed here.
In order to be successful investments, these companies need to survive the period of poor trading they may be currently experiencing. Normally, I would use a simple current ratio test. When looking for deep value picks, here, I stipulated a current ratio above 1.5. However, a number of the companies highlighted by this screen are retailers or similar businesses that operate successfully with negative working capital. A simple current ratio test would exclude these types of businesses, probably unnecessarily. The solution is to use one of the advanced screen rules for the Current Ratio and the Rank in Industry option:

Here I choose greater than 30% because I am not seeking the most financially secure businesses but excluding the riskiest ones.
I also want businesses with some chance of a turnaround in a reasonable time frame, so I demand that the 2-yr forecast EPS be greater than zero. This is a bit of a blunt tool that excludes some companies without brokers’ forecasts in the market. Investors can exclude this rule and directly assess the likelihood of a company recovering profitability in an acceptable timeframe if they prefer.
Finally, I apply a lower market cap limit of £10m to the screen since investors need to be able to buy the stocks, and tiny companies are likely to be very illiquid.
This gives a screen with 48 results:


Although not every company is investable, in my opinion, the hit rate from this screen is relatively high. Value investors looking for good value stocks going through some difficult times with the potential to recover could do much worse than simply buying this basket of these stocks. Because of this, I will skip the step I often do with stock screens of weeding out the uninvestable. In my next few articles, I will examine some of these companies in more detail.
[Disclosure: Mark owns shares in Driver (LON:DRV) Angling Direct (LON:ANG) SCS (LON:SCS) Wickes (LON:WIX) Halfords (LON:HFD) ]
Disclaimer
This is not financial advice. Our content is intended to be used and must be used for information and education purposes only. Please read our disclaimer and terms and conditions to understand our obligations.

7 comments
Sales to price ratio picks up a lot of retailors and utilities, i.e. low margin businesses. This is risky because you are in one sector.
Mark,
A timely article as the market favours Value opportunities currently.
Another Value measure you might like to consider is EV/FCF. Jim O'Shaughnessy’s son Patrick (now CEO) published a book called Millennial Money in 2014 based on more recent back testing and suggested screening for EV/FCF <10 as a good Value metric. This makes sense because EV measures a companies entire capital structure and FCF does away with accounting gimmicks.
Wes Gray (co-author of Quantitative Value) also backed FCF/EV (inverse ratio) when comparing various Value metrics, as if in a horse race. In a back test to 2015 he reported….
https://alphaarchitect.com/2016/04/update-on-the-valuation-metric-horserace-2012-2015/
What’s clear is that the different measures of Value may work well over long periods, but don’t work all the time. I have been using EV/FCF <10 for a few years and when combined with other metrics I have been impressed by the Value outcomes it identifies.
Nice article. Just (LON:JUST) seems to be a quirk of the data though: excluding TTM P/S of 34 I have it on about 0.3 P/S for both trailing and forward revenue. In fact, I'd put JUST squarely in a value bucket on many metrics.
Mark, just to say I have read a few of your articles, and I will have to take the time to read them all. They really offer a fresh perspective.
The screen result looks very good to me - I think there will be some big winners in there.
Although P/S seems a bit counter-intuitive to value investors (because it doesn't look at profits or cash flows), I think it can be useful for businesses which are temporarily break-even or loss-making as they don't look cheap on current earnings. P/S can then be helpful if one has a sense of where margins can get to in the industry / company - a low P/S ratio then coverts into a low P/E ratio once profitability returns to normal levels or management succeed in a turnaround.
Thanks Mark.
Price/FCF seems to be much more relevant.