Quarterly Update - QVM Portfolio

This is following on from a previous update I did on a paper portfolio I’ve been running since August last year. I’ve just put it through a second rebalancing and thought I’d share the results again. It is actually almost 3 weeks late to be honest but things have been busy at work and I’ve just not got round to doing it until now.
A quick recap…
Last time things got off to a pretty hairy start as I started the portfolio shortly before a market downturn in late August. Despite early losses, the whole thing came back later in the year to end about 5% up including the effects of dividends and transaction costs (commission plus SDRT where appropriate). Not bad for a period where the market was down about the same.
I concluded though that some changes should be made to the approach which, admittedly, had been thrown together fairly haphazardly. The changes were as follows:
- I decided to exclude Oil & Gas and Mining shares until things looked a little more positive in that space.
- I chose to remove the additional F-Score criteria for fear of double counting (though I am still sorting by F-score when picking my 30 stocks).
- I added in requirements of PB > 0 and PE > 6 to try and filter out companies with negative equity and ‘too good to be true’ valuation ratios. Not perfect by any means, but possibly better than nothing.
How did we do this time around?
Well, poor timing seems to be a theme on this one as shortly after rebalancing the market took yet another turn for the worse… For a couple of months the whole thing was highly volatile and I ended up giving up around half my gains by early February.
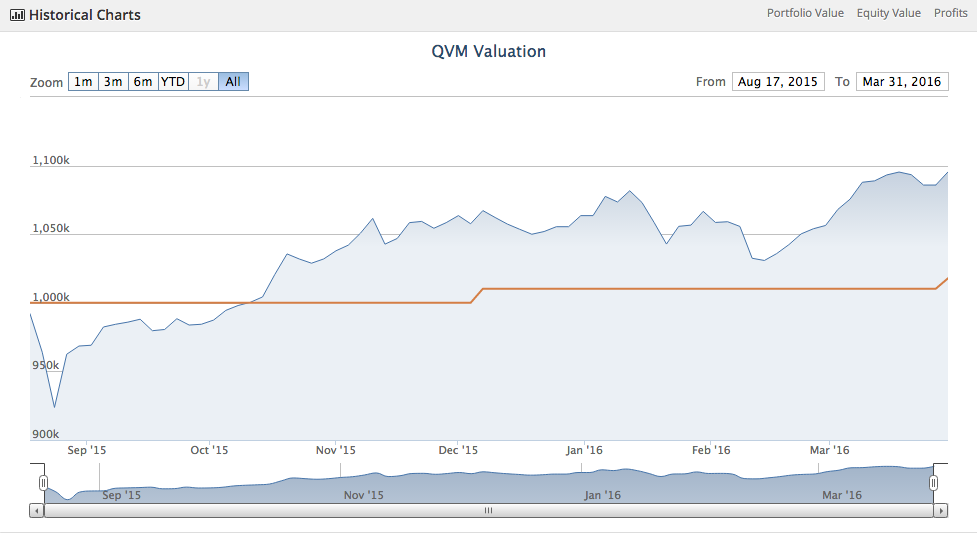
Thankfully, comebacks are second recurring theme here and the portfolio rebounded strongly with the overall market and ended at around a 9.5% gain since inception by the 30th of March. This includes the effects of dividends and, as always, transaction costs.
Here’s a look at the performance to date after selling all the holdings from this quarter:
And a look at the performance this quarter:
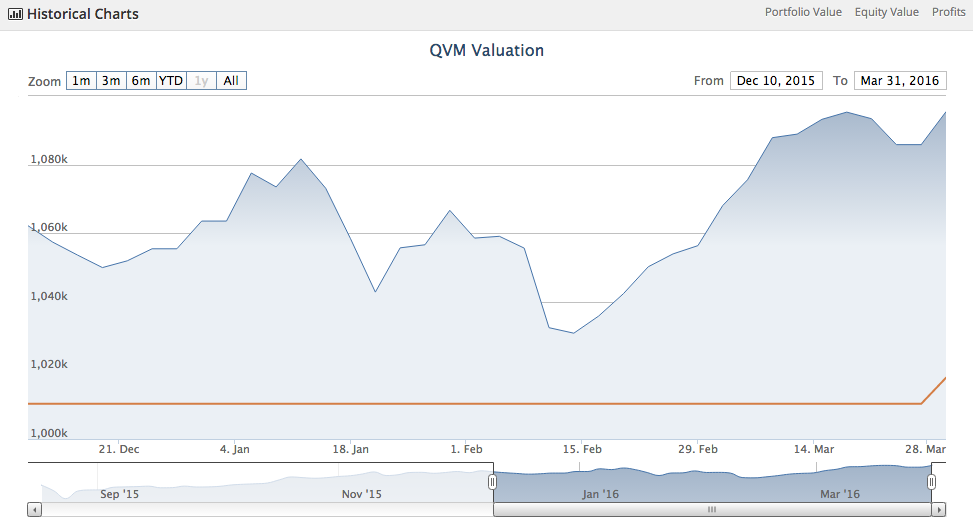
Note that the upticks in cash are me being lazy with dividends. I can’t be bothered to look up individual dividends and put them in so I just deposit cash equal to the portfolio yield divided by 4, multiplied by the valuation at the start of the quarter. If anything, this probably slightly understates the dividends received as it uses a low valuation point and the actual period was slightly longer than a quarter.
Since inception, the market is down around 5.8% while the folio here is up just over 9.5%. This means an outperformance of 15.3% so far, a result I’m quite please with and a little surprised by too.
Breaking it down…
So what did the performance actually look like this time? It was a little different to before with there being a few more losers than winners actually. Anyway, here are the losers:
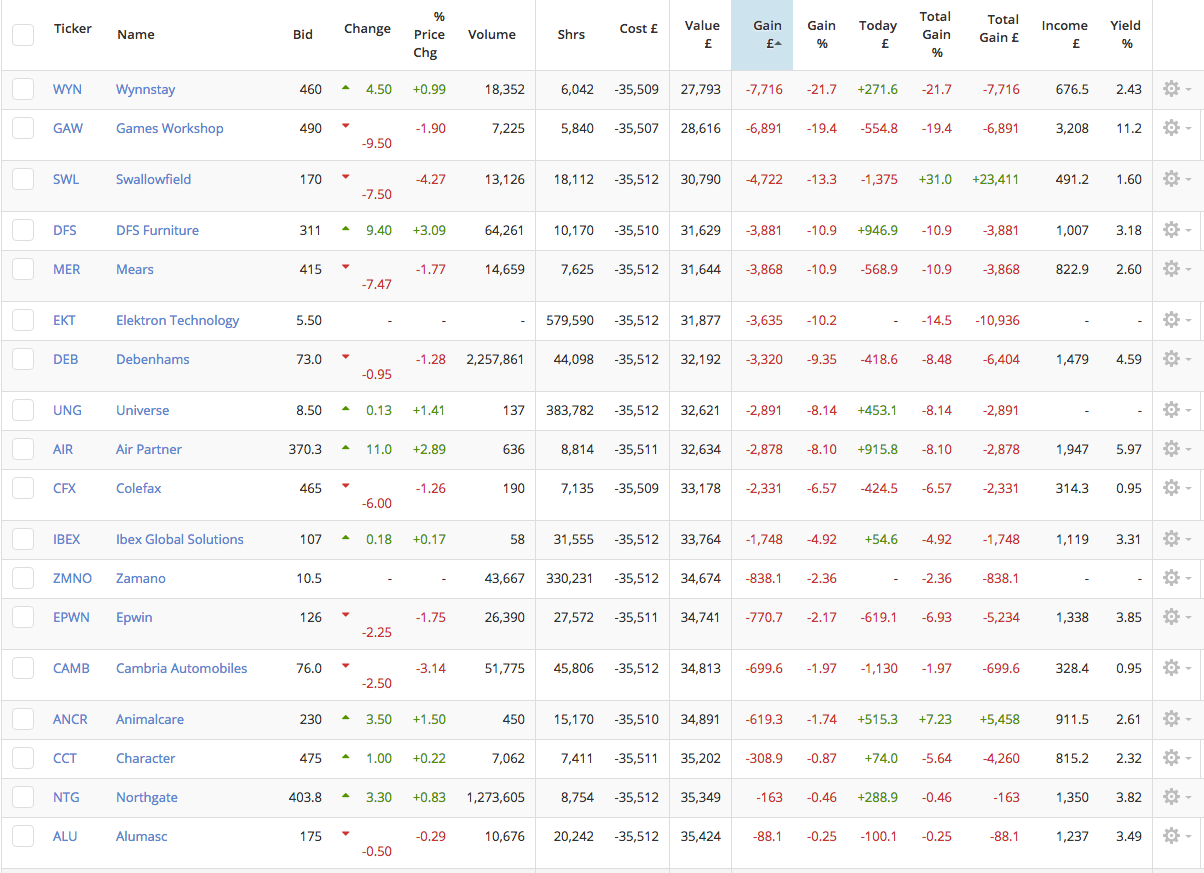
I count 18 in total, out of 30 stocks overall. This means that 60% of the stocks were bad, though you can see that most of these are down by less than 10%. There are just a couple of grim results near the top (Wynnstay and Games Workshop) that each lost about 20%. Nothing like last time though, where Volga Gas posted a 45% loss in just 3 months. Perhaps excluding poorly performing sectors helped, but it’s hard to tell with an isolated example like this one. Overall, the average loss here was -6.8%.
On the other side of things we have, of course, the winners:
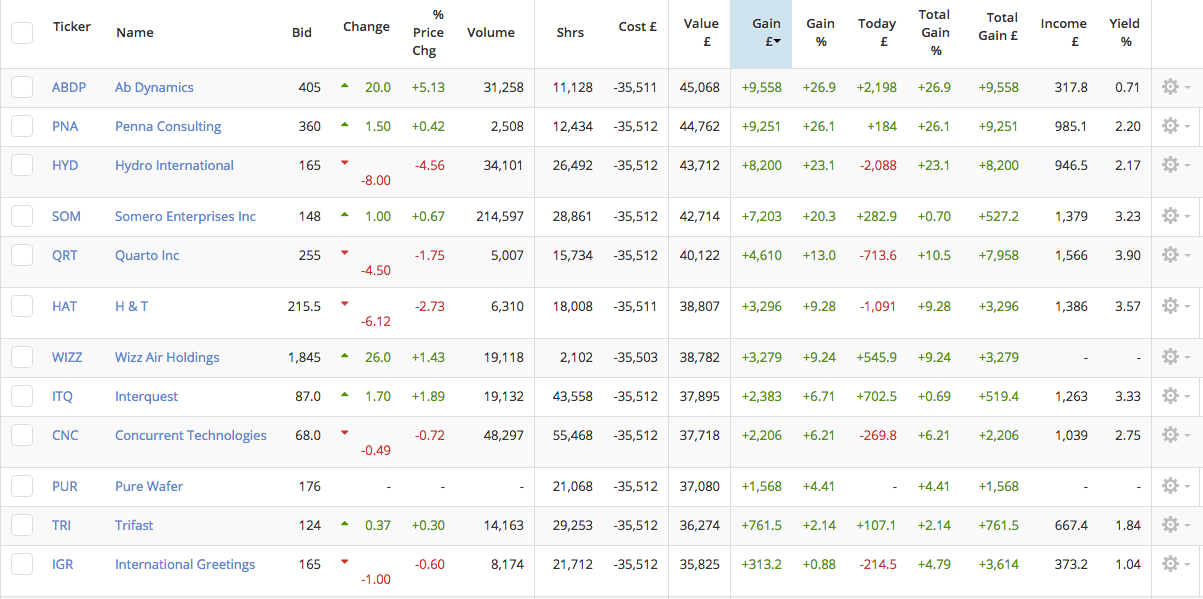
As you would expect, given that so many stocks were losers and that the portfolio made a gain, the winners performed quite well individually. 4 stocks posted gains of over 20% with the average gain being 12.4%.
Interestingly, a bad loser from before, Somero Enterprises, posted a gain of 20.3% this time - testament to the power of rebalancing. By rebalancing Somero back to an equal weighting when it lost out before, its reversion back has left the total gain/loss on the stock at a gain of 0.7% (seen in the ‘Total Gain %’ column). Had we not rebalanced, the 20% gain this quarter would not have offset the loss from before.
Going Forwards…
Things went quite well before so I’m mostly just going to leave them as they are. The only difference is I will include a control on the spread of stocks chosen, requiring it to be less than 400bps. I was stung by this on the rebalance last time and it’s an easy enough thing to avoid.
So, with that in mind, here’s a link to the new folio, rebalanced as of the 30th March, inclusive of commissions, spreads and SDRT of 0.5% for main market listings:
https://docs.google.com/spreadsheets/d/1L0YtZBJUOf...
I’ve include a simple calculation at the bottom to show roughly how much the rebalance cost. As a % of the portfolio, once you’ve factored in spreads, commissions, SDRT - the lot, it came to about 2.43%.
Now, it is worth remembering that I am using quite a crude rebalancing method here to save myself a little time. I am selling every share and then rebuying every share in the correct amounts so I am incurring two commissions and two spreads every time. In a lot of cases, there are some shares in there from before and in reality I would only need one transaction to sell/buy to get to the correct weight.
Spreads are by far the biggest contributor to trading costs in my calculations and trading twice effectively doubles costs. Stocks that required full replacing needed too trades anyway, so I won’t say that costs are double what they should be. They are, however, fairly significantly above what they might be had I worked out individual position adjustments rather than the quick and easy blanket approach.. Still, we get an idea of what the rebalance is going to cost over 30 stocks.
In conclusion…
All in all, as before, I’m happy with the results and I think anyone would be really over the past few months. Markets were volatile and negative overall, which I presume is what led to the majority of stocks being losers this time around. Still, the focus on exposure to fundamental factors helped to find enough great stocks that bucked the market trend and lead the folio to an overall gain.
Hopefully the next quarter will bring further good times for things here but we shall just have to wait and see. Good luck with your own investing in the meantime and see you in June!
Disclaimer
This is not financial advice. Our content is intended to be used and must be used for information and education purposes only. Please read our disclaimer and terms and conditions to understand our obligations.
6 comments
Yes I would like to know, Ab Dynamics (LON:ABDP) I thought was never rated that highly? Its a good performance in this market, much better than the dummy NAPS I have set up. Do you have the performance figures excluding dividends?
Hi Herbie,
Back in December Ab Dynamics (LON:ABDP) did have a StockRank in the low 90s, have a look at this old StockReport here:
http://reports.stockopedia.co.uk/133252620/gb/Ab_Dynamics_LSE_133252620_20151205.pdf
As the screen is sorting by F-Score, there is a good mix of StockRanks but all were above 90 in December.
Sure re the dividends - I have so far put in two dividend deposits of £5,500 and £7,612 respectively. This totals to £13,112. If we knock that off the (approximately) 1,095,000 valuation at quarter end that would come to £1,081,888 which gives a gain of about 8.2%. Thats a little harsh in my opinion as that includes all the transaction costs I've put in (SDRT, commissions and spreads) but doesn't count the dividends! Always better to be conservative with these things though as I'm sure you'd agree.
I'm quite surprised by the performance to be honest - it has been a bad market as you say. Just breaking even would be an achievement really at present. Personally, I think there's a fair deal of luck involved with a good short term performance like this one but I'm not complaining!
Tom
Thanks Tom. I did hold ABDP until recently, did not realise it went into the 90s. It will be interesting to see how this compares with NAPS selection method.
I'm not exactly sure how the rebalancing works, do just redo your screen and replace the ones not on it, as I see ABDP is no longer on it, if you run it now?
Yes its all about timing, some of your losers are my winners, Universe (LON:UNG), Cambria Automobiles (LON:CAMB).
The rebalancing was done very crudely - first I sold every single stock on the folio from before so that the portfolio was empty. Then I bought the top 30 from the screen ensuring an equal weighting for each. The effect is that I have removed all stocks not on the screen and brought all holdings to represent an equal weight in the portfolio.
I would not do this for a real portfolio of course, as it creates unnecessary transaction costs for stocks which are still in the screen. For stocks still qualifying for the screen I would calculate how much I had to buy/sell to bring them back to an equal weighting (3.33% of the total folio in this case) and then make that one transaction.
I went for a simple method like I outlined above though because, to be honest, its only a paper portfolio and I am a little lazy with it. Selling everything and then just working out the number of shares I need for each holding in the screen on a simple spreadsheet means I can blast through the whole process in about 20 minutes. I might start putting in a bit more effort going forwards though as I think I will keep the experiment going for a little while. That the portfolio has done alright despite my rough rebalancing tactics is quite remarkable!
Hope that helps,
Tom
thanks for this Tom was a great read.
how did you go about selecting your stocks? was it just picking up the top in the QVM ranks with some criteria filters?
Hi - the screen for the stocks this time round was this this one:
http://www.stockopedia.com/screens/qvm-67830/
I just picked the top 30 from that list! Very simple. In December the process was the exact same but I didn't have the spread requirement in there.
Let me know if you've got any other questions!
Tom