Riding the cycle - The Lassonde Curve

The Lassonde Curve, named after mining legend Pierre Lassonde, is a graphical representation of the life cycle of a mining company, from exploration to production. It is a tool used to understand the mining process and to potentially time investments properly. The curve outlines seven stages, each carrying specific risks and rewards, and as a company proves there is a mineable deposit in the ground, more value is created for shareholders along the way.

Source:Hedley Widdup - Lion Selection Group
Just to explain the above chart a little. The X-Axis is Time vs the left Y axis which is Risk and on the right is Value.
Higher up on the far left axis, this is when the highest risk exists. This makes sense because at the start when a company is drilling for a discovery it exposed to all the major risks of a mining company. Namely:
Exploration Risk
Technical Risk
Funding Risk
Commodity Risk
As time progresses, should each step of the mining process be completed successfully (explained below), the risks start to diminish until eventually if it is completely successful and Value is maximised, relative to the risk which remains which is commodity risk (and operational risk as well obviously).
But you will notice that as we move along the time scale (X-axis) and the risks diminish, the value line actually falls after the initial jump, before eventually resuming its upward trajectory once it makes its way through the mining process..
So what are the steps of the mining process? This is a very simplified explanation, but goes a long way to explaining the different stages of the Lassonde Curve.
Stage 1 – Concept: This stage carries the most risk which accounts for its low value. In the beginning, there is little knowledge of what actually lies beneath the Earth’s surface. Geologists put to the test a theory about where metal deposits are, using geochemical and sampling techniques to improve the confidence of this theory.
Stage 2 - Pre-Discovery: There is still plenty of risk, but this is where speculation hype begins. As the drill bit meets the ground, mineral exploration geologists develop their knowledge of what lies beneath the Earth’s crust to assess mineral potential.
Stage 3 - Discovery: Discovery is the reward stage for early speculators. Exploration has revealed that there is a significant amount of material to be mined, and it warrants further study to prove that mining would be feasible. Most speculators exit here, as the next stage creates a new set of risks, such as profitability, construction, and financing.
Stage 4 - Feasibility: This is an important milestone for a mineral discovery. Studies conducted during this stage may demonstrate the deposit’s potential to become a profitable mine. Institutional and strategic investors can then use these studies to evaluate whether they want to advance this project.
Stage 5 - Development: Development is a rare moment, and most mineral deposits never make it to this stage. At this point, the company puts together a production plan for the mine. They must secure funding and build an operational team. If a company can secure funding for development, investors can see the potential of revenue from mining.
Stage 6 - Startup/Production: The company is now processing ore and generating revenue. Investment analysts will re-rate this deposit, to help it attract more attention from institutional investors and the general public. Meanwhile, existing investors can choose to exit here or wait for potential increases in revenues and dividends.
Stage 7 - Depletion: Unless there are more deposits nearby, most mines are eventually depleted. With it, so does the value of the company. Investors should be looking for an exit as operations wind down.
It is important to stress here that the Lassonde Curve is not a strict sequence of events but rather a general guide.
Note: The prediction of a Lassonde Curve is not an exact science. Activities can be compressed, elongated, or bypassed, resulting in a sequence of events that is unique to each company. Further many companies have multiple activities and / or are captured/deal in M&A activity, therefore the full playing out of the Lassonde Curve never quite works to script. Also activities can be combined or bypassed to decrease the time of the overall cycle.
None-the-less, the Lassonde Curve goes a long way to explaining why price can often act in ways contrary to common thinking. For example, you will often hear an investor say, “The company has found the resource, and they expect to be producing in two years time. Why is the share price falling?”
The simple answer using the Lassonde Curve is that the stages of feasibility and development are often periods where the price of the stock tracks lower as there is still considerable risk with little immediate return. Whereas while the risk of going from nothing to a potential 30 year mine carries much risk and uncertainty, punters will jump in as the stock goes from nothing to potentially a hell-of-a-lot. That is why pre-discovery and discovery phases are viewed so favourably.
In short - the price just gets ahead of itself.
Case studies
As I alluded to, it is not just as simple as finding a mining stock and replicating the Lassonde Curve. Remember, first - this concept more relates to specific mining projects rather than businesses, and second - the normal course of activities is that most mining companies fail to make it all the way through the cycle - or they get taken over.
But below are a selection of stocks and how they have performed relative to the Lassonde Cycle.
IGO (ASX:IGO) (Formerly known as Independence Group) was a producer however it kept acquiring assets through the later 2000’s and the stock went up. Despite the continued positive news, the company saw a pullback on its price, in part driven by a pull back in Nickel prices, the other because investors got bought. But saw a subsequent recovery as they added the now flagship Nova project and assets sales saw may risks removed

Between 2006 - 2011
Gold Road Resources (ASX:GOR) (Previously known as Electra) made a discovery in 2010, subsequent to that the Gruyere was struck in 2013 via a regional targeting exercise and price returned to favour as the initial Central Bore discovery moved into production.

Between 2010 -2016
Bellevue Gold (ASX:BGL) in 2019 found the High Grade Gold discovery in 2019. Further infill drilling in 2020 meant further resources were identified. The company is now on the cusp of production to start in the 2H23.

A company presently in a Lassonde pattern is Sayona Mining (ASX:SYA) who in 2021 acquired a large interest in North American Lithium project and the Moblan Lithium project. The share price subsequently popped further supported by drilling success and a rise in Lithium prices. But since the price has come almost all the way back down. The company has just started production at the North American Lithium project plus a DFS is expected for Moblan in the next few months

2021 to possible future???
It is also important at this time than inthe majority of cases with mining companies they do not reach a successful outcome. Therefore don't assume the Lassonde Curve will play out every time. It won't in a company that is not successful. For example look at Navarre Minerals (ASX:NML) which called in the administrators yesterday. In that instance they had the initial pop following promising results from drilling at the Resolution Lode, located in the the North West of Victoria. But after years of disappointment and missteps, the company succumbed to its inevitable demise. It exhibited a pattern I find is far more common in mining stocks than the Lassonde Curve.
Its what I call the "Mount Fuji Pattern" - can you see why?
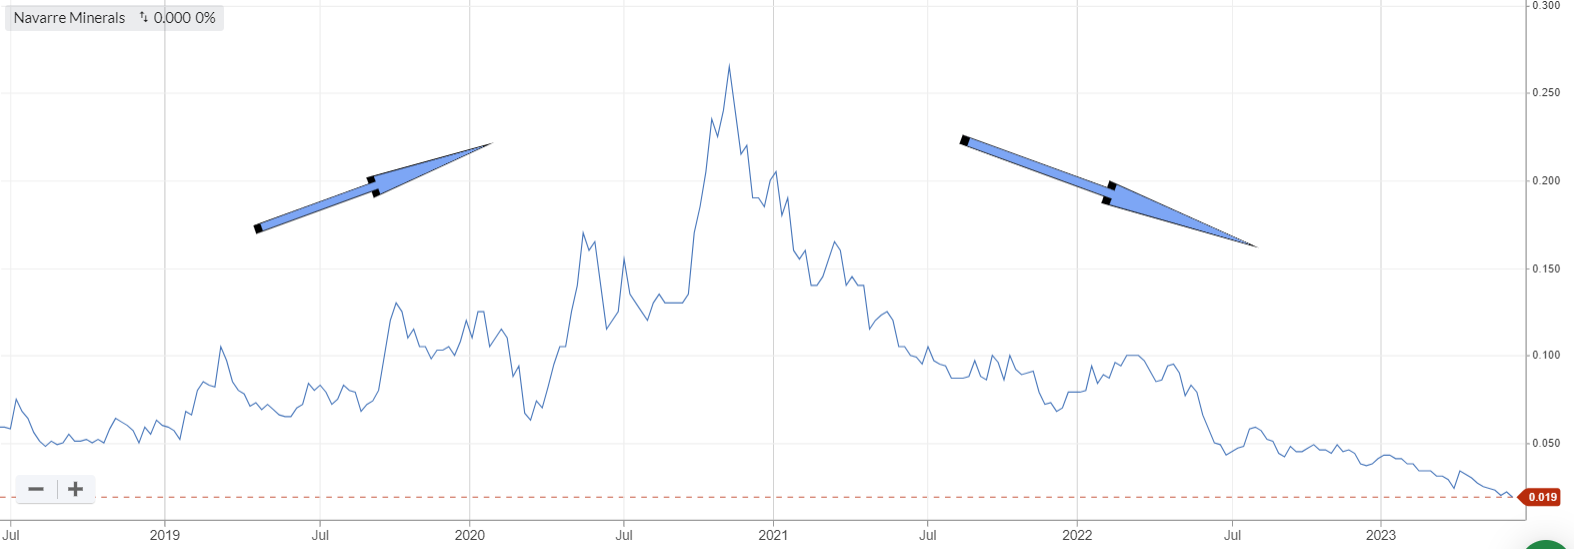
5 yr chart
Important Information: Stockopedia Ltd ABN 39 757 874 670 UK business registration number 0637267 (“Stockopedia”) is an Authorised Representative of Daylight Financial Group Pty Ltd ABN 77 633 984 773 (“DFGPL”) which is the holder of an Australian Financial Services Licence (AFS Licence No. 521404).
Information in this commentary is current as at date prepared unless otherwise stated. However, please bear in mind that investments can go up or down in value, and that past performance is not a reliable indicator of future performance. For more Important Information please refer to the Disclaimer section of this website.
This communication may contain general financial product advice. It has been prepared without taking into account your personal circumstances, and you should therefore consider its appropriateness in light of your objectives, financial circumstances and needs before acting on it.
If our advice relates to the acquisition or possible acquisition of a particular financial product, you should obtain a copy of and consider the Product Disclosure Statement (PDS) before making any decision.
The author holds interests in stocks highlighted specifically in the article: IGO, SYA. This position can and will change at any time without notice.
Disclaimer
This is not financial advice. Our content is intended to be used and must be used for information and education purposes only. Please read our disclaimer and terms and conditions to understand our obligations.
No comments yet
No one has commented here yet! Why not be the first one?