Screening for companies with the potential to deliver exceptional returns

Last year, I wrote about the process of finding companies with the potential to generate very high returns. Leaning heavily on the writings of Buffett and Munger, together with the 100 Baggers book by Christopher Mayer, I developed the following framework to identify such companies:
Moat
These are companies that have a sustainable competitive advantage. One measure of this is a high and consistent Return on Equity (RoE). For most businesses, competition means that RoE tends to mean revert to a company’s cost of equity. However, for the exceptional company, competitors have been unable to deploy additional capital to eat into a company's high returns, and the RoE remains high. It is even better if investors can find an investment where the RoE has trended upwards. Such a company may have been digging an even deeper moat to keep competitors out.
Runway
A moat is a great thing for a company to have, but if there isn’t scope to deploy additional capital at very high returns, the business will always remain niche. That doesn’t mean it will be a poor investment. Many such businesses generate a very nice profit that they return to shareholders via large dividends or share buybacks. Somero Enterprises (LON:SOM) could be considered such a business (unless some of its new innovative products gain significant traction in the industry.) For investors to receive phenomenal returns, a company requires a significant growth runway ahead of it.
Operational Leverage
A strong moat and significant sales growth alone can generate great profit growth, which may be reflected in the share price. However, the returns will be even higher if the bottom line grows faster than the top line. This is known as operational leverage. This happens when costs are relatively fixed. Many investors look to invest in high-margin business. Counterintuitively, Mayer found that the best returns came from businesses with high gross margins and low net margins. The reason is that the market may have overlooked the impact of sales growth on a business with high gross margins but where admin costs may remain relatively fixed.
Cheap
Mayer found that the best returns came from investing in companies where sales grew quickly, profits snowballed, and the multiple the market gave those earnings also increased. Multiple expansion is far more likely when investors pay a low multiple when purchasing a stock. Many quality investors overlook this particular aspect of investing and are willing to always pay up for great businesses. However, the last two years have shown the folly of this approach, as many former quality darlings have seen their share prices collapse. For example, Focusrite (LON:TUNE) , which I wrote about here, peaked at over £17 in 2021 but is trading at under £5 today. In contrast, the current weakness in the small cap markets means that investors deploying capital today can buy high-quality UK companies cheaply, stacking the odds even more in their favour.
Although this framework is relatively sector agnostic, investors do need to be careful with professional services businesses. These often have a high Return on Equity as they are capital-light businesses. And, of course, they tend to serve large markets, so they have a significant runway. However, they cannot grow their business without hiring more staff since these are the real assets of the business. The staff know this, so they demand the lion’s share of any returns the business makes. The market knows this and often gives this type of business a low multiple. So, on the surface, they can appear to meet the Buffett/100-Baggers high-return framework. However, in reality, they lack operational leverage and are unlikely to be re-rated by the market. They can be suitable investments in certain circumstances, but the chances of being the next multi-bagger are low.
Screening for exceptional companies can be tricky. However, there is a metric which captures aspects of both moat and operational leverage which is useful: Gross Profits to Assets (GPA).
Gross Profits to Assets
In 2013, Professor Robert Novy-Marx wrote an academic paper suggesting investors should add a new metric to their arsenal. Here is his summary:
Profitability, measured by gross profits-to-assets, has roughly the same power as book-to-market predicting the cross section of average returns. Profitable firms generate significantly higher returns than unprofitable firms, despite having significantly higher valuation ratios. Controlling for profitability also dramatically increases the performance of value strategies, especially among the largest, most liquid stocks.
Choosing gross profits rather than measures from further down the income statement has several advantages. Firstly, gross profits are harder to manipulate. These days, the word “adjusted” can appear hundreds of times in a company’s annual report, making comparing earnings between companies increasingly a matter of opinion. While gross profit is not always identically reported, it is far less open to interpretation or manipulation.
Secondly, Gross Profits to Assets is mathematically related to two key measures of quality: Asset Turnover and Gross Margins:
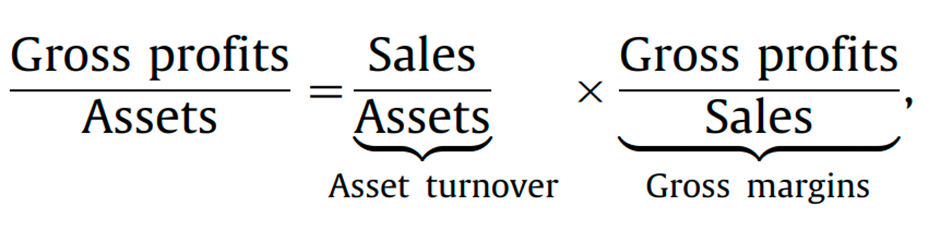
Gross Margins are well known as a measure of potential moat. Selling a product for much more than it costs to make is a sign that not every company can copy the product.
Asset Turnover measures how effectively a company uses its assets to generate sales. By using Gross Profits to Assets, investors are finding efficient, capital-light companies that likely have a significant competitive advantage.
Here is what Novy-Marx says about the results of his study:
Gross profits-to-assets is a powerful predictor of the cross section of returns. The test-statistic on the slope coefficient on gross profits-to-assets demeaned by industry is more than one and a half times as large as that on the variable associated with Value and almost two and a half times as large on the variable associated with Momentum.
In layperson’s terms, GPA works better than Value and Momentum at generating quantitative investment outperformance. Unlike Momentum, these excess returns last for a considerable period, meaning that portfolios require less-frequent re-balancing:
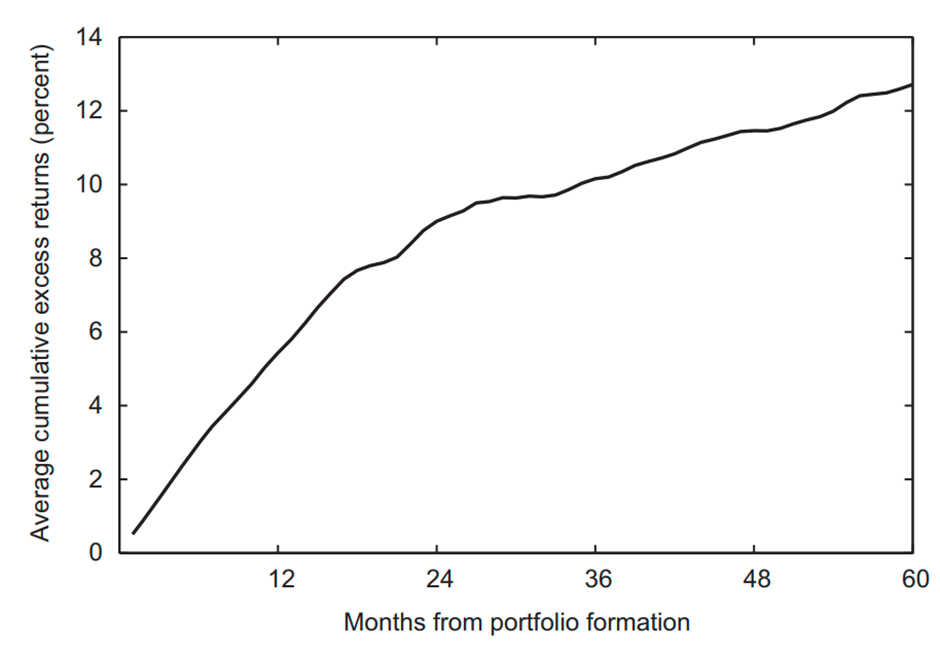
This makes it a powerful tool in an investor’s armoury for finding long-term winners. In addition, GPA works as a good complement to Value, so investors are best using these measures together. By using a GPA + Value screen, investors are getting three-quarters of the Moat, Runway, Operational Leverage, and Cheap multi-bagger framework. Only Runway requires a more qualitative assessment.
The astute may realise that the idea of buying high-quality stocks cheaply has been around for a while. Indeed, this is the concept behind Joel Greenblatt’s Magic Formula. However, subsequent to Greenblatt popularising this idea, Wes Gray and Toby Carlisle showed that all of the Magic Formula’s outperformance (and more) came from the Value metric. The quality metric he chose, a form of Return on Capital, actually reduced the returns investors received. So, while his implementation has been shown to be faulty, the concept is sound; he should have just chosen GPA as his quality metric instead.
The Screen
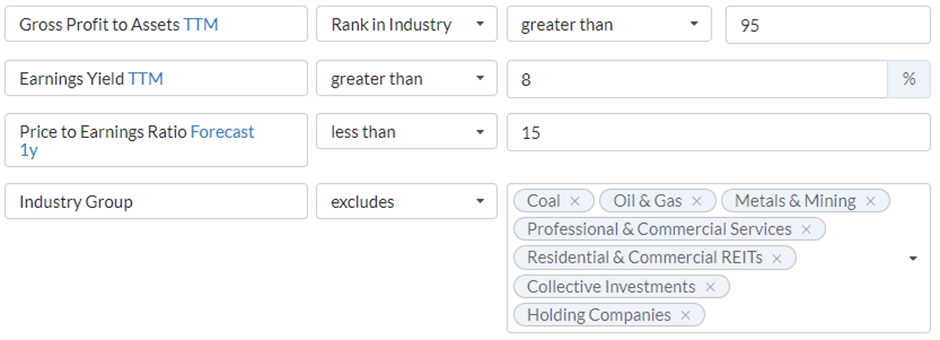
Gross Profits to Assets – Rank in Industry > 95
Novy-Marx found that GPA works best when it is industry-specific. This is because different industry characteristics may give a considerable variation in results. Hence, I use the Rank in Industry to give many possible ideas. However, I want the very best companies as measured on this metric, so I select only those with a rank of 95% or above.
Earnings Yield > 8%
Earnings Yield is, of course, EV/EBIT. I prefer this as a measure of Value for two reasons. The first is because it considers the capital structure by using Enterprise value instead of Market Capitalisation. The second is that when Gray & Carlisle measured the performance of all value metrics, this came out top. 8% is roughly equivalent to a post-tax P/E of 15, hence why I chose this figure. I want reasonable Value, but I am not after the “cigar butts” with this screen.
Price Earnings Ratio 1-Yr Forecast < 15
There is no forward earnings yield calculation to screen against, so I include this forward P/E test to avoid companies that had a good year last year but earnings are forecast to drop off a cliff. Similarly, a forward P/E of 15 is a reasonable value figure.
Industry Group Excludes: Coal, Oil& Gas, Metals & Mining, Professional & Commercial Services, Residential & Commercial REITs, Collective Investments and Holding Companies
This may be a lot of industry groups to exclude. However, this screen works best for trading companies, hence excluding all industry groups that don’t tend to contain these. I am also excluding professional services for the reasons outlined above.
The Results
The screen currently gives 30 results:
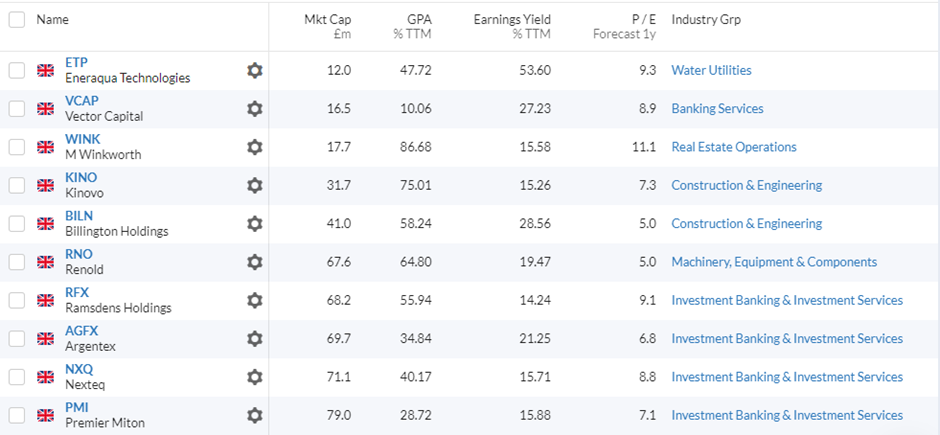
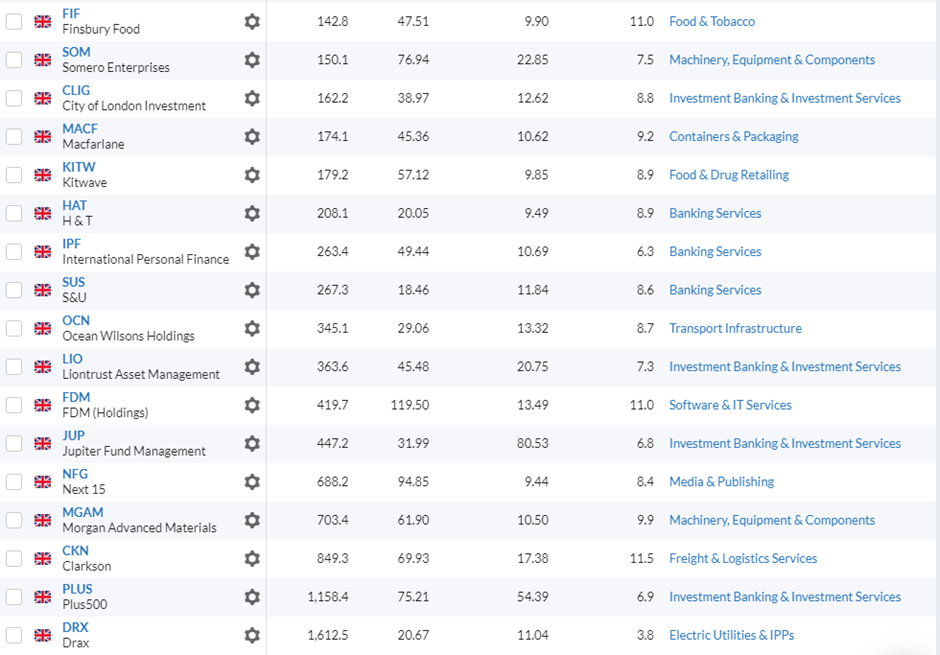

These results may be a little surprising. However, that is the whole point of screening: identifying candidates for further research that investors may not have considered before. For example, everyone knows that Spirax-Sarco Engineering (LON:SPX) is a decent company. However, it is on a forward P/E of 25 and has only compounded EPS at 9% over the last five years. The opportunity for the quality investor to profit from Spirax-Sarco seems long gone.
In contrast, investors may not have realised that something boring like packaging distributor Macfarlane (LON:MACF) has an EPS CAGR of 13% over the same period and is on a forward P/E of 9. Or that a large cap such as GSK (LON:GSK) , with some significant moat-like characteristics, is also on a forward P/E of 9. At the other end of the scale, investors may have written off a company such as Eneraqua Technologies (LON:ETP), whose share price has collapsed since IPO, missing that this has some quality characteristics that may make it worthy of further consideration.
Not all of these stocks will turn out to be big winners. That is the nature of stock screening. However, they all have quality characteristics, as identified by their sector-leading Gross Profits to Assets, and all are reasonably priced (if current brokers’ forecasts are to be believed). This certainly makes them worth a second look.
[Disclosure: Mark owns shares in Liontrust Asset Management (LON:LIO) Somero Enterprises (LON:SOM) Billington Holdings (LON:BILN) ]
Disclaimer
This is not financial advice. Our content is intended to be used and must be used for information and education purposes only. Please read our disclaimer and terms and conditions to understand our obligations.

11 comments
How do you call up rank in industry for gross profit to assets? Doesn't seem to offer me the option...
Cheers.
Hi flyposter,
It is an "advanced rule":
Hope that helps,
Mark
Eneraqua Technologies (LON:ETP) I don't trust the management. Did you see the profit warning they put out last May? Highly disguised, very misleading. I also saw some of the video that Tasmin did, put me off even more. So a bargepole stock for me. Can you invest in stocks when you don't trust the management?
Macfarlane (LON:MACF) I have held in the past but the share price goes sideways.
I do hold Somero Enterprises (LON:SOM) but it has not done so well.
The problem with Clarkson (LON:CKN) is most of the cash, £225m, is due to paid out in bonuses, pity as it is a decent company.
(LON:SOM) - Somero is cyclical share moving in general with the state of the construction industry, which is depressed at the moment. It's a good company and should do nicely when construction picks up. I hold.
I'm not sure it looks particularly cyclical to me, unless you assume that economic conditions have been brilliant for the last decade or more:
That said, they clearly can't re-invest capital at anywhere near their current RoE, so secular growth won't be stellar going forward. Like you, I think this concern is more than priced in, though.
The share price looks cyclical to me. It has halved twice in the last 4 years. Construction is a cyclical sector. Yes there was a good run up until 2020, when we had Covid start.
The fact that the share price of Somero Enterprises (LON:SOM) has indeed been cyclical over the long term illustrates the dichotomy between share value which is what most screens look for and Stocko's "V" algorithm calculates and valuation which is how the market perceives a share. If you don't have an instinct for identifying valuation cycles and predicting future valuation with some degree of overall success your portfolio will have too many "good" shares which were bought at the wrong time and it will lose money. That's why I think that all investors who want to build their own porfolios by share picking have to be good at timing and trading, even if their trading interval is lengthy. If you're not willing to have a trader's mentality you ought really to give up share picking and buy either trackers, ETFs, or investment trusts.
The chart below shows Somero's share price since listing. The blue lines are a Raff Regression Channel. Investors who have held since listing have probably had reasonable results when you take dividends into account, but those who bought at the wrong time in the two huge cycles have done badly. Traders who got the two big cycles right will have made a lot of money.
Thanks Mark, very interesting. Gross Profits to Assets is a new concept for me.
Thank you MArk - a thought provoking article.
I guess that there are alot of Investment banking & Investment Services because a large % of their costs are in staffing and therefore have a high gross profit margin - similar to professional services firms
You're welcome.
I think that is partly true. I certainly consider Argentex (LON:AGFX) in that category, as would I any actual investment banks if they happened to appear in this screen. However, the spread betters, such as IG group (LON:IGG) , don't require significant staff additions to scale. The fund managers, in theory, have operational leverage. However, in practice, they have bonuses to retain "star" fund managers, so they are probably somewhere in between. There is enough variety in these types of businesses I didn't want to screen them out automatically.
Agree as likewise H & T (LON:HAT) and Ramsdens Holdings (LON:RFX) fall within banking sectors but hard to firmly pigeonhole either, given their wide spread of services including retail.
A very interesting article for subscribers further exploration thank you Mark, especially chimed with the Multibagger webinar this evening.