Screens to find stocks during the coming cooler days

With winter on our doorstep down south in Melbourne I will have plenty of time to spend indoors. Rather than watch the idiot box, I would rather use my time productively to find some stocks that perhaps I have never heard of before, but require some focus and attention.
The best way to do this is by running screens in Stockopedia to find a shortlist of companies that meet particular traits that I can investigate further. Unlike the Folios where its functionality is dependent on the stocks I identify and record, with the Screens tool the opportunities are presented to me irrespective of my biases or prior knowledge based on the criteria I select.
A screen is not the final step… it is the first.
First thing I just want to articulate is that I never run a Screen and buy a list of stocks blindly.
To use a Property analogy, I don’t buy houses ‘site unseen’. Rather I would prefer to have a list of properties presented to me and then I inspect and assess each on their merits.
The Screen Tool works in exactly the same way. You will have a list of potential assets presented to you in a matter of seconds, and you can then decide through a process of elimination which stock more closely aligns to your own personal investment objectives and tolerance to risk.
In this contribution I am going to discuss a few screens that I have built that identify certain styles of stocks. If they resonate with you, feel free to use them.
Best of the Growth Stocks.
This was a screen that a great mentor of mine, Simon Blair, developed. Simon taught me alot about making money - be it in his actions or his wonderful little quips.He was the living embodiment of making money in the market using your preferred way, provided you know what you are doing and can be disciplined about it.
He was a big fan of using screening tools to find opportunities. He would often say, “You only have to identify one stock that doubles and you have paid for your research service for life.” He was also a great leveler when the audience would ask him to break his focus by showing other features or investing concepts, his answer would always be, “Let me show you how to make money first, and then you can worry about counting it.”
Simon was sadly taken from this world far too early. I often run this scan to get a measure of some of the stocks he would have been looking at today from a Growth perspective.
Criteria:
Quality score greater than 70
EPS Growth TTM greater than 24
ROA TTM greater than 8
ROA 5y avg less than 100
Operating profit growth greater than 20%
Market Capitalisation greater than $100m
Explanation:
We are looking for stocks going through an aggressive growth cycle. Simon would normally have used an Altman-Z score style calculation in his scan, but as our Quality Rank includes it, plus other measures like earnings manipulation and health trend, he would have likely used that.
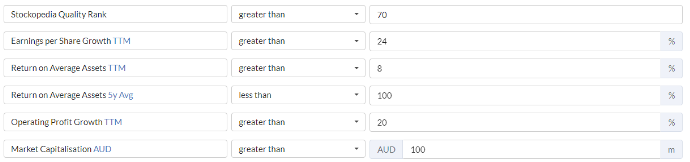
EPS, ROA, Operating Profit Growth and Market Capitalisation are self explanatory. But why did I insert the 5yr average as less than 100?
In this instance, I just wanted the column to appear so I entered a high watermark and selected “less than” so all the data would appear. This is a concept I discuss further below.
Simon always wanted to find stocks that were growing their Return on Average Assets (ROA) so he would compare the current ROA with the 5yr average in the results. Simon used to especially like to find stocks that have had a negative number most recently but were now profitable.
At the time of writing, the Screen above returns 48 results. If you exclude companies where the TTM ROA is lower than the 5yr avg, the list is reduced to 38.
He would run this scan regularly, particularly around reporting season. He would know beforehand the existing stocks that the Screen returned and subsequently ignore them. Why? Because what he wanted to identify was new stocks that had just come onto the list following the release of their latest financials. Stockopedia is a particularly powerful tool around earnings season. If you are not that into your stocks, try downloading the list after reporting season as an excel spreadsheet so you can compare it in 6 months time.
Earnings turnaround
Keeping with the theme of companies that were loss making entities but are now profitable, I often run a screen to identify just that. Again this screen is particularly useful around reporting season.
Criteria:
EPS TTM greater than 0
EPS Prior TTM less than 0
Market Capitalisation greater than $100
Explanation:
We really want to see a company that has been a consistent loss making entity. But has now turned profitable. We then need to do our research as to whether that rising profit trend can continue. In the example of MMA Offshore (ASX: MRM) below, you will notice the sea of red earlier, but the black numbers now (and forecast as well)
This is a high risk filter and investors should know that there are plenty of “flash in the pan” style results, like mining stocks who may sell one of their entitlements and receive a once off boost to revenue. These are not the types of stocks we are looking for.
So though this filter brings forward companies that were making losses but are now profitable (86 at the time of writing this article), you still need to do your research to determine if it is sustainable.
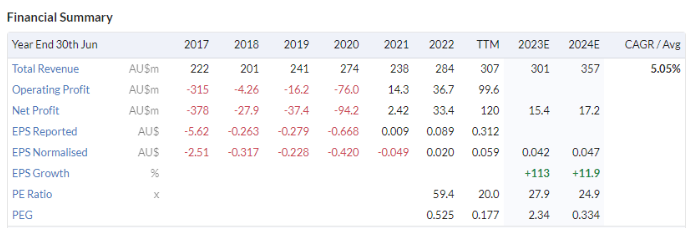
Sample of the financials we want to see. Note the long history of red, but most recently the numbers have turned black
Expected earnings turn around
Similar to the above, this time we will focus on companies that are loss making now but analysts expect earnings to be positive next year
Criteria
EPS TTM less than than 0
Forecast Earnings per Share greater than 0
Market Capitalisation greater than $100
Explanation:
As we use forecasts, this scan relies on a company having analyst coverage, so you won’t find too many small companies here. What we are really trying to identify are stocks that historically have had negative earnings, however due to business growth etc they are about to crack it for their first profit. Our job as investors then is to find the ones that are likely to remain that way.
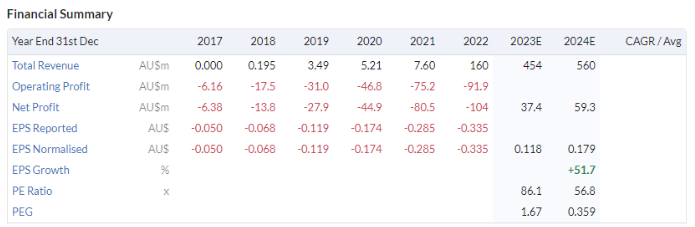
Sample of the financials we want to see. Note the current numbers and history are red. But the forecasts are black meaning expected positive returns are coming (if analysts are correct)
Small cap dividend payer
Everyone knows the banks and big miners pay nice dividends (you don’t need a research service to tell you that). But scratch a little deeper and there are a stack of smaller stocks (less than $1bil mkt cap) that also do the same.
This scan is designed to present those stocks to you for further research and consideration
Criteria:
Dividend Yield greater than 5%
Dividend cover greater than 1
Market Capitalisation less than $2,000m
Explanation:
Here we are looking for stocks outside of the well known names (mkt cap less than $2b) with a yield of 5% or more and earnings that cover dividends at least one time over (making dividends more sustainable.)

I have chosen not to include dividends per share growth forecast 1yr greater than 0 because by doing so I reduce the list from 100 to 27. While that is because some dividends are expected to go backwards the majority of the reduction is due to the fact that many smaller caps don’t have analyst coverage and therefore no number is recorded
The other thing to note is that many of these stocks will often have seen price falls. The reason being that dividend yield is a function of price. That is, as the price of a stock goes down, the dividend yield goes up and vice versa. The higher the yield you seek, the more likely you will find a stock that has gone backwards.
The other reason why these stocks often don’t ‘fly’ is because by choosing to distribute profits rather than re-invest them into the business, this theoretically slows down business growth potential and therefore these stocks are often ignored.
But sometimes you will find real gems that pay a high yield AND are growing, which is why for these stocks the majority of my extra research time is then spent on trying to determine the growth prospects of a company. If the company keeps growing, the dividend will look after itself.
Easy way to find criteria
There are hundreds of criteria spanning different time frames within the scanner, and to scroll through each in search of a specific rule is time consuming.
Some members may not be aware but there is a search function at the top of the Select Metric entry box. Simply type what you are after and the selection of possibilities is whittled down to a much more manageable list.
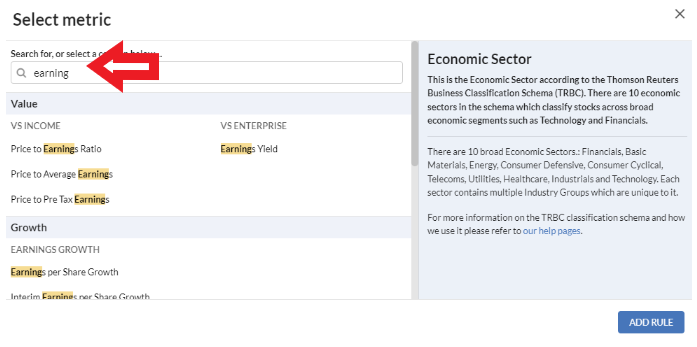
One final tip: Using the Relative Strength scan criteria
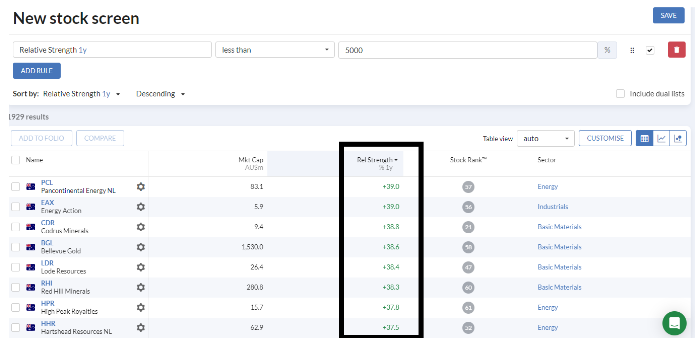
I really like this criteria and I add it to virtually all my scans. So what is it? This measures the stock’s performance vs the market (All Ords Index) for a set time period - I usually use one year.
I like to see it because I can quickly glance to see whether it has done better or worse than the market. In order to make this criteria appear as a column populated with data, however without actually filtering on it, I select:
Relative Strength 1yr less than 5000%
Using a nonsensical amount means that I capture everything. So that way a positive result of 200% (the stock has risen 200% higher than the market) or a negative result of -50% (the stock has done 50% worse than the broader market) will be captured and therefore displayed in this filter.
Conclusion - A little secret
Though I used the upcoming Winter in my introduction as a reason to stay inside and to use the Screen tool to look at stocks, if I was brutally honest, I should mention I actually do the same in summer! So have fun playing around with the Stock Screener and let your imagination run wild!
Important Information: Stockopedia Ltd ABN 39 757 874 670 UK business registration number 0637267 (“Stockopedia”) is an Authorised Representative of Daylight Financial Group Pty Ltd ABN 77 633 984 773 (“DFGPL”) which is the holder of an Australian Financial Services Licence (AFS Licence No. 521404).
Information in this commentary is current as at date prepared unless otherwise stated. However, please bear in mind that investments can go up or down in value, and that past performance is not a reliable indicator of future performance. For more Important Information please refer to the Disclaimer section of this website.
This communication may contain general financial product advice. It has been prepared without taking into account your personal circumstances, and you should therefore consider its appropriateness in light of your objectives, financial circumstances and needs before acting on it.
If our advice relates to the acquisition or possible acquisition of a particular financial product, you should obtain a copy of and consider the Product Disclosure Statement (PDS) before making any decision.
Disclaimer
This is not financial advice. Our content is intended to be used and must be used for information and education purposes only. Please read our disclaimer and terms and conditions to understand our obligations.
2 comments
Thank you Elio. Very interesting, clear methods, with great potential
Nice filters Elio, they are really interesting ways to view potential investments.