Semi Year SNAPS 2021 - as long as the music plays, we dance

What a six months it's been for the NAPS Portfolio - the "bold bets on Big Mo" that I described at the start of the year have paid off. I'll go into the performance in detail shortly, but the portfolio has rocketed by 160% since the Covid crisis lows and has managed a 68% return in the last 12 months alone.
A NAPS recap...
For new readers - the "no admin portfolio system" has been running since the beginning of 2015. It's a very simple, systematic process that selects the top ranked shares in each sector into a 20-stock portfolio. I run the process once per year at the start of the year, and then rebalance a year later. The "SNAPS" are the same process but run at the half-year mark.
For the first five years I used our marquee StockRank as the core ranking at the heart of the portfolio and selected 2 stocks from each of our 10 sectors. Eventually I reduced the shares held in the Utilities and Telecoms sector to one each - as frankly they tend to be small sectors with large, defensive, regulated stocks that don't hold out much hope of strong capital returns.
After five years I switched to using a "half and half" portfolio that more aligned with my market interest areas. Half the portfolio now uses the "VM Rank" (value and momentum) while the other half uses the "QM Rank" (quality and momentum). I explained the current process in depth at the start of this year - but in essence it still allocates fairly equally across the 10 sectors. I believe this change in process has added considerably to the 75% investment return the portfolio has generated in the last 18 months.
If you want to read the full history of the NAPS you can find the archive of blog posts here and some webinars about the process on our Youtube Channel.
Portfolio Performance
The performance tracking has been made much easier by the release of the great new portfolio performance tools on the site - if you aren't yet using the portfolio tracker now is the time to start. Accurate time-weighted returns are now calculated without any effort.
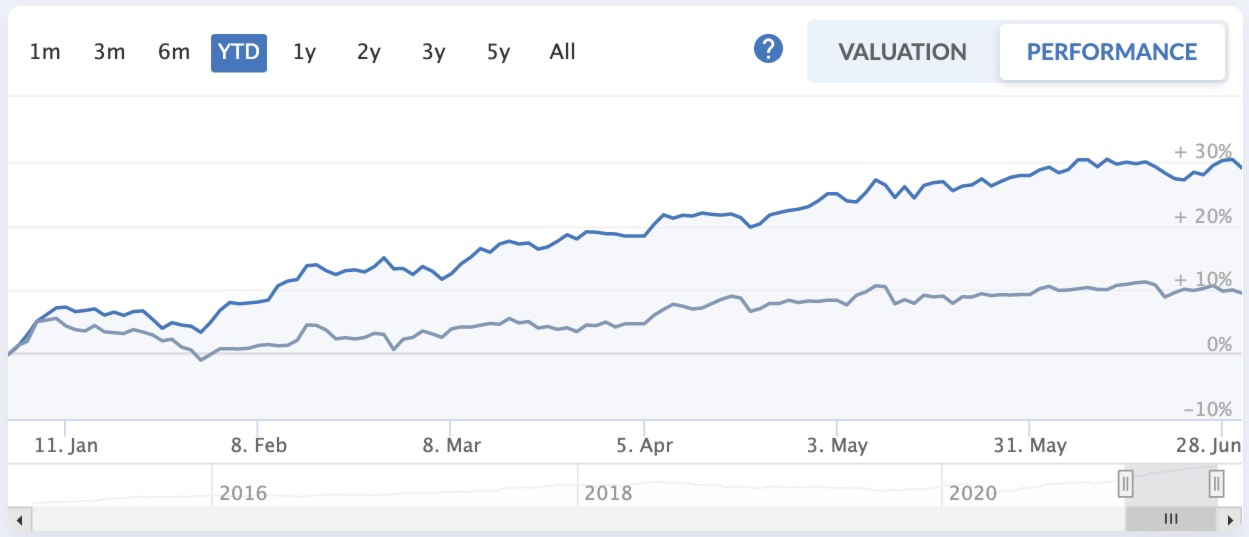
31% performance year to date, which compares favourably against the FTSE All Share which is up only 7.8%, and the FTSE AIM All Share which is up 8.2%. Only 1 unit trust out of 242 in the IA UK All Companies Sector according to Trustnet has beaten the NAPS year to date. And only by a whisker. It's a 99th percentile performance.
A 233% performance since inception. This compares extremely favourably against the FTSE All Share which is up a paltry 14.5% in the same timeframe, and the FTSE AIM All Share which is up 78%. The IA All Companies Sector only goes back 5 years on Trustnet. The NAPS is 3rd out of 242 in that timeframe...
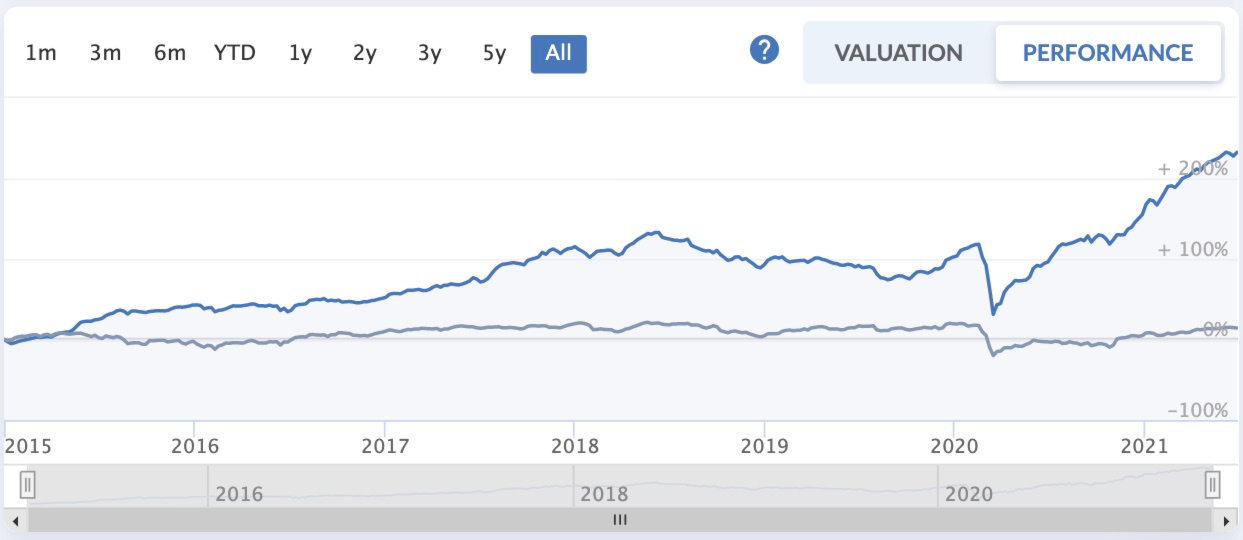
The return since inception is 20.2% annualised (excluding dividends). This is quite a remarkable result considering the NAPS Portfolio takes barely an hour per year to put together. There's really no need for swish City fund managers, expense accounts or Range Rovers for good performance in the stock market - this simple recipe of factor exposure and diversification proves it.
Position Performance
In terms of individual names... the biggest winner year to date has been Reach (LON:RCH) - up more than 90% - followed closely by Up Global Sourcing Holdings (LON:UPGS) and Sdi (LON:SDI) . 16 of the 20 stocks have beaten the FTSE AIM All Share's return YTD.
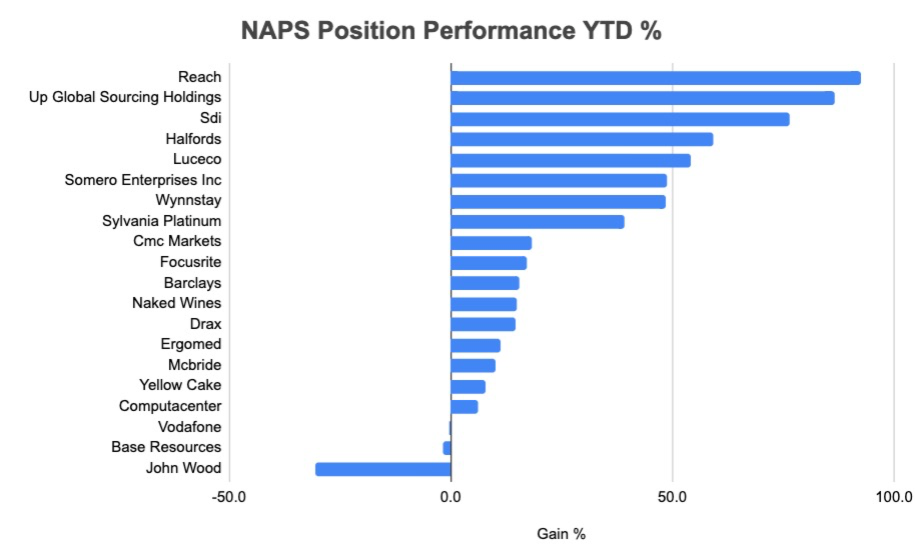
Only Oil Services firm John Wood Group has fallen dramatically -30%. It's actually been a pretty good 6 months for recovering oil & gas E&P firms but the oil services sector has continued to perform poorly.
Benchmarking the Results
You may note tha there's been a remarkable "win rate" for the NAPS portfolio year to date. 17 of the 20 positions (85%) are 'winners', with only 3 'losers'. Now this might seem like an extraordinary result - but is it really? To be totally honest, it's been a great year for most of the market.
I've analysed all the tradable stocks in the market above a market cap of £10m. 73% of stocks above a market cap of £10m have been 'winners'. Narrowing this down to those that were in the 90-100 StockRank bucket at the start of the year - 82% of those have been 'winners' with a price return greater than zero.
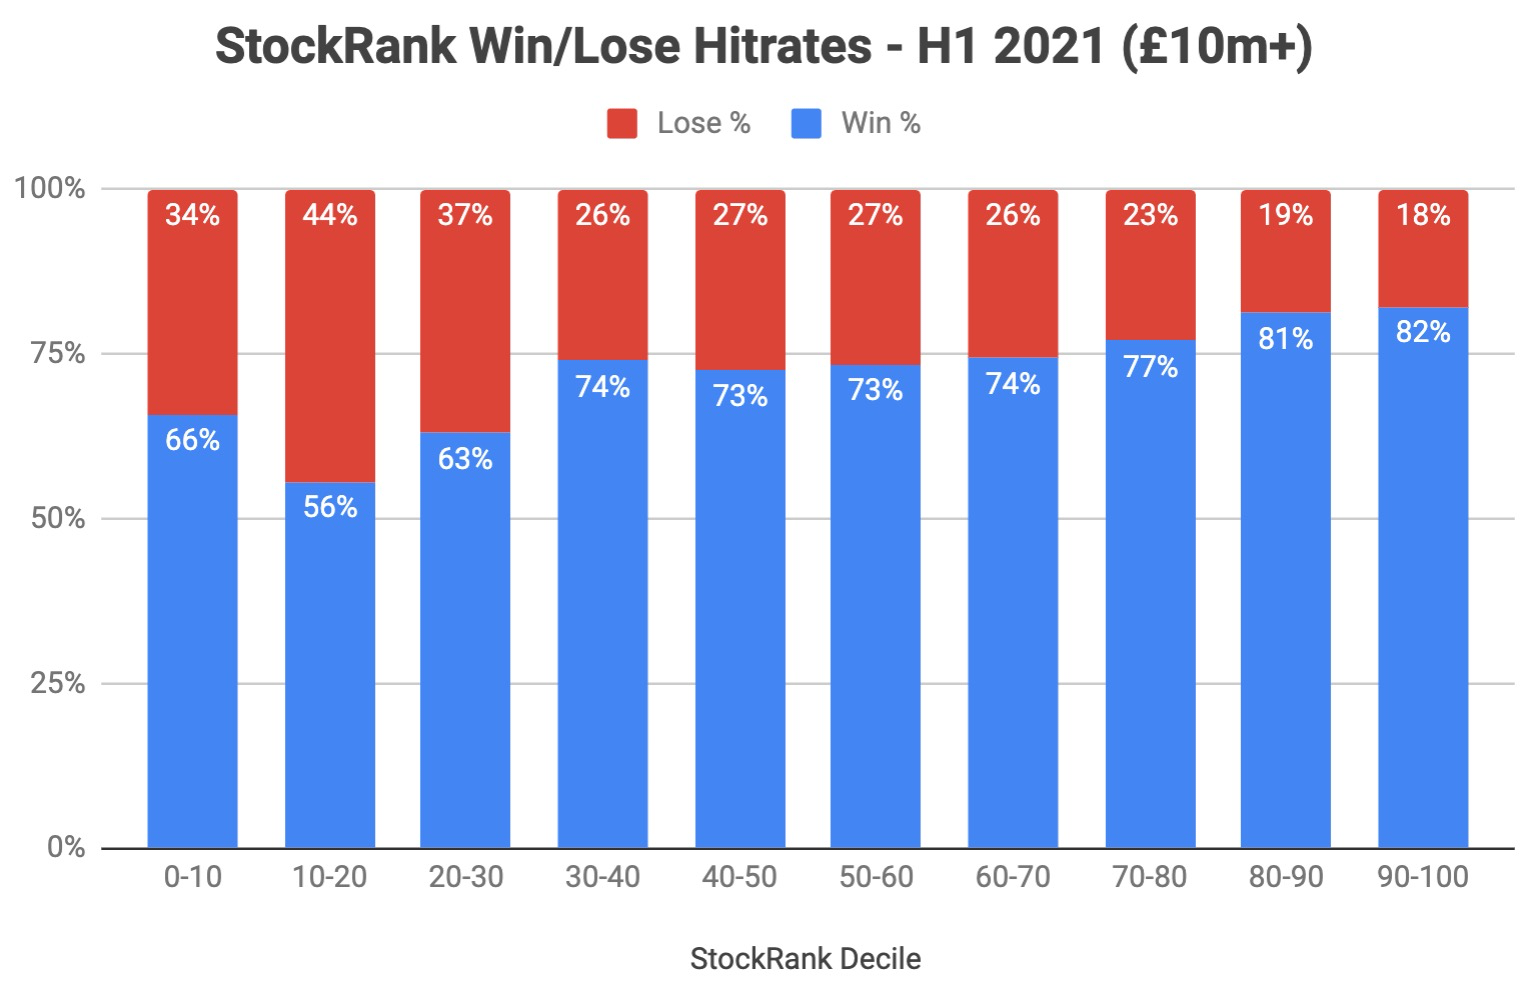
In terms of the performance of the StockRanks, it's been a strong year. The average 90+ ranked stock has returned 26% year to date. So the NAPS have performed well, but not anomalously well. I always think that benchmarking your own performance against high StockRank stocks, rather than the FTSE indices, is a great thing to do. It's really the real opportunity cost comparison for Stockopedia subscribers.
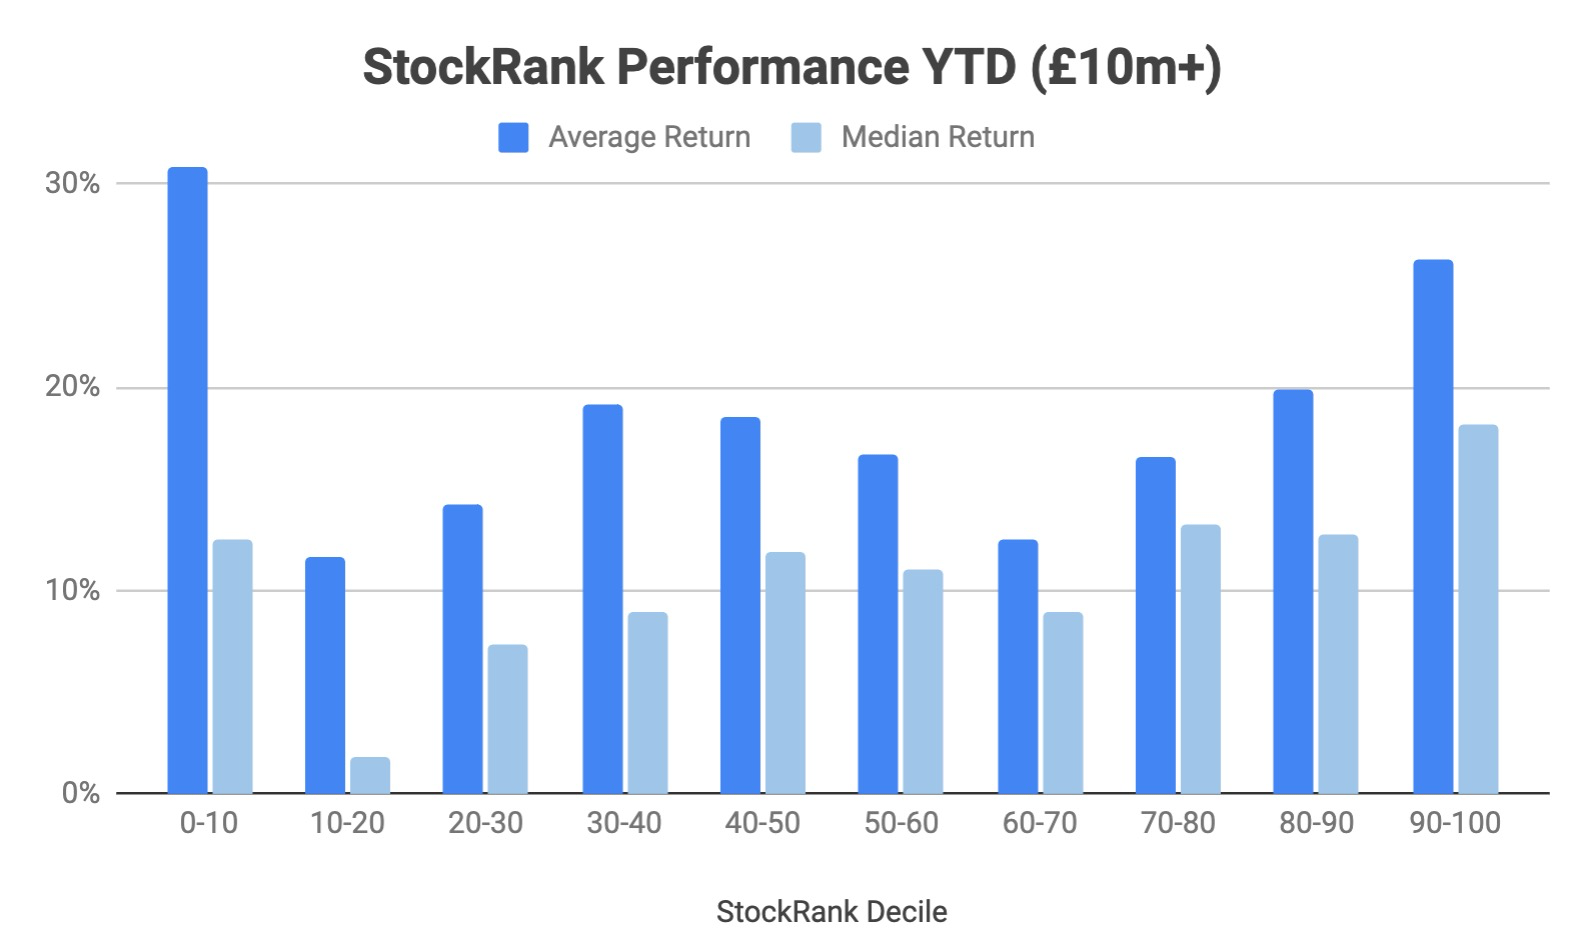
What's particularly fascinating about the chart above is the extraordinary returns of the low StockRank decile. Zero to 10 ranked stocks have had a great run since the bottom of the market, and that's continued this year. Interestingly the average return is very high, but the median return is not so great. That's because the returns of that bucket are concentrated in just a handful of names. Do note that over the long run low StockRank shares have tended to disappoint. We may be in a more disruptive economy, and high R&D shares are benefiting... but I personally like to play the averages.
Sector diversification
Themes in the sector performance year to date have been clear. Consumer stocks have continued to rally. Obvious "stay/work/play at home" plays like Naked Wines, Focusrite and Halfords have shown continued strength, while healthcare stocks (SDI, ERGO) have continued last year's outperformance through H1 2021.
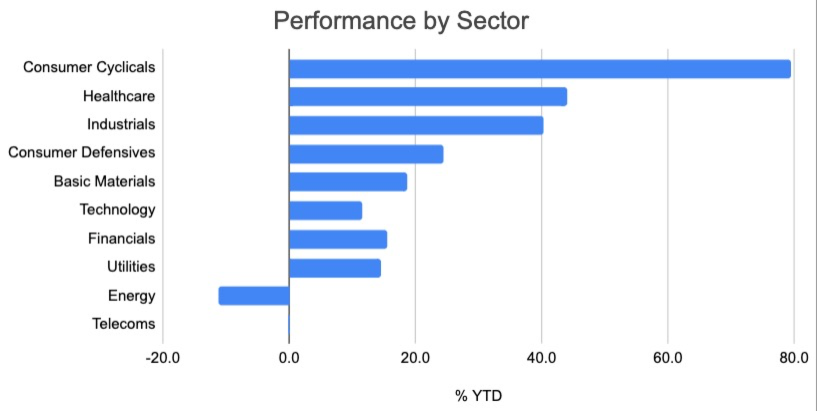
Remember - the NAPS portfolio is all about sector agnosticism. I've joked in the past that it's the Noah's Ark of investing - selecting shares 2 by 2 from each sector to weather different market environments. In some years we see completely different sector leaders than others. The point is not to predict which sectors will do well, but to place one's bets in such a way that you can always benefit in some way from sector rotation without a crystal ball.
Of course in the covid crisis last year the portfolio got hammered to lows like every other equity portfolio. The truth is in a market crisis, all equity portfolios are at risk and sector diversification won't necessarily protect you. The real benefit of having a sector diversified portfolio is you have far higher odds of participating in outstanding sector performance to the upside. FOMO is minimised.
The biggest mistake that private investors make is having all their eggs in a single sector basket. I've seen countless investors with massive overweights to pro-cyclical sectors that are projected to "continue outperforming forever". Think "Peak Oil" or "Dotcom bubble". What happens next? Years and years of underperformance. It's always worth looking at your overweights and considering where you might be being overconfident.
A highly unusual market - speculative shares have outperformed
The other key factor to note is that the last 12 months have seen Speculative and Highly Speculative RiskRating shares outperform dramatically. That can be seen confirmed in the performance of low 0-10 ranked shares above. There should be no doubt at all - this is an anomaly and not a normal market cycle. Over the longer term, lower RiskRating shares tend to perform better on a risk-adjusted basis. If you want to understand this concept and why the Tortoise beats the Hare - please do read our RiskRatings ebook.
The RiskRatings are published at the top of all StockReports. They provide an extremely simple way to understand the relative volatility of each stock you are investing in. As a refresher each RiskRating defines a standard volatility band expectation for each share (see below). i.e. if you own a "Speculative" share, you can expect a share price volatility of between 45% to 70% in any standard year.
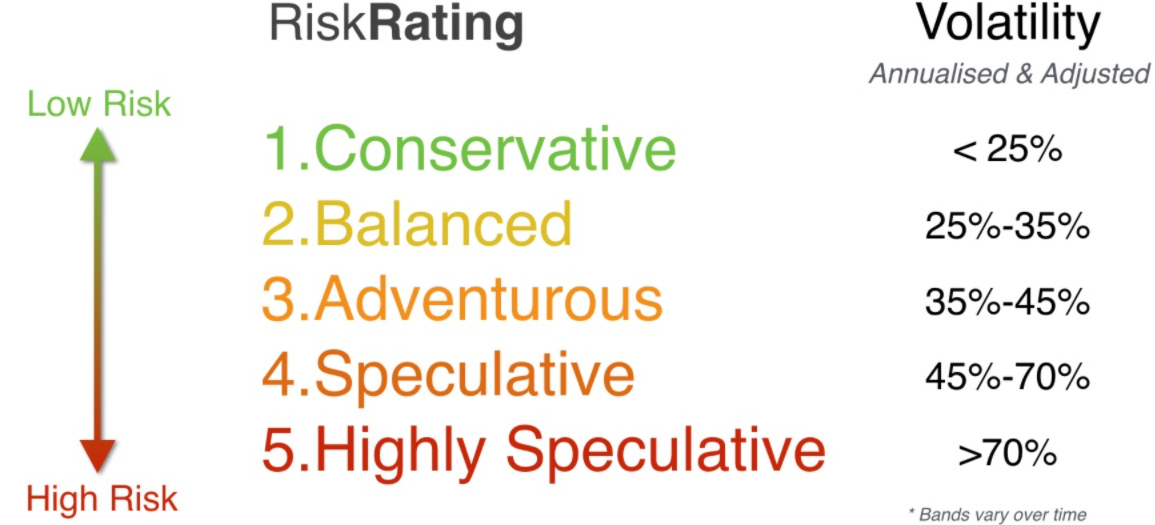
Why have highly speculative shares doing so well? Well there's has been a huge amount of economic disruption, and that's seen a wave of money (including govt handouts) thrown at pre-revenue companies across a wave of industries. Blue-sky biotech and green-tech/energy stocks have done amazingly well, and the resurgence of inflation fears has raised valuations in the recently out of favour mining explorers. Now we may well be in a new investing era - but it pays in investing to be prudent with one's speculations. History is littered with broke individuals who took on way too much risk at the top of market cycles.
Saying that, the NAPS itself has benefited greatly from its exposure to Speculative shares. The lower volatility Balanced/Adventurous shares have not been the key drivers of return. This is a double edged sword of course. In a downturn the portfolio may be more subject to drawdowns, but avoiding the most "highly speculative" RiskRatings does reduce the worst case scenarios.
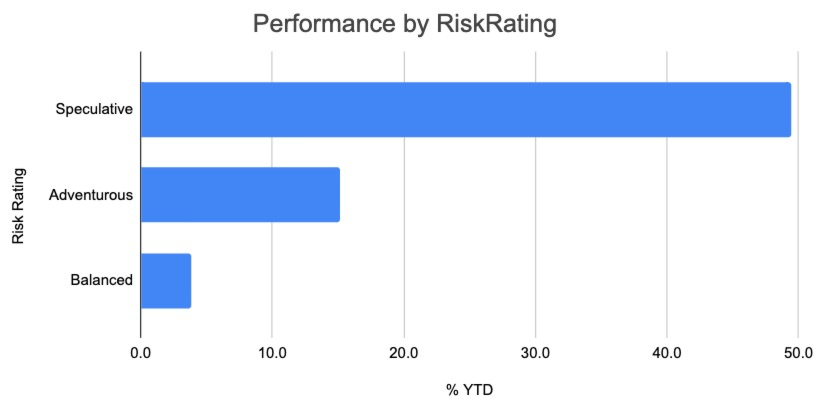
I do not like to bring out a crystal ball so won't predict the future. What I do know is that markets tend to mean revert, and after a year of such extraordinary gains one must expect there to be a worrisome wobble at some point. I've seen all kinds of statistics on the US markets about new highs with very low breadth i.e. market returns are concentrating in fewer and fewer names. This kind of technical market weakness can make you worry, but the UK market shows continued momentum and has reasonable valuations against other international markets. So as they say "while the music plays we dance"....
The SNAPS Selections
Using the same selection process as in January 2021 we come to the following portfolio - half VM and half QM. To be clear, the publishing of this portfolio does it imply that the NAPS is a 6-monthly rebalanced portfolio. The main NAPS portfolio is an annually rebalanced portfolio. This set of stocks is the new "opportunity set" that the same principles imply. There are some individuals that use the NAPS principles in different ways - some use stop losses, some rebalance more frequently or less frequently, some use different ranks and sector allocations. The point is that this is an illustration, not a recommendation and should be considered as such. One's personal circumstances are very individual and there's no investment advice here - just education and illustration - so DYOR, seek advice if you are unsure and best of luck in these wild markets!
| Ticker | Name | Mkt Cap | VM Rank | sector |
|---|---|---|---|---|
| INVP | Investec | 2840 | 99.8 | Financials |
| MMH | Marshall Motor Holdings | 153 | 99.7 | Consumer Cyclicals |
| HFD | Halfords | 841 | 99.4 | Consumer Cyclicals |
| GATC | Gattaca | 81 | 99.4 | Industrials |
| ZAM | Zambeef Products | 26 | 98.8 | Consumer Defensives |
| WEN | Wentworth Resources | 47 | 98.7 | Energy |
| BAKK | Bakkavor | 761 | 98.0 | Consumer Defensives |
| SEPL | Seplat Energy | 524 | 96.3 | Energy |
| AAF | Airtel Africa | 2935 | 94.6 | Telecoms |
| CNA | Centrica | 3045 | 92.9 | Utilities |
| Ticker | Name | Mkt Cap | QM Rank | sector |
|---|---|---|---|---|
| REC | Record | 195 | 100.0 | Financials |
| IMI | IMI | 4650 | 99.9 | Industrials |
| RMG | Royal Mail | 5781 | 99.9 | Industrials |
| BLV | Belvoir | 89 | 99.8 | Financials |
| STCM | Steppe Cement | 103 | 99.7 | Basic Materials |
| FXPO | Ferrexpo | 2582 | 99.6 | Basic Materials |
| ELCO | Eleco | 111 | 99.4 | Technology |
| TUNE | Focusrite | 745 | 99.3 | Technology |
| CVSG | CVS | 1684 | 99.2 | Healthcare |
| IDHC | Integrated Diagnostics Hldgs | 527 | 98.2 | Healthcare |
Many thanks to Jack Brumby and Ben Hobson for the individual stock write ups below. They have great insight!
Consumer Cyclicals
Marshall Motor Holdings (LON:MMH)
Marshall Motor Holdings is the 7th largest motor dealer group in the UK, with 115 franchise dealerships representing 22 brand partners across the country. It has a great track record of steady like-for-like revenue growth over time and a solid expansion strategy of organic growth and selective acquisitions in a fragmented market.
In its recent pre-close update, the group noted: “The market has continued to benefit from positive tailwinds, including a recent unprecedented used vehicle value appreciation and favourable demand-to-supply conditions for both new and used vehicles... The Group expects to report an exceptionally strong first half performance in both profit and cash generation when it issues its interim results on 10 August 2021.”
Halfords (LON:HFD)
Halfords is the UK’s leading retailer of motoring, cycling, and leisure products and services, while its Autocentres division provides vehicle servicing, maintenance, and repairs. Its share price performance since March 2021 has been exceptional, with a one-year relative strength measure of some +139%.
In the group’s preliminary results, Halfords said: “Demand for our services remains strong in the new financial year, and our touring categories are currently performing particularly well given the trend towards staycations this summer. In the longer-term, we remain confident in the future prospects for the UK's motoring and cycling markets and our ability to compete strongly in both.”
Financials
Investec (LON:INVP)
Banking and asset management group Investec, saw its earnings slide in 2020 and 2021 largely as a result of Covid. However, the second half of 2021 did see the start of a recovery, with earnings strengthening. EPS forecasts have stabilised and there is positive momentum in the share price. It looks relatively cheap on standard valuation metrics and forecasts currently predict a continuing recovery in the bank’s forunes.
In its full year results, Investec said: “The second half showed strong earnings recovery, supported by our resilient client base, a rebound in economic activity and a greater sense of optimism spurred on by global vaccination campaigns. We carry this momentum into the 2022 financial year.”
Record (LON:REC)
Record Currency Management is currently the highest Quality-Momentum stock on the UK market. As the name suggests, this is a leading currency management firm, with assets under management for pension funds, foundations and other institutional clients worldwide. It has a history of innovation in its field and continues to bring new products to market.
In its recent business update, the group commented: “Looking forward, we start the year on our highest ever level of AUME (assets under management equivalent), which is more diversified across our higher-margin products and provides us with an excellent platform for growth in FY-22. Added to this, we have been developing new products in collaboration with our clients.”
Belvoir (LON:BLV)
Franchised property groups appear to be a fantastic business model, and Belvoir is one of the largest in the market. Its franchises include Belvoir, Newton Fallowell, Northwood, and Lovelle. It also has a Financial Services division called Brook, which manages a network of 202 mortgage and financial service advisers operating through 100 businesses. Despite a stellar share price run (beating the market by 74.4% over the past year), Belvoir still pays out a forecast 3.12% dividend with plenty of potential for steady long term growth.
The group said in its recent AGM update: “The Board is pleased to report that trading during the four months to 30 April 2021 was exceptionally strong and materially ahead of management's expectations, with substantial revenue growth across all three markets.”
Industrials
Gattaca (LON:GATC)
Gattaca focuses on recruitment in the engineering and technology sectors, with 75% of its business coming from more dependable long term agreements. The stock fell far during the pandemic and has since rerated aggressively as society cautiously reopens, with a one-year relative strength measure of some +374% and a VM Rank of 99.
In its recent trading update, the recruiter commented: “Since we announced our half year results we have seen a faster rate of recovery in NFI than originally expected… our current expectation is that this rate of recovery will continue, and we therefore expect our underlying continuing profit before tax for the year to 31 July 2021 will be significantly ahead of market expectations.”
IMI (LON:IMI)
IMI is an engineering group that specialises in systems that control the precise movement of fluids. Both its earnings and share price have been largely unaffected by Covid, and in fact the group has been building momentum. It has a solid growth profile and strong financial quality characteristics. The shares are relatively expensive but IMI’s quality and momentum are exceptional.
In a recent update, the company said: “This momentum not only gives us the confidence to raise our guidance for the full year and announce a share buy-back programme, but also underpins our belief that IMI can deliver sustainably higher margins going forwards, at the same time as investing fully for growth.”
Royal Mail (LON:RMG)
When it comes to shares that are Covid ‘winners’, Royal Mail is right up there. After two years of negative momentum, 2020 saw the postal group’s share price take off as delivery services became crucial to a society in lockdown. It was enough to get the group back into the FTSE 100, with profits doubling and new delivery services launched. The focus is on maintaining that momentum, but for now it is solidly ranked across all dimensions.
In its full year result, the company said: “The Group has demonstrated that it can effectively harness market growth opportunities even in difficult circumstances and revenues previously forecast for three years' time have been delivered this year. However there is still much to do.”
Consumer Defensives
Bakkavor (LON:BAKK)
Bakkavor makes ready meals, desserts, pizza, bread and salads for grocery chains across the UK - and also has operations in the US and China. It was hit hard by Covid and Brexit but sales are recovering and it’s emerging as a leaner, meaner business. It looks reasonably priced and momentum is strong. Profitability is intact and the suspended dividend looks set to return. In a recent update, the company said: “The financial position of the group is robust and has strengthened over the last year.”
Zambeef Products (LON:ZAM)
Zambeef is an integrated food manufacturer, distributor and retailer in Zambia, dealing in a range of produce from beef and chicken to stock feed and flour. It floated on AIM in 2011. Covid hit the business hard but sales have been improving, which is feeding through to strong price momentum. Exchange rates and uncertain local economics are a risk - and the stock looks cheap on several measures as a result. In a recent update, the company said: “The Group had a strong start to the financial year, delivering results ahead of pre-pandemic levels.”
Energy
Wentworth Resources (LON:WEN)
Wentworth Resources is a small-cap energy company with gas production and exploration assets in the Rovuma Basin of East Africa, including a joint venture onshore producing gas field in Mnazi Bay in Tanzania. Strong local demand has pushed up production this year - driving momentum in the share price. Its exotic nature means the stock looks cheap, but this is a well financed, cash producing business.
In a recent update, the company said: "Building on from the successes of last year despite the challenging macroeconomic environment, the first half of 2021 has demonstrated the ongoing resilience and the strength of the fundamentals of our business.
Seplat Energy (LON:SEPL)
Seplat is a Nigeria-based mid-cap energy company working in oil and gas exploration and production. Current guidance suggests it will produce in the region of 48-55 thousand barrels of oil equivalent per day for the full year. Covid caused huge disruption to energy demand last year, which triggered losses for Seplat in 2020, but it looks set to bounce back to profitability in the year ahead. The stock looks cheap and price momentum has been positive over the past year.
In a Q1 update earlier this year, the company said: “We remain confident that our ongoing cost-cutting initiatives and prudent management of cash will enable further reductions in debt, whilst supporting dividend payments and investment for growth.”
Telecoms
Airtel Africa (LON:AAF)
Airtel Africa is a leading operator of affordable and innovative mobile service in 14 fast-growing African countries, with an exciting mobile money business. Targeting huge markets, Airtel has assembled 13 consecutive quarters of double digit revenue growth and EBITDA margin expansion and still finds room to pay out a 5.26% forecast dividend.
In the group’s recent full year results, the group commented: “The combination of bringing connectivity to underpenetrated mobile markets and improving financial inclusion through banking the unbanked, across our territories of operation, together provide us with a sizeable runway of sustainable profitable growth potential, and one we remain very confident of delivering.”
Basic Materials
Steppe Cement (LON:STCM)
Steppe Cement is the Malaysian-incorporated holding company of the two operating companies, (Karcement and Central Asia Cement) that form the cement manufacturing complex at Karaganda in central Kazakhstan. It’s an unusual UK listing that generates some eye-catching numbers, including a forecast dividend yield of nearly 12% and a forecast PEG of 0.5. It also qualifies for Jim Slater’s ZULU Principle screen. In the group’s recent full year results management observed that “the market demand in 2021 seems strong despite the effects of Covid-19 temporary lock downs.”
Ferrexpo (LON:FXPO)
Ferrexpo has been producing iron ore pellets from its mining operations in Ukraine for over 40 years and its asset base contains the largest iron ore deposits in Europe with approximately 1.7 billion tonnes of resources. But it’s not just the lifespan of its resources that impresses - the group transforms its raw materials into the highest grade iron ore pellets in the world and is currently reaping the benefits of this. For the past year, Ferrexpo has consistently been one of the highest ranking stocks in the UK market.
In its full year results, the group commented: “Through consistent investment and capital management, the Group has once again been able to deliver strong financial performance, coupled with shareholder returns.”
Technology
Eleco (LON:ELCO)
Eleco specialises in software and services for the architectural, engineering, construction and owner/operator (AECO) industries and interior furnishing industries. It has a very impressive growth track record and there are some eye-catching qualities in terms of strong and improving margins and return on capital. It looks relatively expensive but the momentum is strong and, unusually, it doesn’t seem to have been impacted very much by the turbulence of the past 18 months.
In a recent trading update, the company said: “The market opportunity for Eleco is compelling and our new, focussed growth strategy will allow us to better capitalise on the significant opportunities available to the Group.”
Focusrite (LON:TUNE)
Focusrite is a global audio products group of companies, with well-regarded brand names including Focusrite, Novation, ADAM Audio, and Ampify. This is a perennial High Flyer that regularly features at the top of the QM charts due to its consistently high profitability levels coupled with steady top line growth. Focusrite continues to surprise the market, and brokers have repeatedly upped their earnings forecasts through the year.
In its half year results, the group said: “Overall, the Group has performed exceptionally well. Revenue, EBITDA and cash have all grown considerably: Net Promoter Scores ('NPS'), an important performance indicator, have remained strong at 73 (HY20: 72); gross margin has increased; new product introductions have performed well; and demand for many of the Group's products has remained at unprecedented levels.”
Healthcare
CVS (LON:CVSG)
Buy-and-build veterinary services group CVS, has been on an incredible run in recent years - and its performance since the Covid-induced market collapse in 2020 has been staggering. It now operates across veterinary practices, diagnostics, pet crematoria and an online pharmacy and retail. Profitability is accelerating and the business is flush with cash. It has always ranked as an expensive looking share but the quality and momentum are undeniable.
In a recent trading update, the company said: “…the Board is increasingly confident that this strong performance will continue for the remaining months of this financial year. Consequently, the Group now expects full year revenue to be ahead of current management expectations and adjusted EBITDA to be comfortably ahead.”
Integrated Diagnostic Holdings (LON:IDHC)
IDH is a leading consumer healthcare company in the Middle East and Africa with operations in Egypt, Jordan, Sudan, and Nigeria. The company has internationally-recognised accreditations for its portfolio of over 2,000 diagnostics tests. Although the territories in which it operates might present risks, its financials are uniformly excellent, with double-digit compound annual growth rates and profitability metrics over multiple years.
In the group’s recent first quarter results, IDH said: “While the Company's immediate focus remains on continuing to play a frontline role in helping governments across our footprint combat the ongoing Covid-19 pandemic, IDH's longer-term outlook remains strong as evidenced by the recovery of our conventional business witnessed in the first quarter of 2021.”
Utilities
Centrica (LON:CNA)
British Gas owner Centrica had a terrible year in 2020. Unseasonably warm weather, Covid and low energy prices contributed to significant losses. The dividend was scrapped and it remains uncertain when payouts will resume, which is unfortunate given that yield is usually one of the appealing features of utilities stocks. However, a turnaround is underway and proceeds from a divestment have given the group more financial firepower. Momentum is positive and the stock looks cheap, so all eyes are on that trend continuing.
In a recent trading update, the company said: “Although the external environment remains uncertain, our tight focus on cash and on fixing the basics across the Group leaves us well placed as we continue the turnaround of our company.”
Disclaimer
This is not financial advice. Our content is intended to be used and must be used for information and education purposes only. Please read our disclaimer and terms and conditions to understand our obligations.

90 comments
Do people suffer from liquidity issues from owning AIM shares when exiting/entering positions and has it impacted performance?
Hugely dependent on your broker, and the size of the order. It was the primary reason I moved from trading 212 to HL, their order execution was significantly better. Sorry if that doesn't really answer CharlerHenryHer.
I know the NAPS to date has returned circa 18% annualised, but can anyone confirm the performance of the SNAPS since inception?
Regards
James
I make NAPS up 28% YTD. I don’t have SNAPS set up unfortunately. Other NAPS I set up in June and August have not gone up, in fact both are down.
I suspect SNAPs is struggling as well, some big fallers such as Ferrexpo (LON:FXPO) and Royal Mail (LON:RMG)
Just set up a NAPs portfolio using the themes outlined above to test a view that there is an often observed seasonal Santa Rally in the run up to calendar year end that may compound the benefit of a QM/VM portfolio approach. Snapshot of positions entered into today, £2.5k in 20 stocks. Not a perfect sector 2x2 selection as Consumer Defensives and Basic Materials under represented but still pretty well spread across market caps/risk profiles etc.. Several stocks in the list I wouldn’t normally consider (as much for reputation as hard numbers such as Gulf Keystone Petroleum (LON:GKP) Firstgroup (LON:FGP) and Indivior (LON:INDV) ) but stock agnosticism is one characteristic of the NAPs approach. Will report back on outcome at the end of the year and Q1 2022.
Gus.
Hi Gus, Interesting I set one up yesterday but got quite a few different selections, I'm curious how Ninety One (LON:N91) creep in, I have many higher ranked ones in the QM and VMs, such as Legal & General (LON:LGEN), Property Franchise (LON:TPFG) and Alfa Financial Software Holdings (LON:ALFA)
Hi Rustbucket.
I built a long list of the top 30 QM and 30 VM names as a raw data set then picked from this to get a diverse set of sectors. One additional criteria I applied was to exclude stocks with a market spread over 1% (some of the names in the long list had spreads of 3% or wider) which may have knocked a few names out. I also took out a few stocks that I know are very hard to buy online such as Md Medical Investments (LON:MDMG) . Tullow Oil (LON:TLW) was on the long list but Gulf Keystone Petroleum (LON:GKP) was already ahead of it on the list in the O&G sector (although for personal preference I would have taken Tullow Oil (LON:TLW) ). Not sure anything singled Ninety One (LON:N91) for inclusion so may have been (my) Monkey Brain error in the selection process missing out financial sector names higher up the list. Suggest we compare notes in maybe 6 months time.
Gus.
I see, yes less than 1% spread would take out many stocks, such as System1 (LON:SYS1) but Legal & General (LON:LGEN) I would have thought would qualify?
I did have trouble deciding between several stocks such as Renold (LON:RNO), Quarto Inc (LON:QRT) and Property Franchise (LON:TPFG)
I don't think some of the info. is correct on spreads, looking at Renold (LON:RNO) the spread is around 2.5% yet on Stockopedia it says 35bps. Tekcapital (LON:TEK) spread is around about 3% as well.
I also exclude stocks like Md Medical Investments (LON:MDMG) and also foreign ones like Vietnam Holding (LON:VNH)
Surprised you don't have any recruiters, I was fighting them off, Pagegroup (LON:PAGE) has a 100 QM score.
This was much easier exercise to do on the old site.
Sadly only reading this for the first time today as a relatively new joiner. Really enjoyed the analysis here and I see lots of food for thought in the SNAPS. I do also have one suggestion: given many invest via their ISA, it would be interesting to see a portfolio constructed around these same criteria with an annual cadence set around April 4th rather than Jan 1st.
Good point about ISAs but it is easy to do your own version. I have done one NAPs folio for each month since April, in the last few months NAPS are struggling to make gains. April NAPs is up 9%.
Is the music slowing?
Hi FREng, I believe the music has hugely slowed down. Over the past month or so, the stock market has been rising on ever reducing volume. I believe this type of divergence is not healthy because it makes one ask, what is holding up the stock market and preventing a correction/crash??
This month I have moved from 100% fully invested to 50% cash. If a share falls below its 50day MA / Stop Loss then I am currently selling. I will fully move back into the market at some point but not yet.
David.
Any views on why GATC has fallen so much of late?
My son and I built a European NAPS style portfolio for the first time this year. And then built two variants - 1 with extra earnings growth hoop to jump through and one focused on small caps (less than £100million). We also added US shared in the screen. We implemented all three portfolios in Jan/Feb. The original NAPS is performing best though it made almost all gains in the first 3 months. It is up 20-25% YTD.
The stars are Somero Enterprises Inc (LON:SOM), Sdi (LON:SDI) and €STO3. All still looking good for rest of the year. The small cap version most volatile as one would expect but €SFPI doing well.
Taking all off the table for the summer but expect to build more portfolios from October onwards and will keep you posted.
Hi Alex
Thank you for sharing this.
I would certainly be interested to see how those portfolios perform going forward, so any update, if possible, would be most appreciated.
All the best.
A
I'm a bit in two minds over Sdi (LON:SDI) at the moment. The share price is down 11% from its recent peak, and there was a director's sale of over £1m on May 21st. I am thinking of top slicing my holding, which is currently up a little over 200%. Final results to be announced on July 20th.
Any thoughts?
Agree. I have actually taken profits on this as winding down the portfolio and it looks expensive.
Although I've been a subscriber to Stocko for several years, I've used it for cherry-picking individual stocks and the odd guru screen picks. I did 'run a book' month by month back on the 2018 NAPS - the year markets were distinctly lacklustre and posted the updates every month with real-world progress after commission costs et al and also posted the dividends too.
It was such a disappointment that year, I can only think it entered my psyche and I've never taken the plunge with the annual NAPS. Back then it was all Stock Ranks only - but this QM/VM ranking intrigues me. I'm determined to run a modest investment 20 stock portfolio at some point this year (a seasonal Oct to May cyclical punt, as don't think that's been done to date) as I'm comfortable with cyclicals/seasonal time frames.
So rather than leave things to the last minute I've started by practicing running the ranks now and adjusting with my preferences. Result? 20? Nope, only got 8 in the first run I tried in the QM ranks. (So lowered my barrier from 15% to 12% (ROE/ROCE/ROA) and better, with 13 candidates I think, so lowered again to 10% and got 18 candidates. Only when I included US stocks, did the screen flood-out with candidates.
So with at risk of being too picky I dumped the entire ROE/ROCE/ROA filters completely, but left the F-score and the 90 and over in the main Stock Ranks in place and results were fine. One thing I discovered though and that was getting 10 sectors to display was more difficult.
So I re-looked at Ed's example, with his no-caveats applied to his ranks (in a spreadsheet and counted).
Yep he had all 10 sectors - in both camps. Think I spotted where he 'traded down' to force-feed the full Monty of 10 sectors with a couple sporting sub 90 Stock Rank ratings (but not in the QM/VM ranks of course) with a Stock Rank of only 74 for CNA! And three more at 87.
I also specified that no candidates to be selected with an F-score under 6, and there were 4 of them, three 5's and a 4, no way was I including anything below 6 in F-Scores. (the three sub-90 stock rank stocks all sported F-scores of 8 each - so they get to sneak in through the back door anyway). The stocks that fell foul of the only 2 remaining filters I applied to the current SNAPS are -
VM ranks:
-----------
INVP
ZAM
SEPL
CNA
QM ranks:
-----------
ELCO (but I love this one :)
TUNE
CVSG
That's being picky. So will monitor the fell-foul candidates to see if I can reel in my hesitancies, should they out perform.
The rest I'm putting through trend following techniques to ensure they already possess a longer term uptrend in play, or are enjoying a significant break-out in progress, because that's what I'll be doing with mine. (And anything below a 200 day m/average gets the boot instantly (with some refinements).
The task is, to see if actual events remove my concerns, thus emphasising the NAPS selection process without my added filters.
( PS. Repeat: All 20 candidates sported 90+ ranks within their respective QM & VM camps, not all did so in the bigger, general Stock Ranks ).
I would offer a word of caution with US stocks for use in the NAPS. If you look at the browse screens, while QM ranks have fared 'ok' top stock ranks and VM ranks have massively under performed. The US seems to be the only market where this is the case. I believe Ed did mention this during one of the NAPS videos a while back.
Whole heartedly approve of the NAPS/SNAPS approach though! Good luck.
James
Also large companies perform much better in the US markets than in the UK. Stockopedia performance for the top ranked stocks in the US has not performed well, the S&P500 has outperformed it. In fact at the moment the 90-100 ranked stocks in the US are the worst performing of all the ranks: https://www.stockopedia.com/st...
October this Friday, so thinking on starting my NAPS from approx the third week of October/Nov 1st to start the "Sell in May" version of NAPS.
In my previous posts I indicated I'd done a dummy run on the QM/VM combo, and since then, practising again as think I might be busy in late October so don't want to be fumbling about at the last minute on the new site.
However, I still had the initial test run data to hand from July 8th I mentioned above - in a folder, so decided to set them up in a watching portfolio today, to see how it had/ would have progressed (July/Aug/Sept so just over 3 months) if I had chosen to invest back then, on that day (July 8th) with my first run choices.
- Thought it might be of interest
Well, was taken aback at the poor results in the QM half and equally surprised at the decent results in the VM half. Was sure it would be VM that would be the poorer performer.
So, surprise No:1 was a 5% downside performance to the 10 QM choices with barely 3 making a gain (2 really as the third was just for a £1 gain (based on £2k per stock)
2nd surprise was almost a complete sweep of gains in the VM half of the portfolio with a 6.5% gain.
However one of the selections was an energy company and there's no price today for it, so assuming it was one of those energy companies that have just collapsed. So the VM half of the portfolio contained only 9 stocks.
Overall there was still a relatively even-stevens close to the full portfolio showing a slight overall gain of 0.6% gain.
(Felt sure as I was entering the prices tonight, that it would be a significant loss. Pleasant outcome after the poor performing QM half of things).
If results were really good, I was going to commence now, but some of the down trending stocks I can see were trending bearishly at the time of July 8th. Some only fell earlier this month in September, so couldn't have been foreseen at the time with trend following strategy entries.
Need to decide if rebalancing quarterly, etc., as I've been reading some data from a 2008 book (US) that reads as if it was meant for Stockopedia, where they had the best results by rebalancing monthly! (What about costs?)
Next best was quarterly rebalancing and bringing up the rear was annual rebalancing. All showed reasonable gains and not huge divergences in % amongst the better performances anyway. (They used the same Gurus as Stocko).
- The selling rule is to only rebalance should any stock no longer display the metrics it was first chosen for, not to ignore it. And not rebalancing because it fits with the timeframe - only if the metrics had dissipated away.
Also I like how it said, long term investing includes rebalancing on a regular basis as long as you don't deviate from your chosen strategy, therefore that is still classed as long term investing. You can add to strategies but you can't cherry pick sectors - all must be used for diversification. Long term holding excludes just mindless buy and hold forever. Buy and hold only if the stocks still qualify with the strategy.
Otherwise, if still qualifying then a rebalancing period could involve no changes; so you could buy and hold forever that way :)
PS. Curiously all their 10 stock portfolios outperformed their 20 stock portfolios, no matter the value guru chosen, or the back testing year coverage. (But minor % differences only).
Hi Velo, I have set up a NAPs on the first of the month in June, July, August and September, all of these are making a loss, around 2.5-3%. September has been a bad month, the original NAPs set up in January is down around 7%. I don’t have a split between VM and QM stocks.
Hmm . . . Interesting. Thanks for the helpful info Ray.
I'd like to think the Sell-in-May refrain has some validity, as your experience appears to add weight to it, but 2020 absolutely destroyed that perception by doing the opposite!
Was vacillating over £2.5k per stock to £3k per stock, for test starting, but will stick with the initial £2k each per 20 stocks. Others seem to have done well with this strategy, but the fact remains there are no guarantees. There have to be dud years - that's a given. Impossible not to have them.
I'd like a longer-term portfolio (mine are itty-bitty mixes) simmering away in the background under uber control conditions., whilst I also engage in continuing with my other methodologies - ie., trend following.
PS. Was going to post tables and lists of the individual stock % gains etc., but it's a dead test, and was busy too.
Will post details of my own live buy NAPS as others may be interested in the progress. I'd really like this to work, so £2k per stock gives me recovery remission to start over if all doesn't pan out well. Quietly confident it will though.
I not convinced that sell in May is something I would do. Yes has worked this year although sell in August probably would have worked even better, timing the market is difficult. On UK small caps it's probably not worth doing either.
One thing I forgot to ask is how do you separate QM and VM, as I found several were selected on both lists? VM may do better when the markets are flat or falling? Some of the VM stocks have performed badly, one of the worst was Opg Power Ventures (LON:OPG), down over 40%.
" One thing I forgot to ask is how do you separate QM and VM, as I found several were selected on both lists? "
----------------
Yes, same here. Good stocks tend to be commandeered by all processes/ Guru strategies :)
As the process is to initially choose the 2 highest rated stocks per sector, for each strategy (so a total of 40 selections to whittle down to just 20 overall). So in that scenario just move on to the 2nd choice. I had a hankering after Gamma, so when it came up on both lists and even though it was only the July 8th practice run, I thought:
- See? After all these years it's still calling me. It's got my name on it!
So deleted it from one list that had a nice 2nd choice and all was well. Gamma's long, long, long term SP history is to die for. Bottom left to top right corner of the screen.
Years went by and I did nothing, so this exercise broke the inaction. I was already liking the process :)
When I opened that portfolio and blew oxygen into its lungs with live prices yesterday, Gamma was one of those with a very small decrease against the July 8th buying-in price (used EOD prices) LOL! :) :)
Incidentally, I've kept the 2018 NAPS folio (Ed's selections) - that year was one of the worst, if not the worst performing years for NAPS (based solely on Stocko's ultimate overall Stock ranks selections only).
However, had a look-see yesterday at how it was doing after leaving it to its own devices for nigh on 4 years now
- and first amazing thing is, that the larger majority of the 20 stocked portfolio are still all well up in 90's deciles.
The second thing I noticed (well it was actually the first thing) was from that year of a poor performance, the portfolio is nowadays showing a decent gain - and gone was the double-digit % loss for 2018.
Furthermore, back then, I was including all the dividends which because of Plus500 were exceptional. So adding just that year that I kept records, moved the gain up higher, quite noticeably.
If I made estimates for the following years and nil for the recent years it would still move the portfolio up into a v smiley arena!
Well that's not a bad performance at all - not breaking any record performances but a decent enough performance.
So without any rebalancing whatsoever, one of the worst NAPS years (2018) on record, left to run unmolested is doing quite well nowadays, years later.
Reminds me of that account from Fidelity of Canada as related in Daniel Kahneman's, investor psychology books.
(Apologies if you've already heard this one).
In it, he tells of Fidelity carrying out a review of all their clients accounts to see if there was a recurring theme amongst their best performing clients - there was!
The very few top performers all had one thing in common - they were all deceased! And had been deceased for many a year.
Pretty much like leaving that 2018 NAPS to run as is. Turned out the 2018 NAPS WAS a success after all - in the long run :)
(Ed has kept records of how each year performed - but I wonder if he's let each of them run-on un-rebalanced, just to see?)
That's interesting about 2018 year. I don't leave them running as only 10 folios available on here. I did think that they ran out of steam after a year but I did look at the 2020 NAPs and it's up around 28Y YTD which is about the same as 2021 NAPs. The big winners from last year have hardly gained this year but the mid performers have done well, such as Galliford Try Holdings (LON:GFRD), Solid State (LON:SOLI), Judges Scientific (LON:JDG), Reach (LON:RCH) are up well, Reach (LON:RCH) is up about 155%. Big loser Enquest (LON:ENQ) is up 106%. Apart from Associated British Foods (LON:ABF) all the losers are up. From that it looks like sell the big winners (Ergomed (LON:ERGO), £Premier Foods (LON:PFD), Petropavlovsk (LON:POG), Frontier Developments (LON:FDEV), Shanta Gold (LON:SHG)) but keep hold of the others? Taking out the top 5 from 2020 will improve the performance from 28.5% to 36.7%.
This is contrary to running your winners and cutting your losers though.
Thank you for this article Ed. It really struck a chord with me and I keep coming back to read it again and again. I've also enjoyed going back through the earlier articles too. I'm thinking of putting this methodology in to action with next year's ISA allocation.
I’ve been running 3 stock ranks portfolios over the last year each with different rules and the holdings are mutually exclusive. The returns on an annual basis put my other portfolios to shame they have returned 65%, 60% and 50%. The numbers say it all and I will continue dancing to the music.
" . . . each with different rules and the holdings are mutually exclusive. The returns on an annual basis put my other portfolios to shame they have returned 65%, 60% and 50%. . . "
----------------------
Well done Troytea - I do like to read success stories. Would love to read a further post on the 'different rules' that you found effective.
I’ll write it up and post when I get time along with some learnings along the way.
Hi Troytea:
Well done. Did you pick those in the UK or include other markets?
all listed in the uk. It keeps costs down and more importantly it is easier for me to keep a handle on domestic stocks
Hi Ed,
Another great article. I took the plunge on a NAPS approach with c.75% of my pension at the beginning of August last year. It's delivered about 37% return, which I am more than happy with. I'm quite looking forward to the refresh on August 3!
Interestingly, two picks from last year are still in the running to be picked again this year: Ferrexpo (LON:FXPO) 139% SP gain plus 19% dividend yield and Imi (LON:IMI) 64% SP; 8% yield.
Luceco (LON:LUCE) was the best performer (+197%), while there were five losers:
Nwf (LON:NWF) -6%; Spirent Communications (LON:SPT) -8%; Telecom Plus (LON:TEP) - 12%; Goldplat (LON:GDP) -15%; Hummingbird Resources (LON:HUM) -43%. (None of these adjust for dividends).
Goldplat (LON:GDP) should never have made the cut because it is too small, so that's a mistake on my part. I did tinker a bit at the beginning: Goldplat (LON:GDP) replaced Centamin (LON:CEY) after the latter issued a profit warning. The tinkering didn't help - but clearly Goldplat (LON:GDP) and Hummingbird Resources (LON:HUM) have been hampered by the stagnant gold price.
My other bit of tinkering was to top slice 15% of £LUCE. I put the proceeds into another part of my portfolio which has performed pretty well, so I'm ignoring it for the purposes of annual performance.
In previous articles, you have talked about reviewing the portfolio on a quarterly basis. What would you do on such a review? Do you consider stop/gain locks? You did reference the Greenblatt approach, but he advocates building the portfolio by buying five or six stocks a quarter. I'm not sure how that would work with the NAPS sector diversification method. I'd be interested in your thoughts.
The second issue I'm now facing is that I have grown attached to some of the picks. I'm interested in putting more in the miners as an inflation hedge. There are others like Wynnstay (LON:WYN) Studio Retail (LON:STU) and Computacenter (LON:CCC) that I think have long-term hold potential. I do think the beauty of this method is it exposes you to companies in a meaningful way - and promotes a deeper understanding of the companies with momentum at your back.
I suppose it is also worth keeping an ear out for the music stopping too!
Ps: Is it possible to do the NAPS position performance % charge in Stocko or is that your own?
Be great if this could be done with US stocks? Suppose it's the same idea and can be applied to any region?
I am repeating a previous post:
"For the US Market, whether using StockRanks, QM ranks or VM ranks, this type of stock picking system has performed relatively poorly over all available Stockopedia time periods. For example, the 80-90 and 90-100 deciles have persistently and significantly underperformed the S&P 500, the S&P 1500 Composite and the NASDAQ Composite. Therefore, I am bound to say that the evidence to date suggests that this type of stock picking system should be used cautiously when picking US stocks."
The US market is very, very efficient. Lots of quants. I see the difficulty of beating the US market with quant metrics as an indication of the 'end state' for all global markets. The kind of QVM spread returns we see in the UK and other markets around the world will likely be arbitraged away over time.
Interestingly the QVM alpha has been very persistent in the UK over the last 8 years since we started publishing the StockRanks. As more people gain access to these kinds of metrics, behaviour changes and likely the market becomes more efficient. The US has been doing this kind of quant for retail investors since the 1990s. What Stocko is bringing to the UK and other markets is less broadly adopted. I also think there are some highly "old school" institutional fund management behaviours in the UK that actually protect the QVM returns.
You can do it yourself for any region, but it may not work so well. Also for some areas availability of stocks can be a problem. I tend do a monthly UK NAPs folio.
Even some UK listed stocks I'm unable to trade.
Fascinating article - thanks for this.
Re. the out performance of the bottom decile/highly speculative cohort of shares over the past year, my anecdotal theory is that this has been driven in large part by the spectacular rise in the price of oil & gas as well as a wide range of industrial and precious metals. When COVID first arrived, economic Armageddon forecasts pushed oil down below US$20 a barrel or even less for “spot” delivery (now about US$75) and the rise in metals such copper and some of the rare earth metals has been even more spectacular.
In my own portfolio, most of my “guilty pleasure” sucker stocks are in the O&G and Mining Sectors, and it is these that have seen stellar outperformance. Companies such as Zephyr Energy (LON:ZPHR) (+900%), 88 Energy (LON:88E) (+720%), Canadian Overseas Petroleum (LON:COPL) (+660%), and Pantheon Resources (LON:PANR) (+225%) have all shot the lights out in the last year albeit from a very, very low base share price/market cap riding the wave of their own specific story and the tailwind from commodity prices in general. Might be of interest, if not too much additional work, to assess how specific sectors/speculative/lowest deciles have performed. I agree with your caveat that unless “it’s different this time” (which it won’t be) what’s gone up will inevitably, in most cases, come down again.
Gus.
@gus1065
The "return to form" of the high ranking stocks has been quite noticeable in recent months - if you look at the UK chart over the last 3 months, it's an almost perfect decile spread that mirrors the long run return profile. Yes the lowest ranking set has won over the last year, but it seems there are norms returning to the market. People are starting to avoid the more speculative segments and seek a bit more predictability in the more robust profitable segments.
https://www.stockopedia.com/le...
Of very little value as I am located in Australia.
Why? Use the same methodology outlined to make your own list of names. I am in Australia too, seems simple enough.
I did also set up a top 20 QVM folio at start of the year this has out performed NAPS although the gap has closed over the last month.
It is currently up 31.14%.
Top performers are Reach (LON:RCH), UP Global Sourcing Holdings (LON:UPGS), Royal Mail (LON:RMG), Halfords (LON:HFD), Wynnstay (LON:WYN) and Ferrexpo (LON:FXPO). Worst is Robinson (LON:RBN) at -25% then Goldplat (LON:GDP) -10%.
" I did also set up a top 20 QVM folio at start of the year this has out performed NAPS although the gap has closed over the last month. "
------------------
Interesting Herbie47. Even faster than initially separating the two as Ed has done.
Two questions:
* Did you actually set it up by putting skin in the game by allocating funds, or set it up as a watchlist exercise only?
* Have you done more than one year of a QVM folio to draw firmer conclusions?
I'm planning on doing the set-up as per Ed's choice, 2 sets of x 10 stocks @ £2k per stock therefore a £40k test portfolio.
Deliberately keeping small value per stock to curb enthusiasm, as typically use guru screens (successful outcomes) and Stocko in general for its individual metrics in discretionary selections.
Time for a NAPS-like portfolio, then.
- Will also introduce a little bit of cyclical seasonality by buying in October and selling next May and restarting that following October etc.,
I like your idea of buying in October and selling in May, actually think that has a lot going for it. But.... do you select your Naps on their performance over a period which includes the (just finished) June to September or only on how they performed the previous October to May?
Westway001 @
" But.... do you select your Naps on their performance over a period which includes the (just finished) June to September or only on how they performed the previous October to May? "
------------------
Hi Westway, I haven't used the NAPS system, particularly since the nasty 2018 NAPS year
- which I provided monthly updates in the comments section, throughout that year.
So decided NAPS wasn't for me, and have been v happy since, using particular individual metrics and general balance sheet evaluations entirely in a discretionary manner.
However, with a smaller allotment of funds for NAPS set aside, I do fancy a funded folio somewhere, that is non-discretionary as the successful guru picks I've invested in are non-discretionary in that I would never have chosen them on my own.
SLP comes to mind (guru screen pick) which is doing splendidly if you can stomach the perceived risk of commodities. RCH I sold after a nice profit, but hindsight reveals I should have held.
To answer your question: neither method you suggest - I'm going to select just as Ed has done as if it was early January. I am currently using a monthly cyclical seasonality strategy elsewhere, and as it's doing so well, I'm trying to incorporate it more into my strategies, but first that experiment runs to this year-end, to decide if mere coincidence or whether there is a cyclical effect on SLP and a few others held in that experiment (posting regular updates on that elsewhere).
So it'll be whatever comes out as top NAPS selections in October - at that time (probably late October).
I will also use trend-following strategies on those stocks that are performing so well, that as suggested by a poster further back offered - that some of his NAPS picks are now becoming longer-term holds despite him gearing up for an August rebalancing.
(And so designate those as new longer-term holdings selections?)
The plan is to attempt to select whilst there's maybe a chance prices are perhaps cyclically lower.
October to May will be an experiment in its first year - if successful, then repeated annually
- until it isn't.
I did not invest in all of the stocks but I do hold some of them. Im not sure what difference actually buying the stocks would make? I only set up 1 QVM folio, Stockopedia only has 10 folios available. The performance certainly seems to have tailed off since start of May. June NAPS has not not gained at all.
When selecting stocks there is so little difference in the rankings, I’m curious to know why if you use the Ranks you get different order than using the sectors.
I may well do a NAPS folio with real money later this year with tweaked rules, some spreads are too wide and debt Is too high in some stocks for me.
I'm just setting up various folios to compare the performance, I was stuck by the success of the new NAPs format but this year the results are not so clear cut, last year was pretty unusual.
If I could set up more folios on Stockopedia, I would but I'm having to delete folios to set up new ones. Setting them up elsewhere it is much more difficult to track their progress.
I have been cherry picking some of the top ones each month with mixed success. The problem with picking 20 shares in one go is I have some of these already or I may have similar stocks already, so there are often conflicts. Buying in September/October may have have some substance although buying in March/April last year would have been much better timing.
" Im not sure what difference actually buying the stocks would make? "
----------------
The difference it would make between actual skin in the game and just holding in a watch list, is measureable in my own experience.
Watch-listing stocks to test, one can do without a second's thought, but as you suggest, to buy a stock with undesirable debt just because it's a NAPS qualifier would IMO have a psychological impact, and would perhaps encourage some investors to skip over that candidate.
So that's why I ask if funded or not. I do believe we react differently once there's actual money on the table compared to choosing stocks for a watch list only.
(At least, I know I do).
I had thought your original post was a direct 20 stocks v Ed's 20 stocks comparison, but you've advised your method was to cherry pick only "some" of the NAPS (nothing wrong with that either) so not what I had inferred from your original post. Thank you for clarifying.
If, as you say, you already held some of the NAPS elsewhere, wouldn't it be straightforward enough to choose the next suitable candidate, so long as it met your requirements?
You admit to cherry picking. I suppose that's why I too, am considering a non-discretionary strategy such as a 20 stock NAPS portfolio. I also will have some boundaries that I won't cross, so will employ those in the final choices. After all, Ed does say it's a starting point, not a straight-jacketed methodology :)
- So we can if we have the time to devote, fine tune as necessary and subsequently compare to the 'official' NAPS progress.
Sorry if my post was not clear but it was a direct comparison it was the top 20 QVM listed stocks v NAPS. Both started at the same time.
My own holdings some are cherry picked from my monthly NAPs folios.
Re skin in the game I take your point but I don’t think it would make much difference to me, 5 years ago it probably would have done, also it would be only a small proportion of my portfolio.
Ed I note that that on the SNAPs stock selection each of the VM & QM rankings are given to one decimal place, eg INVP value rank is 99.8 and not 99.
Is the 99.8 figure available to all and if so where?
The StockRanks are decimals behind the scenes and the decimals are respected in the app sort order, but for display purposes we round them. I believe they are maintained as integers in table copy/paste and export. We should probably export as decimals. But to be honest, these kind of rankings don't really have value at that level of detail.
Well done the Stockopedia team.
Great results, but more importantly great analysis. Thanks
Just wondering.... the selection is based on VM and QM... Why is GM (Growth momentum ) ignored? is that due to any macro picture? any views from the people?... as @Ed said, we can model based on whatever parameters one want......
Hi tripuram, Ed explains why the G rank is only included as a legacy factor in one of his webinars - link below. This is not NAPS specific, but for the whole site.
He says that originally, when they were pulling the stockranks together, they found that the Growth factor didn't perform as well as the QVM ones. Their original StockRanks were based on QVGM but their academic analysis and research showed that the G rank was a less powerful factor and fully explained by Q and M so they dropped it. He stresses that the QVM 'lens' still picks out high Growth shares.
The webinar is on YouTube - The StockRanks Webinar - Five Years of Performance History - and the clip is from 43mins 24 secs in, from the slide that says 'More...'
thanks Indie for helpful information
Yeah we originally included the G which is why it's in the QVGM "Composite" ranking that's available in the screener.
After more research, and a realisation that G was correlated very closely to both Q and M, we realised there wasn't much added value in including it in our composite, so shifted to QVM. To be honest I really struggled with this personally as I'd always been a Zulu Principle investor and very growth biased. What the QVM research implied was that Growth is an emergent property that is best predicted by the other factors. Meanwhile the academic research is pretty clear that growth has a tendency to mean revert.
In most performance reviews since, we've found the G Rank to underperform the others and that QVGM underperformed QVM.
Great post Ed and there's no doubt that the last year has been - unusual - in so many ways!
You say that "Do note that over the long run low StockRank shares have tended to disappoint", which is true on average for mid-cap stocks (those ranging from 350m-2500m).
But... is it really true for everything?
For penny stocks the opposite seems to be true from the screening tool. Low stock ranks (that's to say, those that are 20 or lower) perform as well or better than high stock rank shares. Similarly, in large caps the performance differential between the stock rank deciles is small and in some cases negligible compared to the transaction costs of switching.
I don't know if this is a survivor bias for penny stocks? Maybe the real dogs go bust and drop out of the system and what is left are the lucky few story stocks that actually make it. Similarly there may be an activism bias for large caps? Maybe large businesses that underperform are subject to more shareholder pressure to change strategy?
If it makes it onto your backlog, I'd appreciate any analysis you can do to evaluate the effectiveness of stock ranks in different sectors and company sizes... My own experience is that using Stockranks in mid-caps only results in markedly better and more consistent performance than attempting to select from the entire stock universe.
Is there anyway of back testing such portfolios?
You could have a SNAPS portfolio which starts with greater risk/speculation in the early part of November - replacing those selections with a more defensive set of selections in May?
Great results! Out of curiosity what is the performance of the parallel SNAPS portfolio which runs at half-Year mark and has different holdings than the NAPS? Hopefully it compares well with the NAPS.
Definitely an interesting take on stock picking Ed - Having followed your 2021 posts on it I decided to use the quick and easy rationale with the Stock picking challenge this year Just "play" with the Stocko data for 15 minutes
At the mid point I am up 34% - Better than my own "thoughtful" performance YTD
Conclusion ? Haven't worked it out yet. But the mind games for me are all part of it
Always an education and worth the subscription for it
@elifeme - my systematic portfolio (which is very NAPS oriented) massively outperforms my discretionary portfolio. I think it's important for me to have a discretionary portfolio as it gives me an outlet for my gambling instinct and reminds me that I'm full of cognitive biases.
Ed thanks for the reply - That put very succinctly was exactly what I meant
Great results and a very interesting experiment. It shows how taking emotion out of investing can deliver great results. Thanks for sharing and I hope it continues.
Hi Ed and team - for me the NAPS has proven to be extremely helpful, as I dont have the time/experience to perform detailed research and monitor positions/news. I acknowledge the limitations, but to date this is far better that my 5+ years of overpaid funds with mediocre returns. At least now I have full transparency and control over on my own investment fund. Thank you!
Ed, why does Zambeef Products (LON:ZAM) not come up on the top VM rankings? I have Bakkavor (LON:BAKK) as top VM CD choice. ZAM is not listed at all for some reason.
Not that I would buy Zambeef Products (LON:ZAM) anyway.
I also have Good Energy (LON:GOOD) as top Ult in VM with a score of 96.
Hi Herbie,
I thought the same thing, could get the stock to show even when just search for consumer defensive. After much tinkering it turns out that you have to have the dual listing box ticked otherwise it doesn’t show.
Hi Graham,
Thanks, I thought it maybe to with the dual listing but how do you change that on the Ranks and under your screens?
Hi Herbie, just click edit rules for the screen and you’ll see a selection box for dual listings at the bottom of your rules
Thanks but still can't find it.
Would not be better for the default to include dual listings? I don't have a problem with many of them.
herbie47 - when you click on the darker grey box that I have circled the dual listing box that you need to untick appears:
oh dear, now I need someone to tell me how to get all of one photo on here. This is the vital bit that Stocko cuts off:
OK thanks. So Zambeef Products (LON:ZAM) is a mistake because if you include that then why not all the other dual listed stocks such as Banco Bilbao Vizcaya Argentaria SA (LON:BVA) ?
Why are some dual listed excluded and not others as I asked before?
Why are images now not fitting on the screen?
Can’t even access the new site posts, keeps going to the most popular posts of all time when I click on this post.
Hi Herbie
I too also have Good Energy as top VM and it’s been that way for 2-3 days so now wondering when the new stocks for h2 were selected or has a personal decision been made not to go for Good Energy. Edward can you let us know please.
Hi Ed, In one of the StockRanks webinars on YouTube (from 1:07:41 in), you looked at how StockRank performance compared in the different geographies and which geographies gave the same/different results as the UK, however the NAPS webinar was demonstrated using the UK site only. Do you run NAPS for other geographies and, if so, how are they doing?
I'm interested because if I did add other geographies to my UK Stockopedia subscription, then NAPS is how I'd be choosing stocks.
For the US Market, whether using StockRanks, QM ranks or VM ranks, this type of stock picking system has performed relatively poorly over all available Stockopedia time periods. For example, the 80-90 and 90-100 deciles have persistently and significantly underperformed the S&P 500, the S&P 1500 Composite and the NASDAQ Composite. Therefore, I am bound to say that the evidence to date suggests that this type of stock picking system should be used cautiously when picking US stocks.
Having said the above, Stockopedia does supply a wealth of other information on US stocks, and that has certainly helped the US part of my investment portfolio outperform the UK part, despite exorbitant currency exchange charges.
I think it works well for European shares, however the issue is availability and transaction costs if you based in the U.K. certainly the performance and guru screens have good performance for European stocks. I agree it does not seem to work so well for the US markets.
I don’t know about other regions.
Hi Edward et al,
Weldone on another outperformance, and I honestly wonder if my life would simpler in buying a NAPS portfolio and turning the computer off for a year.
I hope you don't mind me questioning if this still a NAPS process?
Question -'No-admin-portfolio-system NAPS,' with added complexity and what appears like a selection with a combination of stock ranks and human preferences as suggested by the lists below. (VM List and QM List).
should we still be still calling this NAPS as the human preference need some knowledge of the stocks selected hence some investigation?
VM List
Name Mkt Cap GBP (m GBP) VM Rank Sector
Investec 2779.09856 99 Financials
Marshall Motor Holdings 152.5528622 99 Consumer Cyclicals
Gem Diamonds 100.5280633 99 Basic Materials
Halfords 858.5909172 99 Consumer Cyclicals
Vertu Motors 167.1916448 99 Consumer Cyclicals
Barclays 29082.90946 99 Financials
Ocean Wilsons Holdings 383.688984 99 Industrials
Royal Mail 5770.69256 99 Industrials
Gattaca 82.6624 99 Industrials
Quarto Inc 36.69796725 99 Consumer Cyclicals
Smiths News 110.59805 99 Consumer Cyclicals
Kingfisher 7696.253169 98 Consumer Cyclicals
Just 967.0726418 99 Financials
International Personal Finance 298.9622417 98 Financials
Renewi 440.130207 98 Industrials
Renold 49.70461167 98 Industrials
Norcros 266.1183583 98 Consumer Cyclicals
Lookers 276.0660491 98 Consumer Cyclicals
Wentworth Resources 45.68967393 98 Energy
Tmt Investments 224.7986549 98 Financials
Scs 116.3187243 98 Consumer Cyclicals
Cmc Markets 1337.300376 97 Industrials
Ferrexpo 2518.134079 97 Basic Materials
Ros Agro 1253.796034 97 Consumer Defensives
Bakkavor 748.6178558 98 Consumer Defensives
Natwest 23489.92 97 Financials
Uk Mortgages 129.4508785 97 Financials
Atalaya Mining 423.6181218 97 Basic Materials
Virgin Money Uk 2858.764949 97 Financials
Wynnstay 98.57526036 97 Consumer Defensives
Morses Club 117.9521797 97 Financials
Quiz 14.9077086 97 Consumer Cyclicals
Osb 2080.610313 97 Financials
Redde Northgate 981.9047778 97 Industrials
Premier African Minerals 43.6506833 97 Basic Materials
Carclo 38.17798036 96 Basic Materials
Seplat Energy 553.1378873 96 Energy
Titon Holdings 15.2669375 96 Consumer Cyclicals
QM List
Ticker Name Mkt Cap GBP (m GBP) QM Rank Sector
REC Record 191.092152 100 Financials
IMI Imi 4622.232368 99 Industrials
RMG Royal Mail 5770.69256 99 Industrials
STCM Steppe Cement 109.5 99 Basic Materials
CVSG Cvs 1708.354699 99 Healthcare
BLV Belvoir 86.9547888 99 Financials
STEM Sthree 615.8931913 99 Industrials
SOM Somero Enterprises Inc 258.4084132 99 Industrials
MDMG Md Medical Investments 543.3211109 99 Healthcare
RWA Robert Walters 540.2803224 99 Industrials
FXPO Ferrexpo 2518.134079 99 Basic Materials
ELCO Eleco 110.0805363 99 Technology
TUNE Focusrite 767.0009299 99 Technology
TRMR Tremor International 1066.064556 99 Consumer Cyclicals
KGF Kingfisher 7696.253169 99 Consumer Cyclicals
SOLI Solid State 88.1010912 99 Industrials
CMCX Cmc Markets 1337.300376 99 Industrials
TPFG Property Franchise 95.80547834 99 Financials
OXIG Oxford Instruments 1327.410846 98 Technology
ASTO Assetco 401.775974 98 Industrials
UPGS Up Global Sourcing Holdings 188.99008 98 Consumer Cyclicals
PETS Pets At Home 2280 98 Consumer Cyclicals
GATC Gattaca 82.6624 98 Industrials
SDG Sanderson Design 118.5424534 98 Consumer Cyclicals
SCS Scs 116.3187243 98 Consumer Cyclicals
CCT Character 150.7274561 98 Consumer Cyclicals
TYMN Tyman 883.082862 98 Consumer Cyclicals
HLMA Halma 10196.04987 98 Industrials
BAKK Bakkavor 748.6178558 98 Consumer Defensives
SAG Science 167.4207768 98 Industrials
KEYS Keystone Law 212.6627988 98 Industrials
SUS S&u 324.278442 98 Financials
TON Titon Holdings 15.2669375 97 Consumer Cyclicals
TAM Tatton Asset Management 249.2580062 98 Financials
NXR Norcros 266.1183583 98 Consumer Cyclicals
XPP Xp Power 1096.040117 98 Industrials
NFC Next Fifteen Communications 895.5496103 97 Consumer Cyclicals
BRBY Burberry 8364.597032 97 Consumer Cyclicals
ROR Rotork 2975.627238 97 Industrials
IDHC Integrated Diagnostics Holdings 516.3809937 96 Healthcare
SECN Sec Newgate Spa 25.12962468 97 Consumer Cyclicals
PAGE Pagegroup 1836.978947 97 Industrials
G4M Gear4music Holdings 209.50176 97 Consumer Cyclicals
SPX Spirax-sarco Engineering 10043.24744 97 Industrials
TET Treatt 697.8541518 97 Consumer Defensives
SAFE Safestore Holdings 1996.500467 97 Financials
SDI Sdi 203.0692362 97 Healthcare
AFM Alpha Financial Markets Consulting 396.4575284 97 Industrials
MAB1 Mortgage Advice Bureau (holdings) 627.814516 96 Financials
BSV
@BlueskyVentura
"I hope you don't mind me questioning if this still a NAPS process? Question -'No-admin-portfolio-system NAPS,' with added complexity and what appears like a selection with a combination of stock ranks and human preferences as suggested by the lists below. (VM List and QM List)."
To be clear, the SNAPS were generated completely systematically with zero discretion. The process of copying the stocks into a spreadsheet and selecting the top 2 ranked in each sector took less than 5 minutes.
You are right that at the start of the year a couple of stocks were removed (using my discretion) to minimise industry concentration (e.g. PLUS and JLP were removed as CMC and SLP were already in the folio). This time, there was no need to remove any stocks.
If you think this is too much admin to still be a NAPS process... you are very entitled to your view. But 5 minutes work isn't much admin for me personally.
Hi Edward,
as mentioned by others Zambeef Products (LON:ZAM) does not show up in the VM rankings, just wondering is this a glitch in the application software or a discretionary selection?
BSV
It's the highest ranked VM in Consumer Discretionary. Came out of my straight database export the other night. It's a dual list that's slipped through somehow - glitch in the matrix - am quite relaxed about it - the selection stands.
There's quite a lot of obsession about the individual names in this list. What people are missing is that this strategy is not about the stocks - it's about the overall factor exposure. The stocks don't matter - the factors do.
If there's any difference in the names selected to the list that you generate yourself... it's fine. This isn't about being hyper-anal about the names. It's about building a sample of stocks to replicate the performance of the overall high rank population - consistently and over the long term.
It's a system that anybody can apply and adapt in the way that suits them... if you want to change the rules you should and I'd encourage people to - it's not rocket science. DYOR and make your own decisions - we're all self-reliant DIY investors here.
Hello Ed, the point is Zambeef Products (LON:ZAM) does not show up if you search under Ranks or in your screens.
Talking about dual listings why do some show up such as BP (LON:BP.), Burford Capital (LON:BUR) and Tremor International (LON:TRMR) yet others don’t?
Why was Good Energy (LON:GOOD) not selected, it has been the highest ranked Utl for some time.
Thanks, Edward,
OK, the software has glitches.
It seems there is a fair amount of discretion going into selection as companies higher up the list did not get selected with preferences given to companies lower down the list. This seems to suggest a systematic approach has been replaced by a hybrid selection method where a discretionary prefer probably took more than 5 min to develop.
All the Best.
BSV
Seplat Energy (LON:SEPL) now pay a quarterly dividend but high risk Nigeria
Always a good read, not to mention a reminder of some basic principles. Always pleasing to see positive write-ups of stocks being held, especially when chosen on an own-blend NAPS-style basis.
Just mentioning... some of the ticker tags seem to have dropped off. It's happening to the SCVR too.
Integrated Diagnostic Holdings (LON:IDHC)
Do you have any concerns about the change of auditor at Integrated Diagnostics?
@DWit199 - regarding the change of auditor at IDHC. To be honest, this is the point of the NAPS - it ignores all knowledge of anything going on at any of the stocks. Always has and always will. It's selected some really dodgy stocks at times... some of them have collapsed, and some have rocketed when fears abated. Over the long term the portfolio has outperformed. I know nothing about IDHC so can't advise.
No argument NAPS is absolute genius. As you say we have our cognitive bias - therefore 5 minutes of finding the suitable candidates then buying them feels counter productive to human nature.
I was wondering if anyone has applied rules/filters and actually got better results than straightforward NAPS?
To be honest, this is the point of the NAPS - it ignores all knowledge of anything going on at any of the stocks.
Ed,
Thanks for taking the time to reply. I recently read Kahneman's latest book "Noise: A flaw in human judgement". He makes the point throughout the book that even the simplest rules applied consistently will nearly always outperform human judgment. NAPS is a shining example. However, in Chapter 10 - Noiseless rules, he introduces the concept of the "broken leg. "
Consider a model that was designed to predict the probability that people will go to the movies tonight. Regardless of your confidence in the model, if you happen to know that a particular person just broke a leg, you probably know better than the model what their evening will look like.
If we are using simple models to make decisions, models that cannot possibly know whether there is a broken leg, then it is important that we retain the ability to override the model when we encounter a genuine broken leg situation.
Is the knowledge of the change of auditor at Integrated Diagnostic Holdings (LON:IDHC) a "broken leg"? The company has operations in Egypt, Jordan, Sudan, and Nigeria which is sufficient to raise an eyebrow, but as you say "[NAPS] selected some really dodgy stocks at times... some of them have collapsed, and some have rocketed when fears abated" so probably not enough to overrule the system.
However, in the letter from KPMG (marked private and confidential!), they state
"The circumstances connected with our ceasing to hold office relate to our concerns in relation to the robustness of the control environment at the Company. This matter led to difficulties in our obtaining sufficient and appropriate audit evidence on a timely basis and, latterly, to a deterioration in our relationship with management."
That paragraph suggests to me a lack of transparency and honesty from management, which I believe is a good example of a broken leg.
@Dwit199 - I'm certainly of the opinion that if you have genuine reasons to avoid a stock you certainly should. There have been obvious cases in the past where I felt some stocks should have been excluded if I'd used my discretion, and generally that was proved right. Indivior was one example that fared very poorly.
I have though always observed that high ranking stocks tend to always generate some form of cognitive disgust:
I'm often very surprised at the stocks that end up doing best and they often are stocks that I'd most want to avoid - it's very hard to predict annual performance.
Looking for broken legs is important, but that is the task of the individual buying the shares.
I see NAPS as an experiment to determine how a small selection of shares , chosen by metrics and the segment within which that business operates in the market, performs against the top tranche of shares. The top tranche of shares will have a number of broken legs so it is statistically inevitable that NAPS will include the occasional broken leg. If we extract the broken legs, it is no longer that random comparison.
What I really love about NAPS, is that the usual starting point in my investing methodology is to to use Stockopedia to rule out the shares that carry too much risk for me. With NAPS, that strategy is turned on its head and my starting point to to accept those shares unless my own independent research throws up a broken leg or there is a conflict with my existing investment profile.
As for IDHC, I have seen a similar communication in my time that was generated as a consequence of appalling mismanagement in the internal team that were required to write to the firm's suppliers to ask them to write to the auditors confirming how much the business in question owed. This function failed spectacularly. No lack of transparency, no lack of honesty, just mismanagement in one team that meant the books could not be closed.
Would you be prepared to try the NAPS on the US market?