Should I hold onto multi-baggers?

The research that the Stockopedia team and others have done into multi-baggers is one of the most popular studies amongst investors. And rightfully so. Finding just a few very high-return stocks can transform a portfolio’s performance.
The power of long-term winners is seen in the wider market, too. Over very long periods, stock market performance tends to be dominated by a few big winners, whereas the majority of stocks produce mediocre returns at best. As the following chart of 30-year returns from Bessembinder et al. shows:

The Makings of a Multi-bagger
In a previous article, I looked at how past multi-baggers performed. In particular, the UK stocks featured in a 2020 study called ‘The Makings of a Multi-bagger’ by hedge fund Alta Fox Capital. The study looked at the 104 global stocks that generated a total shareholder return greater than 350% over five years (with a market cap between $150m and $10b, excluding energy, materials, and financials).
One misconception that this study put to bed was that the UK market was not the place to be looking for multi-baggers and that investors should be focussing on the US instead. While the absolute number of high-return stocks was higher in the US, it was significantly below the proportion of stocks listed in the US. Meanwhile, the U.K. was over-represented as a proportion of stocks listed:

The U.K. stocks in the study were Games Workshop (LON:GAW) Future (LON:FUTR) £ J.D. Boohoo (LON:BOO) Keywords Studios (LON:KWS) Frontier Developments (LON:FDEV) Ab Dynamics (LON:ABDP) YouGov (LON:YOU) GlobalData (LON:DATA) Fevertree Drinks (LON:FEVR) Bioventix (LON:BVXP) Tristel (LON:TSTL) Learning Technologies (LON:LTG) RWS Holdings (LON:RWS) IG Design (LON:IGR) £IDEA Gamma Communications (LON:GAMA) .
However, when I analysed the subsequent performance of these stocks, it was not great. By 2023, 12 out of the 17 had subsequently lost investors money. The performance of these past winners has not got any better since. Here is the updated price change:

The relative performance of these stocks is abysmal, losing money during a period where simply owning a UK index tracker would have generated reasonable returns.
The Stockopedia Multibagger Study
The methodology the Stockopedia team used to analyse multi-baggers was a little different. Here, the team looked at the best-performing UK stocks over the decade ending in April 2023 and what characteristics led to that outstanding performance. So, how have these performed since?
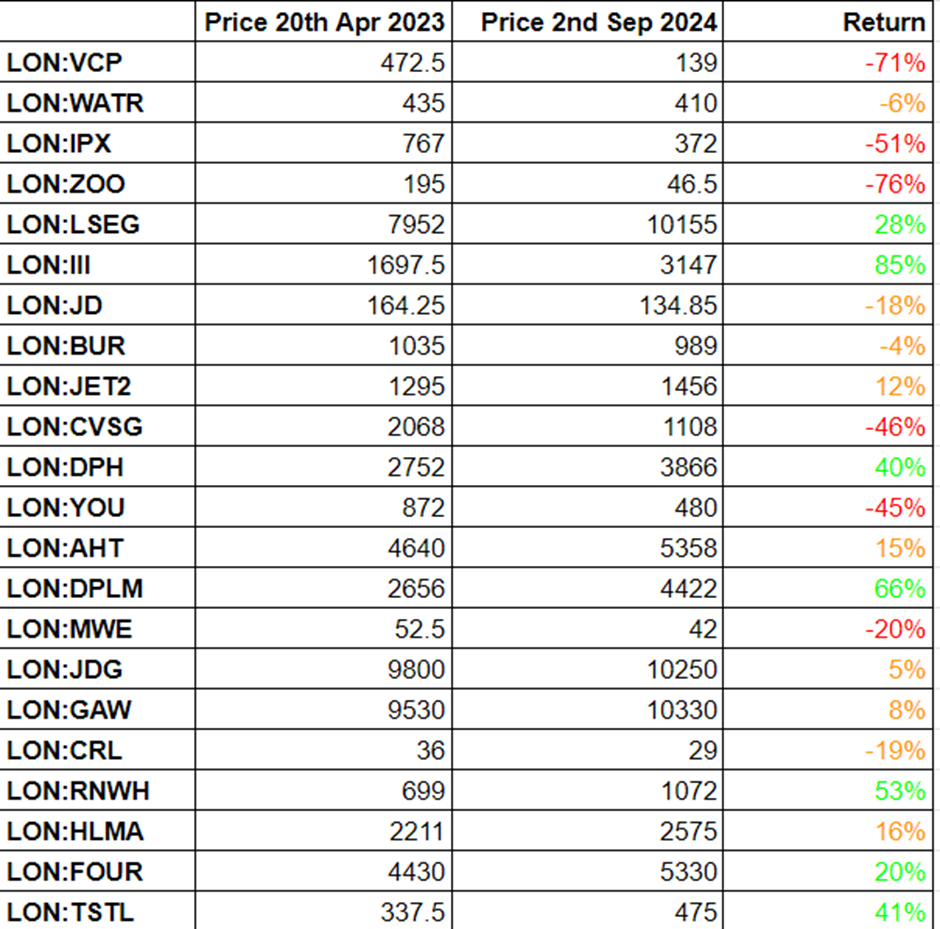
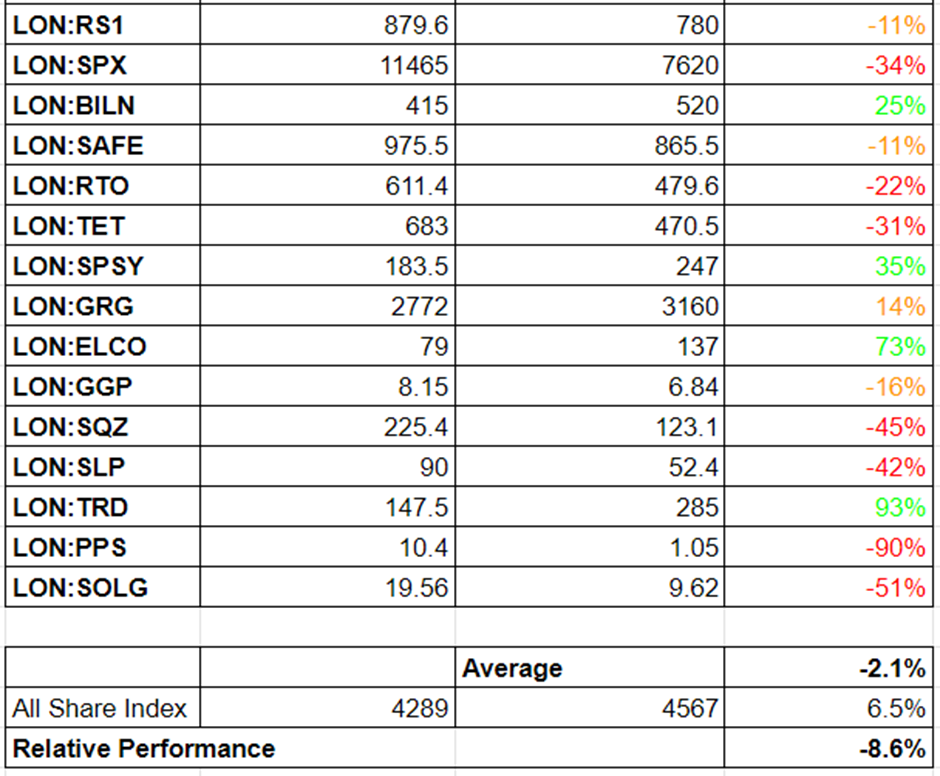
The answer is mixed at best. An equal-weight portfolio of these past strong winners has underperformed a passive stock market investment.
This leads to an uncomfortable realisation. It is undoubtedly true that in order to own a 5-bagger, investors need to hang on when they have a 2-bagger. However, hanging on to multi-baggers, hoping they will continue to be winners, appears to be a losing strategy. It seems that stocks are more likely to be multi-baggers due to factors outside the control of management, or even due to pure luck, instead of management skill or something inherently great about the business.
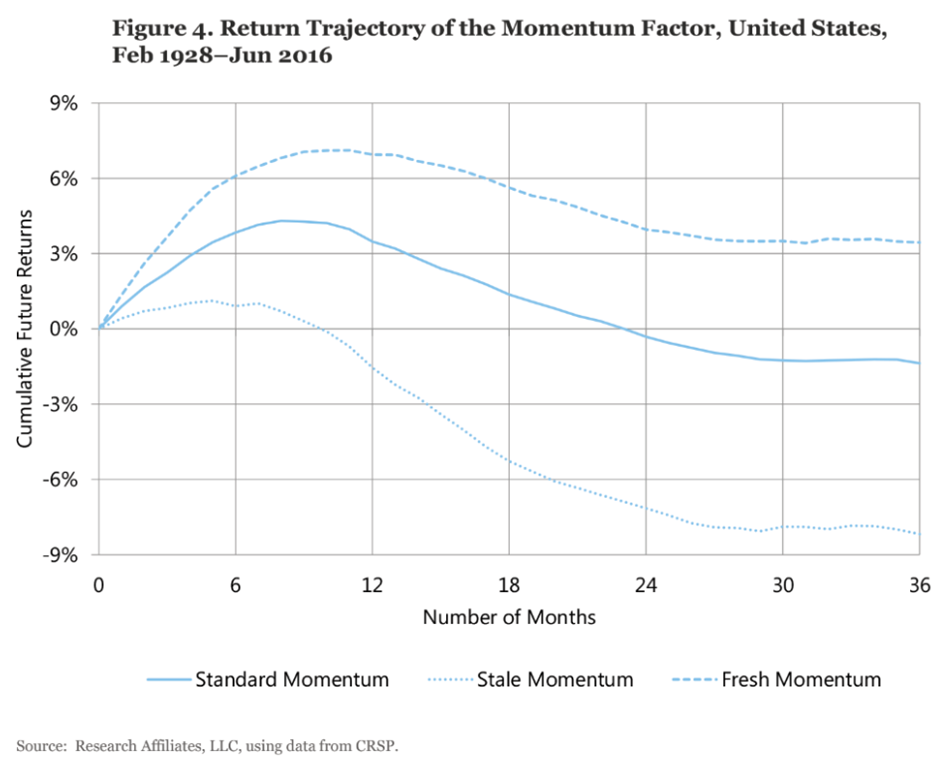
That past multi-baggers tend to underperform may well be due to what Research affiliates call “Stale Momentum”. They found that:
Momentum can be divided into fresh and stale Momentum, with very different results. Stocks that have exhibited strong Momentum for two or more years are both very expensive and tired; this is stale Momentum. Momentum essentially fails, especially net of trading costs, for stale momentum companies.
Here is what this looks like graphically:
I thought it would be interesting to see if there are any factors that may separate the winners that keep on winning and those that gave it all back. When analysing multibaggers, four factors led to their great performance: revenue growth, net margin increase, earnings multiple increase and change in share count. Here is how these factors correlate with the future performance:
Revenue Growth
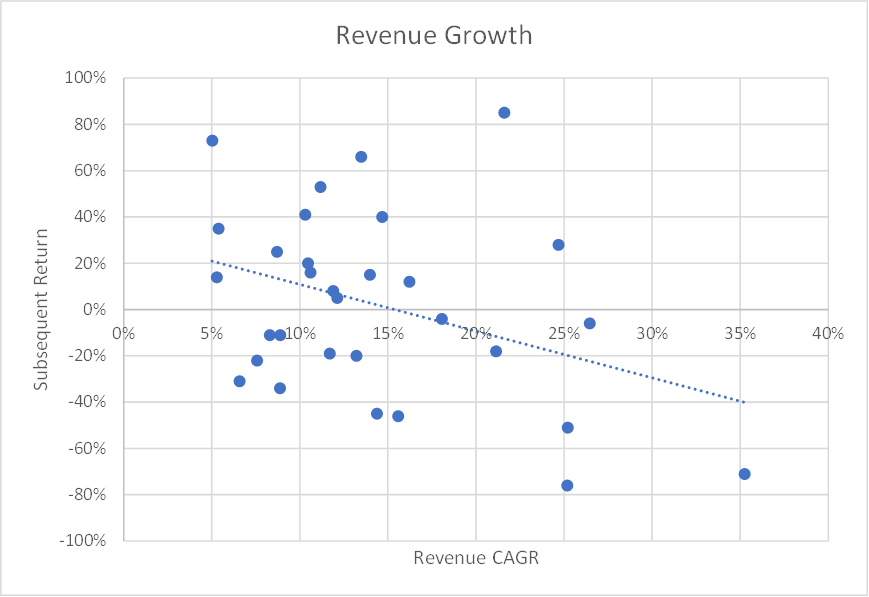
Although the data is noisy, there is a clear tendency for the shares with the highest revenue growth to underperform. This suggests that high growth rates are unsustainable. Although they may miss a few further winners, investors may want to avoid companies with long-term revenue CAGRs above 15%.
Net margin increase
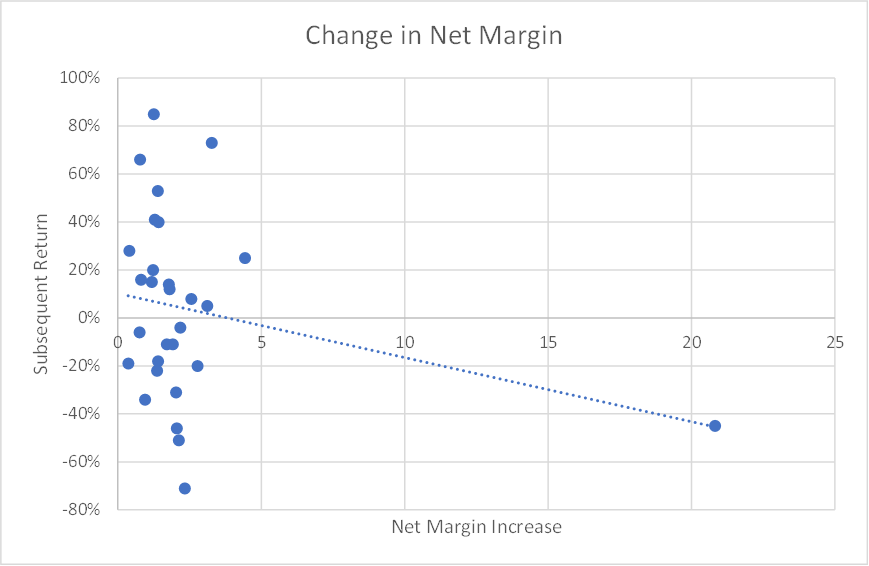
The data here is skewed by one huge increase in net margin in YouGov (LON:YOU) . Excluding this outlier, the relationship is slightly negative, although probably not significant:
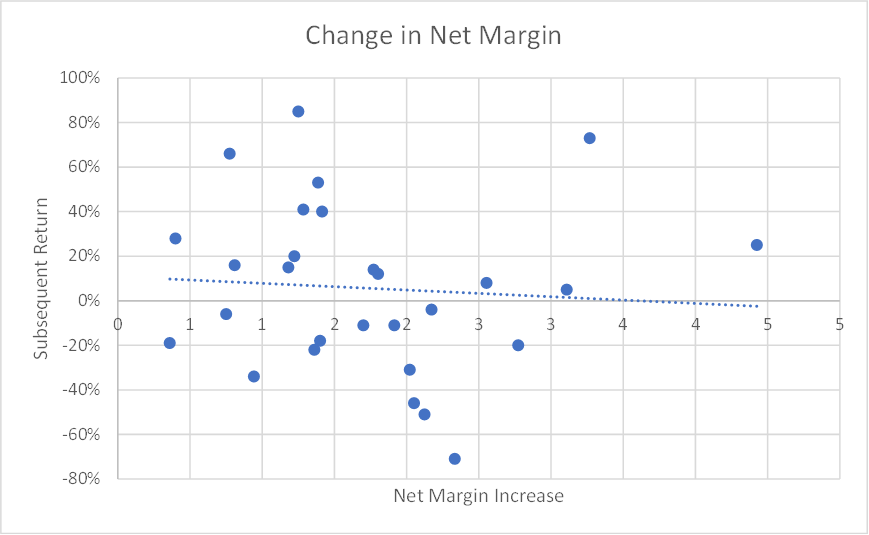
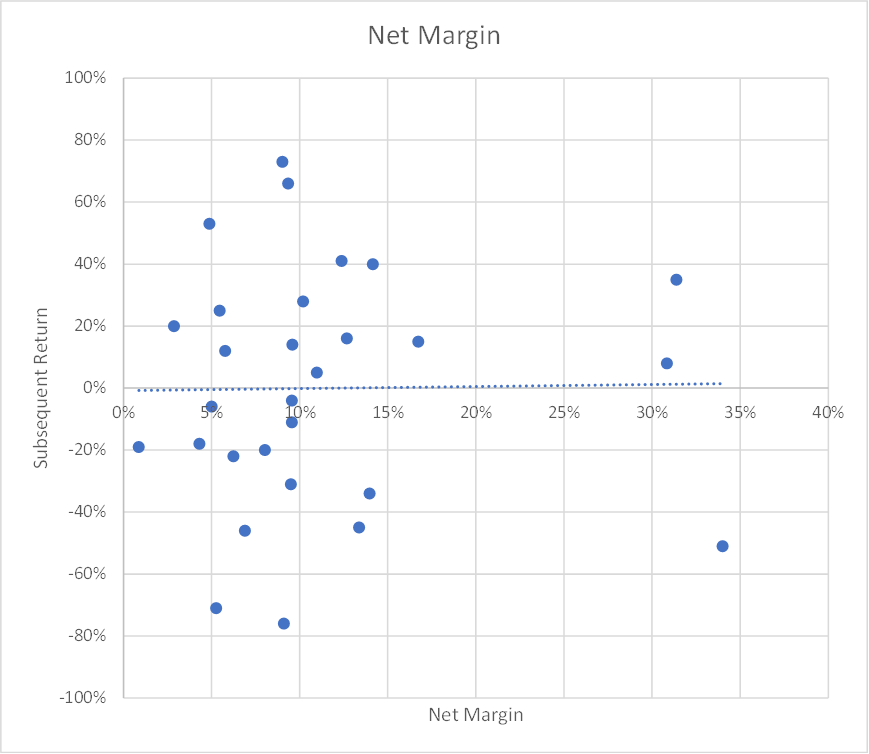
This means that past net margin increases seem to neither help nor hinder future returns. There also appears to be no relationship between the absolute net margin at the end of the study and subsequent performance:
Earnings multiple increase
Contrary to the general finding that high multiple stocks underperform, this doesn’t appear to be the case with past multi-baggers:
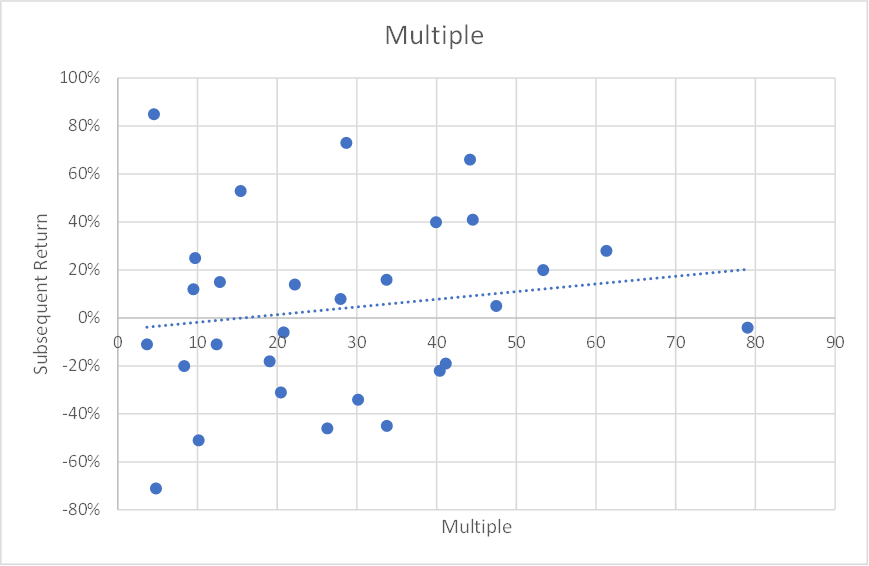
Equally, the change in multiple doesn’t seem to limit future returns.
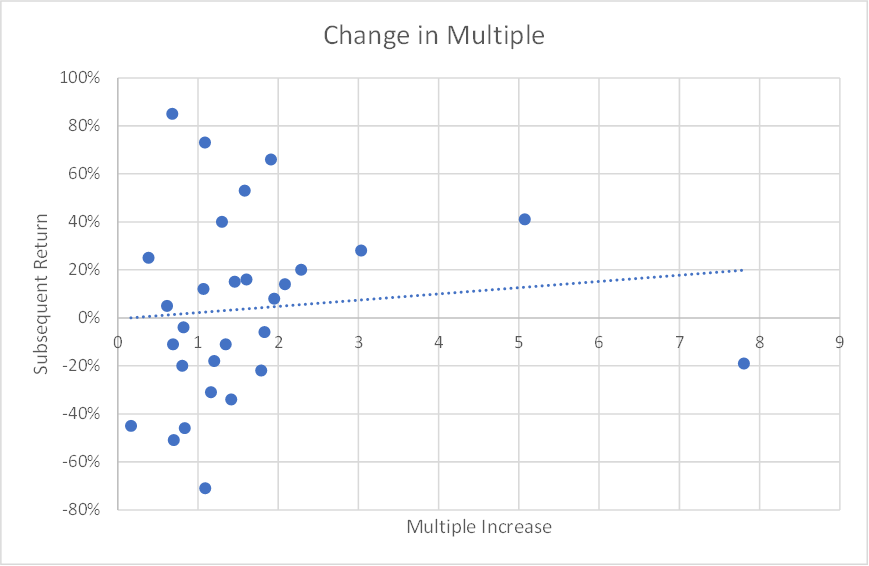
It is not clear enough to suggest that investors should favour high multiple stocks, but they shouldn’t necessarily exclude them.
Change in share count
The data here suggests that investors should avoid companies that have performed well despite significantly increasing their share count.
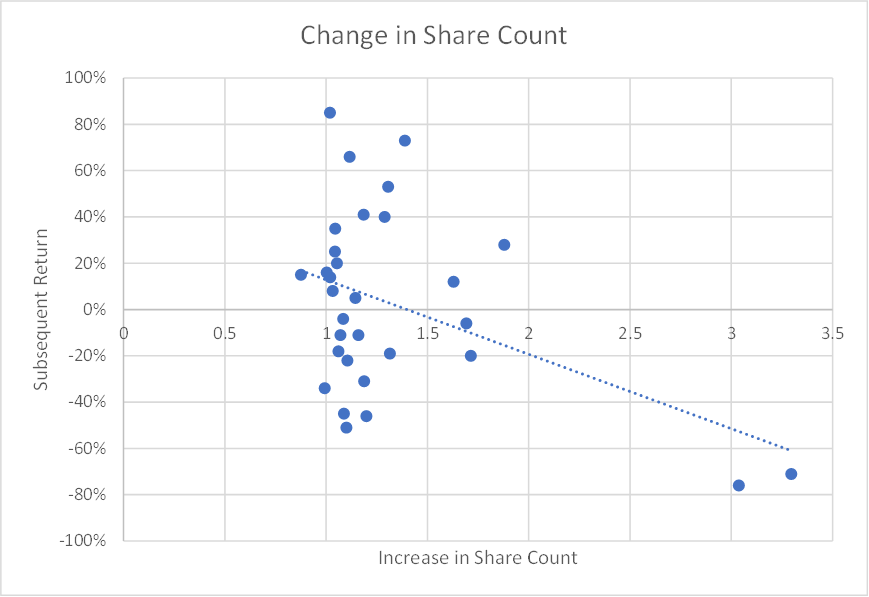
Loss-making shares
It is worth noting that a few multi-bagger stocks are missing from the above graphs. These are the ones that had negative earnings at the start or the end of the study, and hence, the above metrics couldn't be calculated:
Subsequent Return |
|
GGP |
-16% |
SQZ |
-45% |
SLP |
-42% |
TRD |
93% |
PPS |
-90% |
SOLG |
-51% |
Given that most of these were big losers, it seems best to avoid this type of stock, too.
Conclusion
While it may be a little depressing to learn that past multi-baggers are more likely to be future losers rather than winners, not all is lost. Investors will probably do better by avoiding the past multi-baggers with warning signs: share count increase < 2, loss-making, or long-term revenue CAGR >15%. Here is the reduced list:
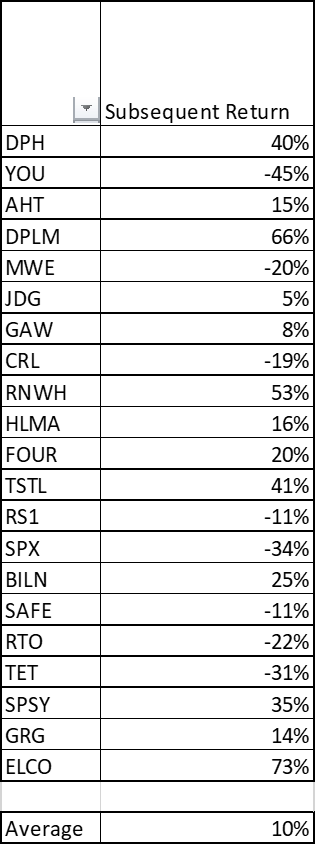
This process doesn’t avoid all the losers but pushes the average into positive territory and is now slightly above the FTSE Allshare. There may be an element of data-mining or hindsight bias in this analysis, and investors may still think it is better to go for an alternative strategy, given that the results aren’t stellar. However, avoiding these risk factors for past multi-baggers gives much better results than investing in all past multi-baggers.
[Disclosure: Mark owns shares in Billington Holdings (LON:BILN) ]
Disclaimer
This is not financial advice. Our content is intended to be used and must be used for information and education purposes only. Please read our disclaimer and terms and conditions to understand our obligations.

27 comments
If looking for shares with Fresh Momentum, I believe that they are best found with the Stockrank style of Turnaround (ie High V & high M with low Q). If trying to avoid shares with Stale Momentum, I believe that they are best found with the Stockrank style of High Flyer (ie High Q and High M, with low V).
Good article.
Received wisdom such as "run your winners" often fails to stand up to those awkward people who actually want to review the numbers!
I'm surprised that people are surprised by this. Otherwise investing would be easy. We would all just pile in to NVIDIA (NSQ:NVDA) and stay there. Regression to the mean is usual, and it is rare than growth can continue unabated.
From a purely mechanistic point of view, I wonder if selling when the stock rating fell below 80 would have made a big difference on the way down....?
And anyway, who needs multibaggers? If I do 20% a year for ten years I've 6-bagged my whole portfolio!!
NVIDIA (NSQ:NVDA) is both a good example of mean regression, and a bad example of worrying about mean regression over the long term. It has multi-bagged at least 3 times in a significant way, all in the last 10 years, and arguably a total of 4 or 5 separate occasions from listing. In between those gains it has lost 50-66% of its value.
One can analyse in all sorts of ways but it is always a judgement call on allowing the market to overprice but having a good idea about market assumptions (these are often public in fund holder interviews and suchlike) such that if one or more of these factors deteriorates one has a trigger to exit. Two questions I always ask are "am I looking to buy more and or actually buying more?" and "why are other people buying?". An existing multi-bagger that has a reasonable path to decent gains over the next year is not one to dispose of necessarily. On the other hand one that prices in sales and margin performance that the company will struggle to match, for just potential market matching gains is one to sell down. These are somewhat subjective, though there will be significant support from metrics and analysts.
Mark. Thank you for a very interesting article. Please can you define Fresh Momentum a bit more precisely? Firstly are we talking about momentum which is only based on the share price? And what is the optimum degree of "Freshnesh" ? Eg share price rising in the last week / month / 3 months etc. And is there any data on whether relatively small share price increases are better than relatively large share price increases?
Sure. Research affiliates simply say:
Stocks that have exhibited strong momentum for two or more years are both very expensive and tired; this is stale momentum. Momentum essentially fails, especially net of trading costs, for stale momentum companies.
So this would be stocks that have been amongst the top winners for a few years. In stockopedia terms, we could say ones that have a Momentum rank above a certain level for two or more years. I've not done any back-testing to see the precise danger level, but my feeling would be in the region of 80 or 90 Momentum Rank.
When I tried to look at what to do with a dropping Momentum Rank as a follow up to "Surfing the StockRanks" I found that investors would often be better off selling high QM, low V stocks as soon as the Momentum rank drops just a small amount, say below around 85. This is a surprising small drop to be optimum to sell, and perhaps represents that stale momentum in action.
Thank you Mark.
Thanks for another brilliant article Mark.
As a buy and hold investor I must admit I find it a slightly uncomfortable and challenging read!
This is just a personal view I am putting forward and I’m not criticising anyone else’s approach – in fact I agree with everything you and other posts have said.
I think by necessity most books on market beating performance gravitate to a ‘factor’ or ‘Stockopedia ratio’ style of investing which is a good thing because a) it works, b) it can be backed up with hard evidence, c) it takes the emotion out of investing and systemises it for repeatability.
But personally I think the ‘coffee can’ style of investing favours a more subjective, less data driven approach. That doesn’t get written about so much because it’s difficult to write a book talking about long term market trends which have yet to unfold e.g. AI, or the nuances of a CEOs character and behaviour.
So for example I have managed to sell out of Petrofac at 1105p, Ted Baker at 1704p and the vast majority of my Dotdigital shares at 241p (obviously like all of us I don’t get it right every time). But if you asked me why I made those decisions, it wasn’t anything to do with trailing stops or operating margins etc, instead it was my composite view of multiple factors unique to that company’s situation at a point in time e.g. their position in their market, CEO behaviour. Quite often it’s things companies don’t say or do that lead me to start worrying.
I’m just putting forward another angle on the problem here, and I accept that my approach isn't necessarily repeatable and therefore of interest or suitable for other investors.
If possible can you give a couple of examples of times you used 'dog that didn't bark' information.
Yes I am happy to give examples to illustrate how I notice and analyse when a company doesn’t say or do something I would expect it to, and how that can set me worrying. Sorry it’s a bit long winded but Iam rushing a bit and I wanted to give detail so that I could fully answer your request to elaborate.
I should emphasise management commentary is just one piece of the jigsaw that makes up my analysis – I would rarely make a decision solely based on something not being said. Nevertheless I do believe that things not being said or done can be a good early warning sign of trouble.
Quite often it can take the form of not giving an outlook in a statement. This was a big part of my decision to sell Petrofac at 1105p in September 2014. Petrofac had recently released interims for 2014 and conducted an analyst call to accompany them. And yet despite the new FY being just 3 months away nothing was said about the outlook for 2015 in the announcement or call. In the call one analyst asked about 2015 and was told that this would be given at the 2014 finals (which ofcourse would be published 3 months after period start!). I just thought that was suspicious and could only mean one thing; it wasn’t looking good. This came after a long period of not announcing contract wins (the life blood of PFC’s business) so I decided to sell.
A similar thing happened recently with Good Energy. In November last year there was a lot of excitement in the analyst community about profits doubling in 2024 and doubling again in 2025. And yet in the FY23 IMS released on 28th November with the SP at 350p Good said nothing whatsoever about 2024. Why would a company with such a rosey short term future beckoning not take the opportunity to make reference to that future, at least in passing? I sold on 8th Feb at 280p and that ‘gap’ in the FY23 closing ims was a part of the reasoning for my decision.
Another example from last year is Big Technologies. Big Technologies developed a little habbit of putting this phrase in the outlook section of their results; ‘Active engagement continues with a number of potential new customers….’ This phrase appeared in the 20/21 finals and in the 21/22 interims, but it was dropped from the 21/22 finals released on 29th March 23. I was worried about this softening tone because at the time, the market was expecting 2023 to see Big Technologies win a large contract with the MOJ. I thought it was odd that at the very moment that I would expect that ‘active engagement with potential customers’ was about to bare rich rewards, the phrase was dropped and replaced with….. nothing. When there was still no news on the MOJ contract at the interims in September and with the outlook again pointedly not mentioning ‘active engagement with potential new customers’ I sold at 215p.
An example of something not happening rather than not being said might be Dotdigital (I still hold some shares in Dotdigital and I still see a bull case for them). It has been suggested that the UK market is currently cheap in global terms and that UK companies are vulnerable to foreign takeovers. Dotdigital is a highly profitable international growth company with no controlling shareholders and it could be acquired today for less than half of the valuation it achieved at it’s ATH. And yet, there have been no bids from larger US competitors. I think that’s strange and worrying. Someone like Intuit could gobble Dotdigital up in a moment. But the months and years roll by and there are no bids ….. that niggles me and makes me wonder why Dotdigital (at today’s SP valuation) is so unloved by industry insiders.
HHR.
I so agree with you about the need to focus on the key things you mention. It’s so common for investors to over complicate things. My key focus is on updates from the Companies I invest in, and like you I act when there are obvious more negative hints, often by what this time they don’t say what up till now they have always said. e.g like the disappearance of the Outlook statement, or much more vague on Outlook than before. Or no comment on future dividends when up till then always a commitment to increase it.
Example. I bought B&M European Value Retail SA (LON:BME) at 350p ish on the Truss chaos falls. At around £6 and good quick 70%+profit, the Outlook was so vague. So I sold, The share price is now down to £4.26p and has been in a long slow downtrend since then.
This works so well in reverse too.
e.g look for strong hints in an update that the worst is over. Classic example is Marks and Spencer (LON:MKS) which I bought for £1. It’s now more than tripled.
It doesn’t work every time. What does? But the success rate for focusing strongly on news and basic figures is high.
I have had multi baggers ….including the last one ITM Power (LON:ITM) which I bought as a risky fun punt at 40p and held in disbelief as it was (and afaiaa still is) an early stage hope share with minimal revenues and making big losses, as the share soared to £4. I sold then and the nonsense continued all the way to over £6 and a market cap way over £billion…….and it’s now all the way back again.
I also bought Games Workshop (LON:GAW) in 2016 at £4.60. And sold too soon for a modest profit on my sell on an iffy update tactic. So it doesn’t always work! It’s now around £100 and the annual dividend is now around that £4.60 buy price just 8 years ago!
The reason why dotDigital (LON:DOTD) is unloved is that the EPS growth rate has been stuck under 4% since 2020 and with only a small improvement expected for 2024 to 6.6%. It's a bit odd when the turnover has been increasing quite nicely. This is coupled with an FY1 PE ratio of 20 which makes the shares rather expensive for such pedestrian EPS growth.
The concept of 'stale momentum' is fascinating. I think someone who works for stocko noted that momentum tends to persist for ~18 months. also, looking at Richard Crow's approach, the foundation is the emergence of a 'bowl' pattern - this is in effect 'fresh momentum'. He does not tend to hold for the long term from what i understand.
On the other hand, a policy of masterful inactivity can pay off - lexcx - since 1935
Thank you for this article....down to earth. For me, the comments from others have been invaluable and timely, as I am starting to do my detailed research in the middle of every month. I have had a serious loss recently because I have not had my eye on the ball.
When doing a scatter chart, the R squared stat. shows how strong the connection is.
My feeling is that 10 baggers are similar to a club runner expecting to go to the Olympics. Better to aim for achievable goals. Modest but consistent gains will compound over time.
Mark,
Excellent article. I too was intrigued with the 2020 Multibagger study and back in Oct 2020 formed a £1000 each dummy portfolio with the 17 UK multibaggers (£17K in total) . Their composite valuation to date is shown below....
The previous multi-bagger portfolio preformed well for the first year peaking at £20K, but has since halved in value to £10K. This outcome surprised me and made me question a conventional buy and hold statagy.
I have since moved to Quality/Value + Momentum based approach. Buying Momentum winners and cutting Momentum losers has worked well, and particularly well since November 2023
Mark,
I looked up the 2017 Rob Arnott/ Research Affiliates paper you mentioned regarding Fresh and Stale momentum. Seems that previous (multibagging) winners need a strict sell strategy if/when they lose Momentum
......Momentum can be divided into fresh and stale momentum, with very different results. Stocks that have exhibited strong momentum for 2 or more years are both very expensive and tired; this is stale momentum. Momentum essentially fails, especially net of trading costs, for stale momentum companies.
Successful momentum investing is at least as reliant on its sell discipline as on its buy discipline. Most factors decay—they peter out over time—but they don’t turn against us. Momentum is different. It reverses after a few months, eventually giving up all of its gains and then some, for those who do not reverse their positions in time.
So buying previous multibaggers may create additional Alpha, unless and until they start to become losers!
How many of these year long smallcap multibaggers got clobbered by rising inflation and interest rates especially after a period of low rates? Therefore can you sell when velocity of inflation/rate increases starts looking bad... and invest in a profitable index/large or megacaps until inflation hopefully subsides? I guess trying to adjust your holdings according to the market environment?Although i know Paul and Graham have done well stockpicking the last couple of years, although Paul is not a years long holder of shares as far as i can glean.I'm assuming obviously as he could well have sold a fair chunk of those multibaggers as i'm sure there were more than a few profit warning clangers along the multibagging way.Iit's always easier said than done trying to predict or just selling at the first sign of increases in inflation and rate hikes as a stockpicker and/or investor obviously too.
Excellent piece of research. Thank you
Is this just a UK phenomenon, or could it be the state of maturity of the companies you have analysed? By contrast, the US market is jam packed full of multibaggers that have gone on compounding for decades. And, to be fair, there are a few UK ones, just not many.
The easiest ting to do is either sell a stock when it falls below 100MA or replace it with a stock showing greater momentum. Momentum doesn't last forever
I'm playing with trailing stop losses, though only on the shares that I hold in profit, basically relying on positive Momentum while cleaning out the kennel.
For me the most interesting observation is this: Over very long periods, stock market performance tends to be dominated by a few big winners, whereas the majority of stocks produce mediocre returns at best
Maybe the reduced chance of a stock being a multi bagger is countered by the outsize returns that a multibagger would bring ?
The Kenny Rogers "The Gambler" song forces its way into my head when I read this question and taking a closer look at the lyrics there is a read across into the investing world!
Hendrik Bessembinder's research:
We study long-run shareholder outcomes for over 64,000 global common stocks during the January 1990 to December 2020 period. We document that the majority, 55.2% of U.S. stocks and 57.4% of non-U.S. stocks, underperform one-month U.S. Treasury bills in terms of compound returns over the full sample. Focusing on aggregate shareholder outcomes, we find that the top-performing 2.4% of firms account for all of the $US 75.7 trillion in net global stock market wealth creation from 1990 to December 2020. Outside the US, 1.41% of firms account for the $US 30.7 trillion in net wealth creation.
https://papers.ssrn.com/sol3/p...
timarr
That is astonishing. So outside the US we are looking for a 1 in a 100 shot to make any real money. I had no idea the odds were quite so stacked against us (if asked for a guess I would have said maybe we had a 1 in 20 chance). Hopefully we can improve our odds with some sensible criteria applied to our choices, but still we are fighting against the tide here. No wonder index funds beat the vast majority of active managers - you have to own everything to beat those odds. It would be fascinating to see this study re-run with some of the more basic filters applied to the sample to screen out blue sky stocks, speculative loss makers etc. and see what the figures look like then (I expect probably improved but not that much better!).
Hi BIACS
That is astonishing. So outside the US we are looking for a 1 in a 100 shot to make any real money.
Yes, it was a bit of an eye opener when I read it (via Ballie Gifford's quarterly magazine).
However, it also chimed with an earlier article I'd read by William Bernstein:
http://www.efficientfrontier.c...
In this he specifically debunks the idea that 15 stocks are sufficient to achieve effective diversification by noting that if you miss one of the handful of superstocks that drive the market you'll badly underperform.
My take from all of this was to continue running my winners but to take profits as they rise. It can be a bit frustrating when they carry on rising, but recycling the proceeds into higher yielding stocks and investment trusts with lower returns keeps my cortisol levels down.
Higher income and lower stress is my preferred approach these days!
timarr
Thank you for this Mark although on first reading, as a long term investor, the conclusions are depressing. A multitude of macro and geo- political factors coupled with the pace of technological and societal changes creates a very uncertain future. Everything is pointing towards a revision of my holding periods to a 12 - 18 month time frame.