Should investors always avoid lowly ranked stocks?

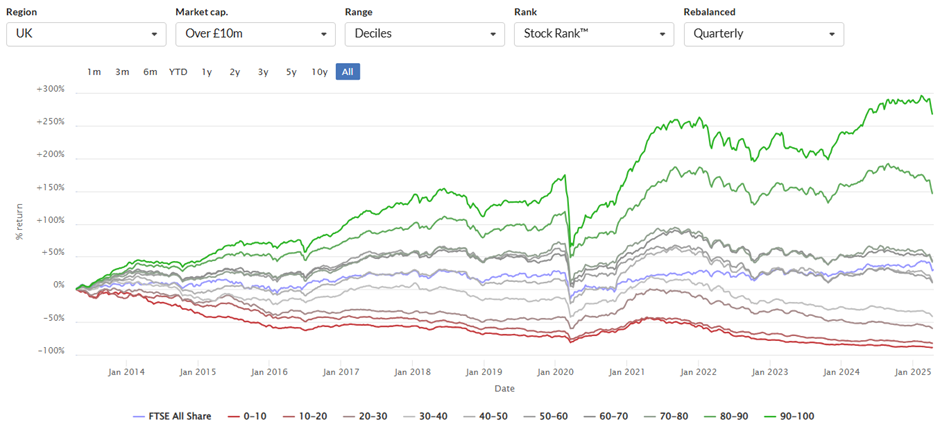
Should investors always avoid lowly ranked stocks? sounds like a question with an obvious answer. After all, Stockopedia subscribers will know that the lowest-ranked stocks on the QVM measure, which we often call Sucker Stocks, have a terrible track record:
However, in a recent article, I raised an uncomfortable possibility. Since the lowest-ranked stocks on each of the ranks perform very poorly, should investors avoid the lowest-ranked stocks for each of the individual Q, V, and M ranks? For example, here is the long-term chart of the performance of the Value Rank in the UK:
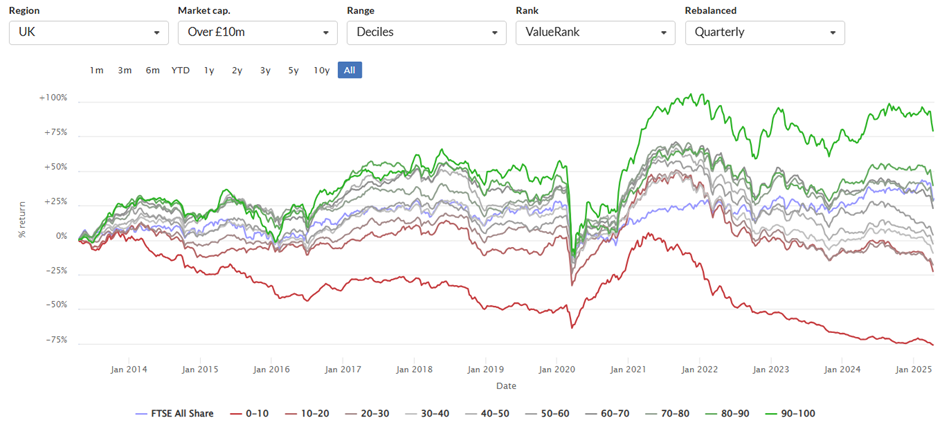
As expected, the average stock with a Value Rank below 10 performs terribly over the long term. Included in that set of stocks will be some real stinkers, such as persistent loss-making companies with no asset backing. However, there will also be some High Flyers, stocks with high Quality and Momentum Ranks that have risen so far that the Value Rank is now very low. Do these stocks buck the trend and keep performing, or does that low Value Rank drag them down like the rest of the lowest-ranked stocks? After all, Momentum investors need to be wary of “Stale Momentum”, where stocks have Momentum for so long that corporate mean reversion is the more powerful effect.
Alex has helped me answer this question, together with the equivalent questions for the other “crossover” styles: Should Contrarian (high QV) Investors avoid stocks with a low Momentum rank, or should Turnaround (high VM) investors avoid low Quality-ranked stocks?
The test
To answer these questions, Alex has backtested investing in an equal-weighted portfolio of each “crossover” stock style. For technical reasons, using the Stock Style classification itself makes the effect hard to measure. So, instead, we have gone for a simple setup. To measure the impact of Momentum on Contrarian stocks, we looked at the set of stocks that are greater than 75 on both the Quality and Value Ranks and asked the question, how do portfolios of the different quartiles of Momentum Rank perform? We go back 10 years with annual rebalancing. The same goes for the other “Stock Styles”.
The results
Contrarian Stocks
For contrarian stocks, the Quality and Value Ranks are high (>75), and we look at the impact of the varying Momentum Rank on these stocks:
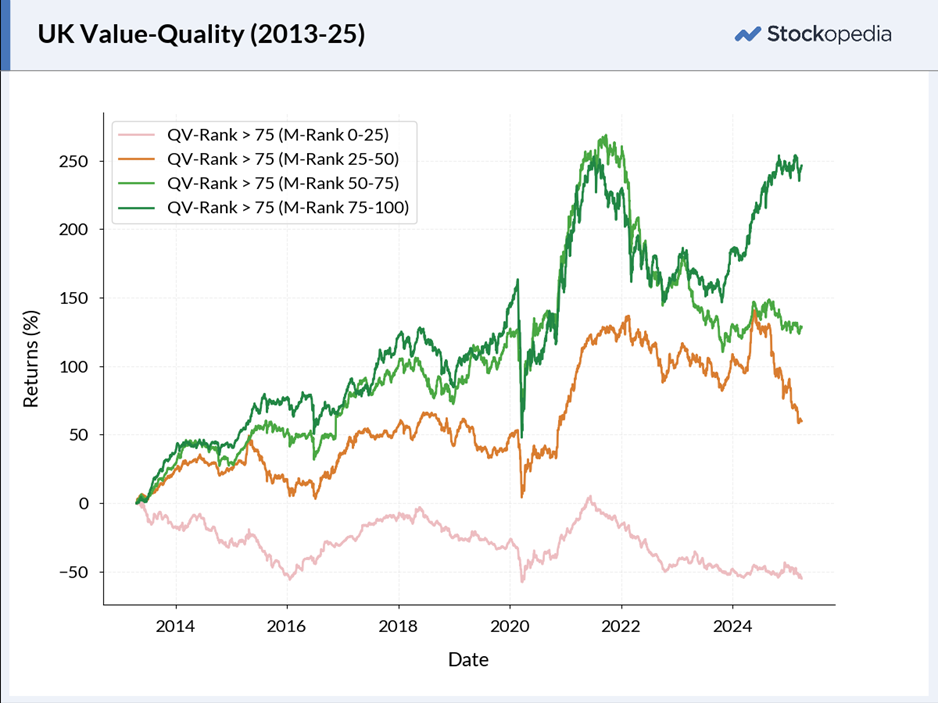
In this case, the outcome of this backtest is pretty clear. Investors who prefer to look for Quality-Value stocks would benefit from paying attention to the Momentum rank. A high Momentum rank isn’t a guarantee of success, but over almost all periods, investing in cheap, high-quality businesses that have poor Momentum leaves investors swimming against a strong tide of underperformance.
Turnarounds
For turnarounds, the Value and Momentum Ranks are high (>75), and we look at the impact of the varying Quality Rank on these stocks:
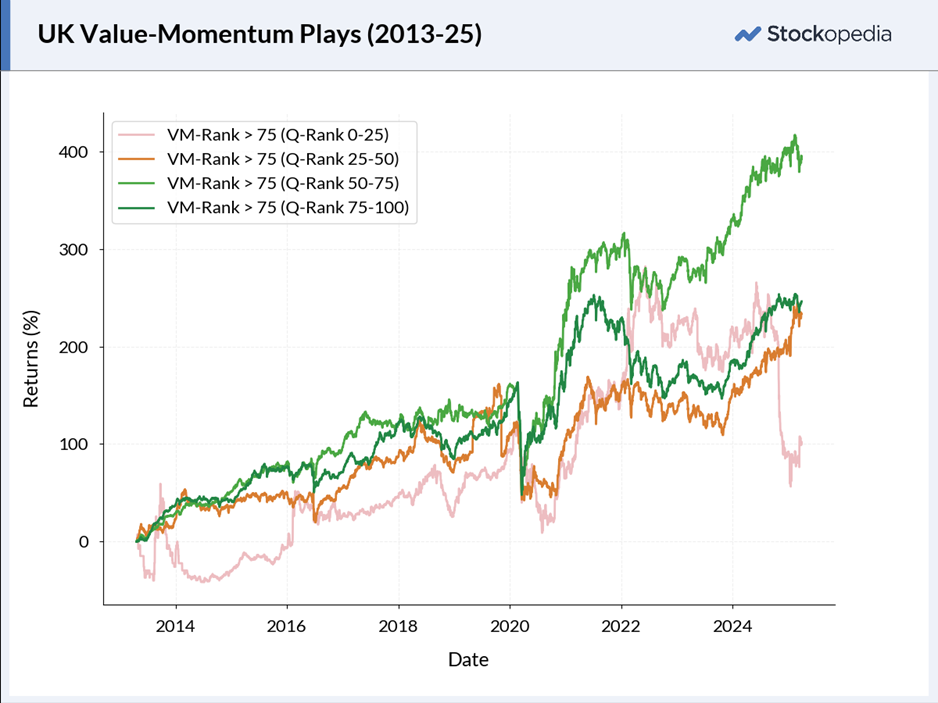
The impact of the Quality Rank on turnaround stocks is less clear-cut. The lowest quality stocks come out worse in this backtest. However, the bulk of the underperformance came in the latter half of 2024. Low-quality stocks also had limited periods of swift outperformance. The best quartile was actually the above-average but not great quality companies. I’m not sure the outperformance here is consistent enough to conclude that turnaround investors will always do badly in low-quality stocks. However, it looks like they may have a less volatile time by focusing on above-average quality stocks, and that in itself has some value.
Including the Quality Rank may also protect turnaround investors during the worst of times. Here is a zoom in on the period from 2022 to now, which highlights the poor performance of the worst quality stocks after the UK budget:
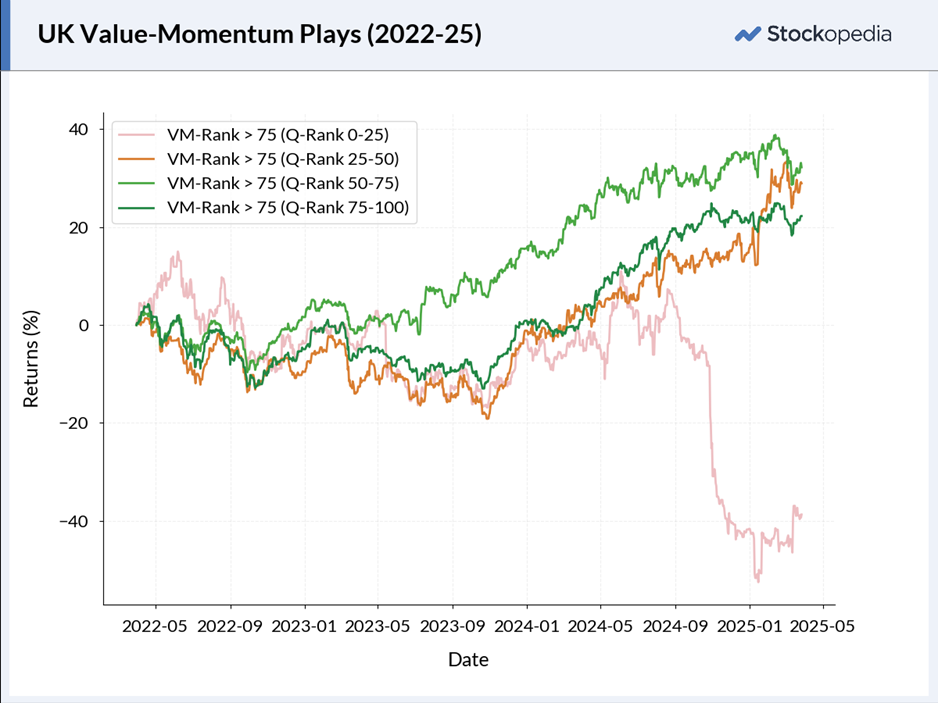
Again, this isn’t a huge sample size, so it may be a coincidence, but there is probably nothing wrong with being cautious and avoiding the worst quality stocks during challenging times.
High Flyers
For High Flyers, the Quality and Momentum Ranks are high (>75), and we look at the impact of the varying Value Rank on these stocks:
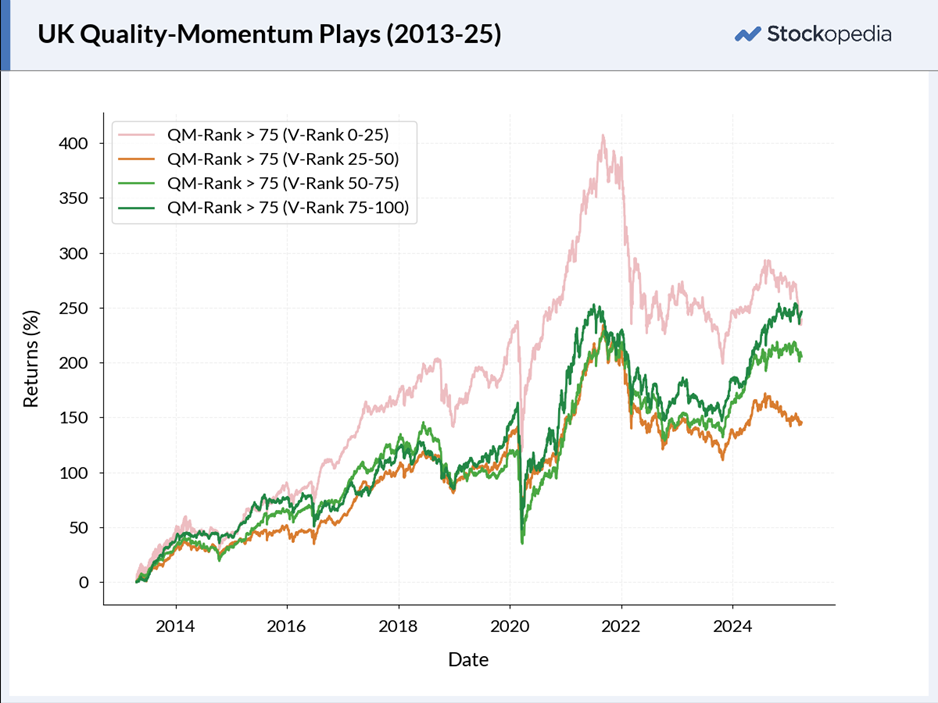
Again, this is a more nuanced outcome. The lowest Value-ranked High Flyers came out on top. However, the bulk of that outperformance came during periods where investors were particularly enthusiastic about “compounders” and seemed willing to pay up for business with such characteristics, i.e. 2016-2018 and 2020-2022.
Again, zooming in to more recent times, it seems that in the current markets it may be wise to avoid the lowest Value-Ranked high flyers:
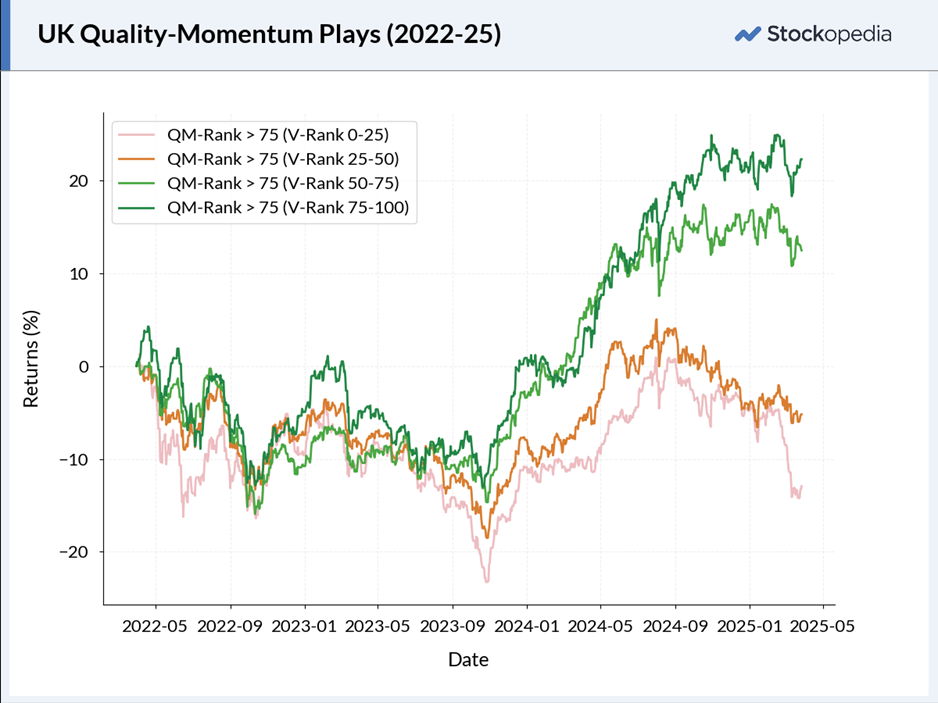
Overall, the conclusion here is perhaps not as strong as the others. It appears that the Value Rank is not always a good indication of High Flyers to avoid in all market conditions, but may well be worth paying attention to in more difficult market conditions.
Why not just invest in Super Stocks?
While writing up this article, there is a voice in the back of my head (possibly Ed’s) asking why bother with this analysis when one can invest in Super Stocks, which have reasonable scores in all three ranks? I think there are a few reasons:
- Most of us have a preference for a particular type of investing, and it often aligns with one of the “crossover” styles better than the Super Stocks. Personally, I look at the list of current Super Stocks and see some with forward P/Es of around 30. I’d struggle to buy those, no matter how strong their Q and M Ranks.
- Most of us are not purely quantitative investors, so we are not buying and selling hundreds of stocks on a specific date. This means that the Ranks of the stocks we invest in will change over time. What started as a Super Stock may become another winning style, such as High Flyer, but that doesn’t mean we should sell. I once wrote an article about Surfing the Stock Ranks, with the thought that an investment could benefit from several different styles during a successful investment journey.
- The Super Stocks can tend to cluster around certain sectors. Financials, Industrials and Consumer Cyclicals comprise the bulk of these at the moment. People businesses are often rated highly by the algorithms but rarely by the market, for good reasons. Therefore, restricting ourselves to only Super Stocks may lead to missing other opportunities, even if the core principles are sound.
Conclusions
This has been a very valuable exercise for me because my preferred style is investing in Contrarian stocks. Here, the data suggests a clear course of action. On average, I will do better investing in these types of stocks if I don’t buy them while the Momentum Rank is very low. For the other “styles”, the outcome is not as obvious. It seems Turnaround investors may get smoother returns by only investing in above-average-quality companies. Finally, it seems that investors in High Flyers would benefit by looking at the Value Rank during more challenging market conditions, but not during boom periods.
Addendum
While it appears that the Value Rank doesn’t always indicate when a High Flyer is no longer a good investment, there may be better indicators of when to avoid these. Anecdotally, it seems that selling when a High Flyer becomes a “Falling Star” is too late. Take investor favourite Warpaint London (LON:W7L) as an example. This made investors a lot of money as the shares went up 6x between mid-2022 and mid-2024:
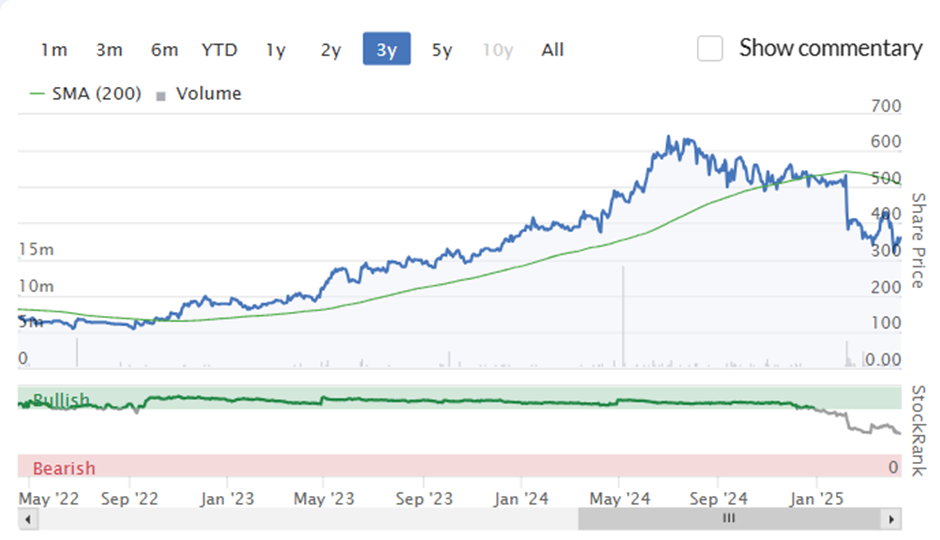
By the end of 2022, the company had high returns on capital and good fundamental momentum. However, it never looked cheap on many metrics, so this was classified as a High Flyer by the Stockopedia algorithms. Further fundamental momentum became share price momentum, and the company remained a High Flyer. It stayed there until a share price fall to £4 reclassified it to a neutral rating in mid-February this year. It had become a Falling Star by the end of February, by which time it had already lost investors around half their money from the peak. Of course, it may still be worth selling now as its current Falling Star designation is a losing Stock Style. However, in this case, it would have been better to exit before the Stock Style changed.
I don’t think any investor consistently manages to get in at the bottom and out at the top. However, if it is possible to find better signals that allow investors to exit a High Flyer before a stock gives back most of its gains, that would be great news for investors in such stocks. I will be looking for these indicators in a future article.
Disclaimer
This is not financial advice. Our content is intended to be used and must be used for information and education purposes only. Please read our disclaimer and terms and conditions to understand our obligations.
8 comments
Let's look at Chart 2 (Value Rank by decile, rebalanced quarterly - apologies for readers pre-edit, I had charts 1 & 2 mixed up)
The top and bottom deciles clearly diverge significantly over a decade, but the remaining 80% are all clustered quite closely in the -25% to +50% band.
A stock paying a 4% dividend yield will generate a 48% compound return over decade, even if the price stays static. So a stock that maintained a constant poor ranking for a decade but paid a consistent divi could have its performance understated here by nearly 50%?
Without factoring in income it is very difficult to have much confidence in what that chart is telling me about deciles 2-9. You have this strange situation where historic dividends do get factored into some of the algorithm calcs (dividend yield being an input into the Value score calc), but dividends are completely excluded from the "performance" measurement. Then you have the problem of how ex-divs may impact quarterly rebalancing - relative stock price performance over a short period like 3 months can be very heavily skewed if you ignore the ex-div effect?
Until stocko bites the bullet and adds total return functionality, all long term performance measures are rather suspect I'm afraid, and it really undermines the credibility of some otherwise excellent work by the writers - no criticism of Mark here, he can't exactly quote performance from another source...
I would be interested in varying the rebalancing period, particularly on the contrarian style. Perhaps a year is not enough time for contrarian stocks with low momentum to recover?
Thanks again Mark & Alex for this very informative detailed research it is very welcome.
When i first used Stockopedia there was little analysis of individual Factors;- Q,V,M,G, so rather than just accepting top SR's i did some similar analysis to this now done by Stockopedia with their full access to the data history.
I concluded that the selection of factor ranges needed to reflect the current state of the Market/Economy. A nicely stable uptrend of the market index would best reward factors of higher quality & midrange V & M. But after a major market fall I homed in on VM>81 with Q >70 & M > 66 looking to find some UP movement.
However no matter what the economic condition buying depended on the Market trend, An Up leg within the Main Market Up Trend and the individual Stock Trend, both decided by a different set of indicators, plus some volume.
Incidentally whilst i was doing all this i did miss out on some sure fire 'SR' stocks during the early period of that lovely run up from '2013 to'18.
From my defined list of stocks the Buy decision was based on Technical analysis and the 'Set up'
Since August '24 I have bought few stocks but held onto a dozen steady climbers decided by my technical analysis. I had a good few losers and a few very big losers, bad news days, also i held onto a couple which, of course, i am sure will make good , but at what opportunity cost.
Non of which i have done would have been possible without Stockopedia aided by some technical analysis as my accounting expertise was no match for their analysts.
Thanks again.
Interesting article, thank you.
There are obvious reasons why low QVM stocks are poor investment candidates. But there are also reasons why a very high rank in any of QVM traits can be a problem.
High quality means consistency, it has a bond / utility type return. Reliable and relatively low risk, a long term compounder, but a modest performer over just one year.
High value includes bombed out risky shares that may or may not survive. A very low PER is usually a red flag.
High momentum can mean the share is / was fashionable and has been bid up a long way above fair value. Momentum could be stale, and after 12 months of price rises is now poised for a sharp downturn.
The above may simply suggest that someone should screen for the highest combined QVM score and then exclude any with individual Q,V, or M score above 90+ . Capture the top 20 on this basis, then hold for a year.
I would be very interested in a screen or article on this.
Does a lowly ranked stock that moves up to merely a medium ranked stock perform better than a stock that's always been (for example) highly rated?
i.e. does change, and rate of change, matter?
Thanks for that.
What is the record of stockopedia in identifying future high flyers for example Greatland Gold?
Thanks Mark. In one of your recent articles you mentioned that you hold CT Automotive (LON:CTA) and I have been looking closer. Obviously it is in the auto industry, which is struggling due to the tariffs but it does look like one of the cheapest stocks in the market. Value rank of 98, PE of 2.8 and excellent quality scores. It is classed as a contrarian stock. They are due to report in May but was wondering if you have any insights as an investor in the business.
I think you're much better using a moving average to exit a momentum stock like Warpaint London (LON:W7L) It pretty much stayed above it's own 50MA for much of the time on it's run so several days under this you know something is wrong. If it was the 100MA for example then do the same