At the start of 2021, I reported that the events of 2020 had “reinforced my faith” in the benefits of having a systematic approach to picking stocks. 2021 was a very different year, but my conclusion is the same. For me, a consistent and objective methodology delivers better results than relying on subjective decision-making.
I wasn’t sure what to expect from the markets in 2021. But as it turned out, last year was the best year in the history of the SIF folio, the systematic portfolio I’ve been running here since 2016.
SIF 2021 performance
The SIF model portfolio gained 29.3% in 2021 (31% including dividends). This was comfortably ahead of the performance of the FTSE All-Share index, which returned 14.6% (18.3% including dividends).
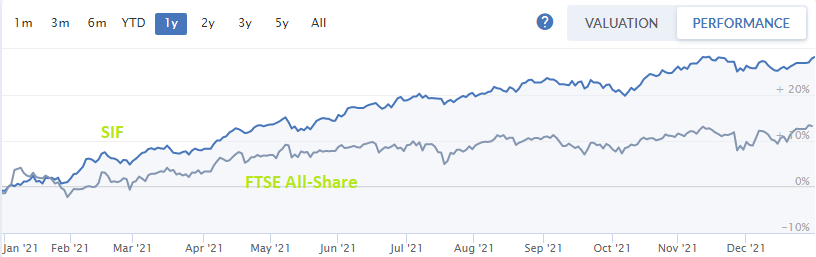
As regular readers will know, I use a portion of my personal portfolio to mirror the SIF. This sub-portfolio delivered a real-money gain of 32.8% last year, including dividends, stamp duty and commission. I see this as reassuring evidence that the virtual trading I undertake here can be translated into real-world results, at least with smaller position sizes.
Putting this gain in perspective
The SIF portfolio is a systematic virtual portfolio I’ve been running since April 2016. Shares to buy are selected from a stock screen which includes rules designed to highlight affordable growth opportunities – a blend of value, quality and momentum. I then apply a manual overlay of diversification on top of these rules, to ensure the portfolio does not become concentrated in too few sectors.
Share sales are triggered when a stock has exceeded a minimum nine-month holding period and no longer satisfies certain tests.
SIF’s 29% gain in 2021 was clearly quite good, but as most investors know, portfolio growth is rarely delivered in a straight line.
Overall, the SIF portfolio has delivered a gain of 77% (10.6% annualised) since its launch in April 2016. The FTSE All-Share index has delivered a 20% capital return (3.6% annualised) over the same period. All of these figures exclude dividends.
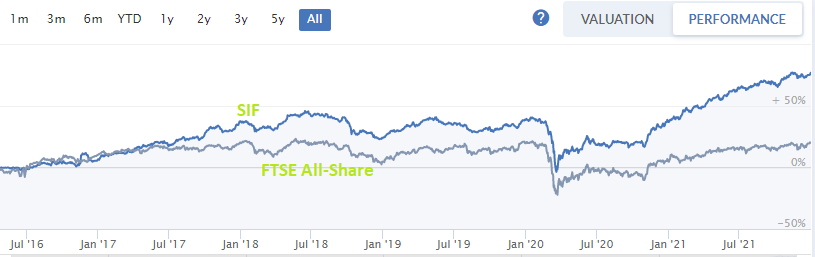
The chart above shows two clear periods of outperformance from SIF in 2017/18 and 2020/21. From mid-2018 to mid-2020, the portfolio only really tracked the market.
My view on this is that the SIF system can struggle to…