SIF Portfolio: Will Oxford Instruments make big gains from nanotechnology?

The market sell-off during the second part of last year has created some attractive value investing opportunities, in my view.
But the majority of these stocks don’t qualify for my Stock in Focus (SIF) screen, because they have lagged the wider market. As a result, they have a 1-year relative strength (RS 1y) below zero and fail one of my screening rules.
Only one stock qualifies for the SIF screen at the time of writing. But if suspend the RS 1y rule, then the screen returns 14 stocks. I’m not going to do this, for reasons I explained a couple of weeks ago.
Instead, I’m going to continue buying shares from the relaxed version of my SIF screen, which allows for a slightly more elevated valuation while still maintaining my positive momentum requirements.
As a side note, I wonder if the tide may soon turn for the market. The wider market is nearly back in positive territory on a one-year view, as measured by my FTSE All Share benchmark:
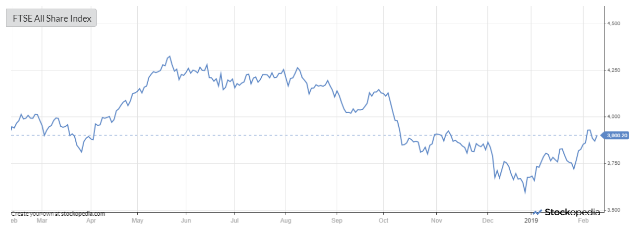
Perhaps the number of stocks qualifying for my SIF rules will soon start to improve. We’ll see.
Measuring atoms with Oxford Instruments
This week I’m going to be looking at high technology tools specialist Oxford Instruments (LON:OXIG). This engineering group started life as a spin-out from Oxford University and has been listed since 1983. It’s now is knocking on the door of the FTSE 250 again, after staging a gradual recovery from poor trading in recent years.
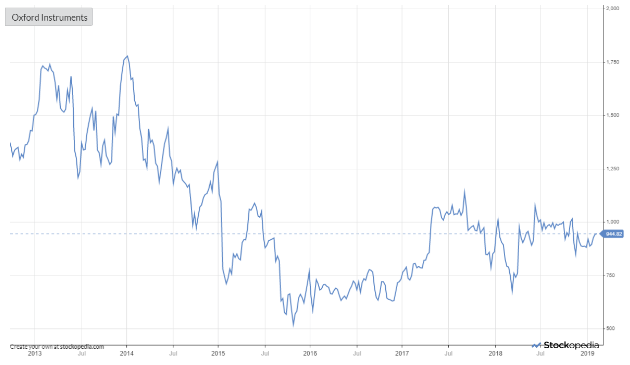
Oxford Instruments describes itself as a provider of “high technology tools and systems … which can fabricate, analyse and manipulate matter at the atomic and molecular level”. The company is active in a wide range of sectors including healthcare, energy, chemicals and aerospace engineering. You can read more about its products on the group’s website here.
Today, I’m interested in finding out if this business is the kind of affordable, growing business I want for the SIF Folio. The company’s Stockopedia profile is of a High Flyer. This generally signifies a stock with strong quality and momentum, but poor value.
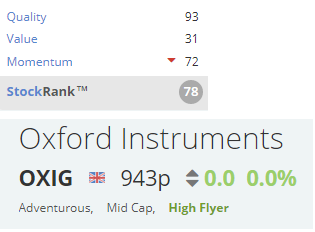
Although High Flyer is one of the styles that are statistically more likely to outperform, I’m not a huge fan. These stocks can suffer painful de-ratings if their momentum falters.
However, in this case I think the stock’s apparent poor value may be due to a quirk in the normalised earnings per share figures provided by Stockopedia’s data provider. Let take a closer look.
Better value than it looks
Oxford Instruments’ ValueRank looks poor at just 31/100. According to Stocko, the shares trade on 36 times trailing earnings, based on FY18 normalised earnings of 32.4p per share. That’s a valuation rating I’d normally expect for an exceptional growth stock.
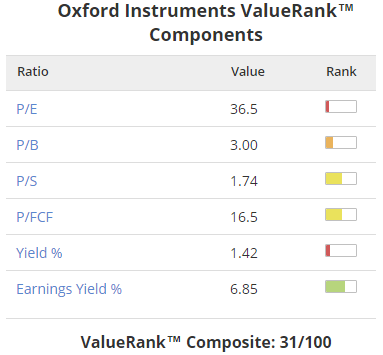
However, a look at last year’s results suggests the stock’s true price/earnings ratio should be lower than this:
Adjusted diluted earnings per share from continuing operations: 56.1p
Unadjusted earnings per share from continuing operations (my estimate): 45p
Statutory earnings per share (including divestment profits): 55.4p
If we take the lowest of these, we end up with a P/E ratio of about 21. That doesn’t seem so extreme and compares well with the stock’s price/free cash flow ratio of 16.5.
My feeling that the valuation looks reasonable is strengthened by the stock’s earnings yield (EBIT/EV) of 6.9%. Although this is below my usual 8% minimum, it’s not especially expensive.
The stock’s Magic Formula ranking of A- seems to support this view. I’m a big fan of this Joel Greenblatt screening system, which focuses on return on tangible capital employed and earnings yield:

I’m further reassured by net debt of £12.5m (or c.£22m including lease payables). Both numbers look modest compared to last year’s net profit of £31.8m.
Overall, I’m comfortable with Oxford Instruments’ value metrics, assuming that they’re supported by decent quality and momentum scores.
Good quality, improving margins
The stock’s QualityRank of 93 suggests a very strong set of numbers.
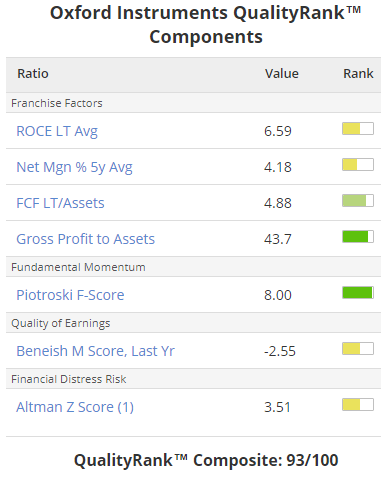
I suspect the main reason for this high quality rank is Oxford Instruments’ Piotroski F-Score of 8/9.
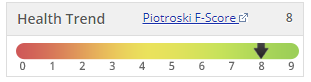
This comprehensive fundamental health score is heavily weighted in the quality rank calculation. I think this is right, as I believe a company that scores well across the boards is unlikely to be at risk of financial difficulties. This reduces the downside risk for investors, which should be a key aim for all of us.
Although the return on capital and net margin scores are not great, I think these long-term averages need to be seen in the context of a turnaround. Recent figures are far more impressive:
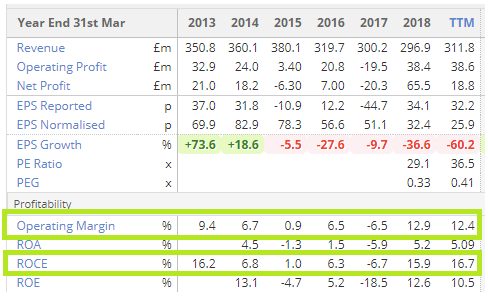
Broker forecasts suggest this improving trend should continue this year.
Improving momentum
A MomentumRank of 72 is encouraging, if not outstanding. But I’m encouraged by the combination of improving price momentum…
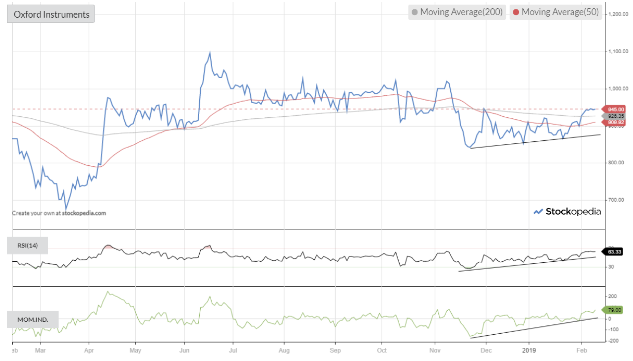
… and rising broker earnings forecasts:
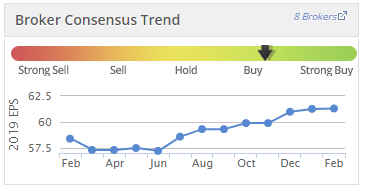
Although the shares slumped following November’s half-year results, I’m not sure the figures justified this reaction. Full-year guidance was left unchanged and the order book rose by 16.3% to £177.9m. Revenue was 11% higher and adjusted operating profit rose by 11.7%, or 16% at constant exchange rates.
These interim figures actually triggered a round of broker upgrades, as you can see from the consensus trend graphic above.
Looking ahead, I think there’s a reasonable chance that the shares will perform well if the group’s recovery continues. Consensus forecasts put the stock on a rolling 12-month P/E of 14.6, which doesn’t seem overly expensive.
I’m comfortable with the overall picture and reassured by good cash generation and low debt. I’m going to add Oxford Instruments to the SIF portfolio and to my own holdings this week, after this article has been published.
Disclaimer
This is not financial advice. Our content is intended to be used and must be used for information and education purposes only. Please read our disclaimer and terms and conditions to understand our obligations.

4 comments
I held this share a few years ago and did well selling when they started to falter which was more luck than judgement ( I needed some money!)
I followed the share through its lean patch and started to reinvest as the price seemed to start to stabilize.
I found in reading your analysis of this share that there were things that I always do take into account in looking at shares and other things, eg is the pe correct?, as being important things that I should look at
Thank you for the lesson "Proffessor"
Me too.
Thanks Roland.
Really appreciate the SIF column.
Thanks Stuart. It's a very interesting project for me and I enjoy sharing it each week. Having to write up my thoughts for public consumption is also a good way of testing the logic of my thinking!
Regards, Roland