Six stocks for contrarian investors

In this week's Stockopedia Strategy Map article, Megan looked at the Contrarian Style of investing, Stocks that are both cheap and high quality. The Stockopedia Screening Tools make it easy to find potential QV candidates. Subscribers can simply screen for companies scoring highly on Value and Quality ranks. For this screen, I pick 90 for Value and 85 for Quality. (The Quality Rank measures a broader range of factors, so it makes sense to be slightly more relaxed on the criteria here.)

As of writing, this simple screen gives 37 results. However, at this point, I will exclude several industry groups. First, I am excluding anything to do with resource stocks. This kind of screen tends to select commodity stocks when they are at their most profitable. Unfortunately, this tends to be at the peak of the cycle. These may well be great investments, but it needs a different mindset to invest successfully in this sector. (I wrote about how to think about this sector here.) The same cyclicality characteristics also affect property and housing stocks, so I exclude these industry segments too.
Likewise, I have excluded Banks and Collective Investments because they require a different mindset to analyse. Perhaps controversially, I have also excluded Investment Banking and Professional and Commercial Services. The reason is that these are essentially people businesses, and as such, they often have low ratings and high returns on capital. This means they can often score highly on the Value and Quality Ranks. The reality is that the "assets" of these companies are the people, and these are not on the balance sheet. Often the returns of these types of businesses go to the employees, not shareholders, and hence they deserve to be cheaply rated.

Finally, I exclude companies whose primary listing is not in the UK.
The resulting screen has just six high-quality, great-value results, each of which is worth looking into in more detail:

Quiz (LON:QUIZ)
Quiz is an omni-channel clothing retailer. As mainly a provider of mainly partywear, the business was severely affected by COVID. So although they also sold clothes online, there was less demand for this type of clothing. Demand has now returned, but many of their concessions did not, as these were located in Debenhams stores. New Look is now their main concession partner. They now have 77 UK concessions and 62 UK stores. They have 6 QUIZ standalone stores and 16 concessions in the Republic of Ireland and franchises in 20 countries.
Apart from the lack of dividends, the StockReport is a sea of green here:
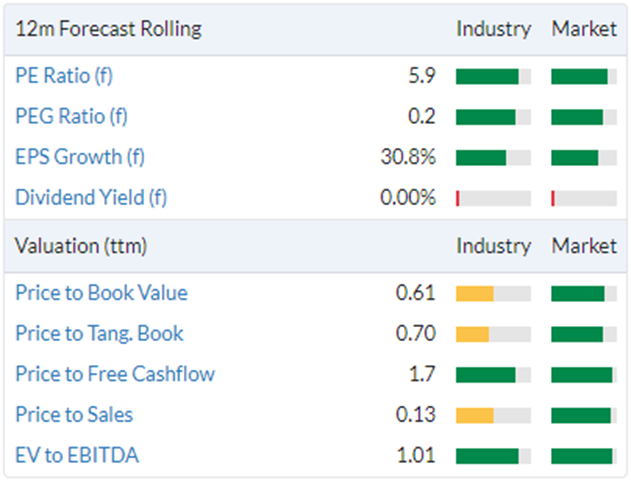
Even the yellow rating for a Price to Tangible Book of less than one is merely a reflection of how cheap some clothing retailers have become compared to their assets. Retail gloom continues to surround this highly competitive area. Unlike many competitors, Quiz has retail stores, which are benefiting from a return of shoppers to the high street. Indeed, the Company's recent trading statement shows UK stores as the standout performer:

However, Quiz was struggling with falling profitability as far back as 2019. Sales dropped off significantly in 2020/21 due to COVID and the loss of their concessions in Debenhams, and have yet to return to pre-COVID levels:
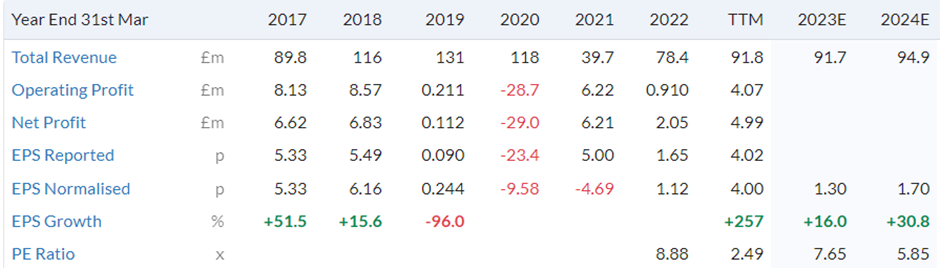
However, it doesn't require a bounce back to previous highs to make a solid investment case. Not only is a forward P/E of less than 6 for the year ending 31 March 2024 a low rating, but the Company also holds significant cash balances:
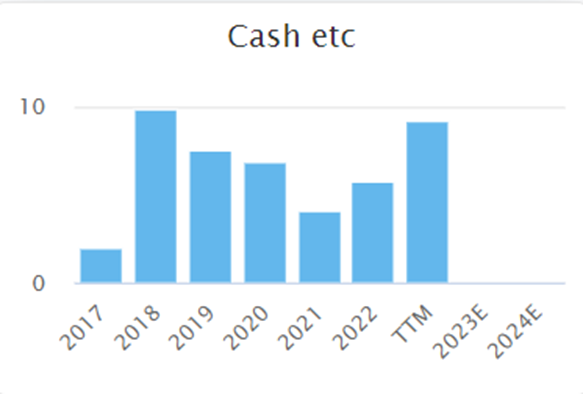
Cash on 31 March 2023 is given as £6.3m, so a bit lower than at the half-year. However, this is still a significant proportion of the current market cap:
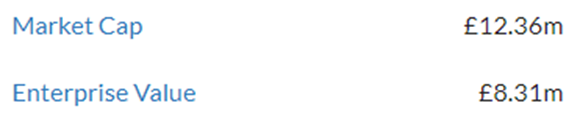
The enterprise value here includes lease liabilities. However, personally, I only consider lease liabilities in an Enterprise Value if they are onerous. Here the net lease liabilities are negligible. No doubt helped by the fact that they put their store operating company into administration during COVID and signed new leases with landlords based on revenue-sharing rather than absolute rent values. While this means a lower operational gearing but much better downside protection, given the current weak consumer sentiment and a cost-of-living crisis, this is a good thing. In its recent trading statement, the company said:
The Board is pleased with the positive performance during the year and that FY23 profit before tax is anticipated to be at least in line with current market expectations.
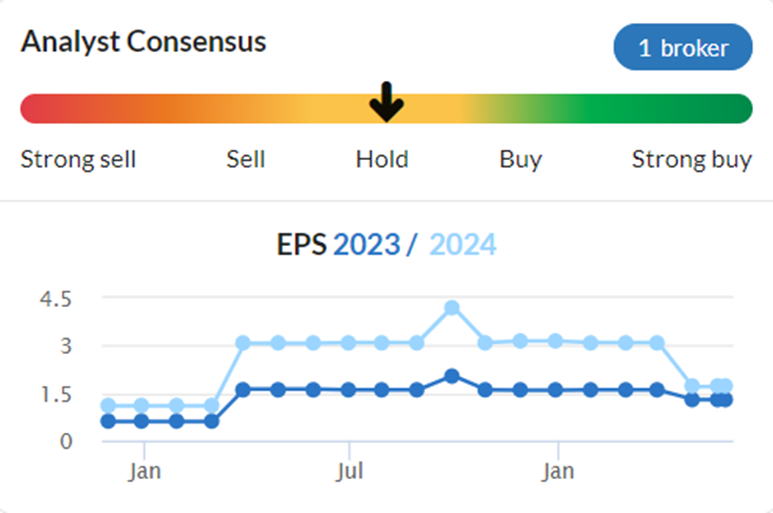
However, the widely reported and significant pressures on consumer spending seen in recent months are expected to continue into the new financial year. The Board believes these external headwinds may impact consumer demand across the Group's sector over the coming months, reducing its visibility for FY24. Their broker has reacted by cutting 2024 estimates:
In terms of quality, the Company's Return on Equity is patchy due to the variable profitability:
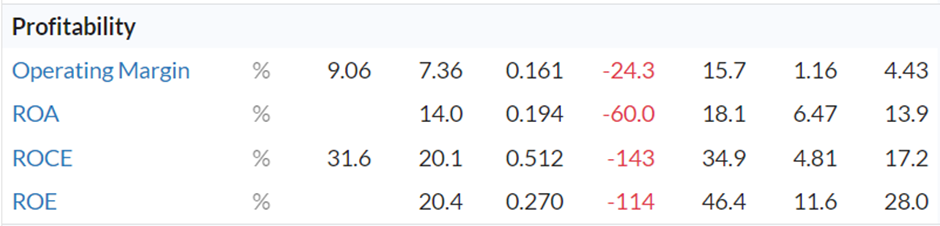
The gross margin here is over 60%, which is very good, even for a retailer. This suggests the Company is able to generate an excellent return on its sales.
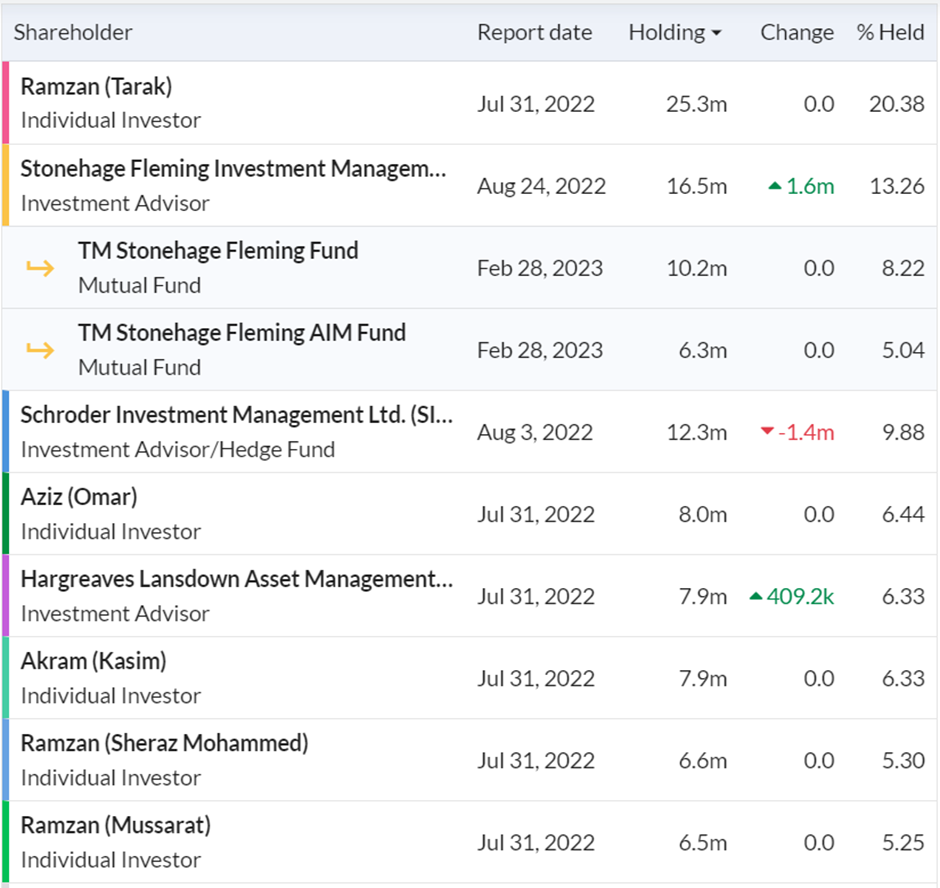
Management and connected parties own over 40% of the Company, which gives them skin in the game, but should not be high enough for a delisting risk. The management also doesn't pay themselves exorbitantly, suggesting their interests are largely aligned with minority holders.
It would be nice to see the profitability be suitably consistent for them to pay a dividend, but this aside, this is a decent company at a very low price.
Robinson (LON:RBN)
Robinson is a manufacturer of mainly plastic packaging. In the last decade, their long-standing UK business has been augmented by acquisitions in Poland, where they now have 2 factories. In February 2021, they acquired Schela Plast, a Danish packaging business.
As expected, the valuation figures look good:
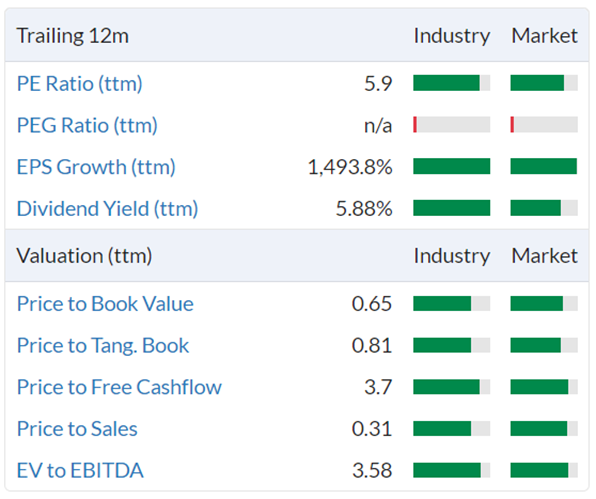
However, the algorithms here may be slightly confused by a lack of 2024 forecasts in the market. 2022 appears to be an exceptional year, and the 2023 estimates for EPS are much lower, despite higher revenue:
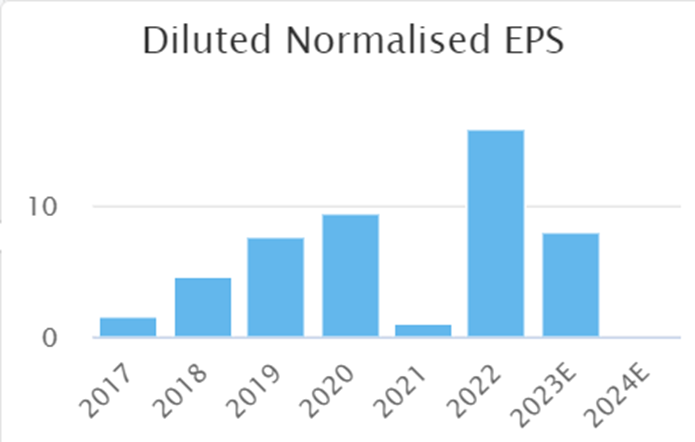
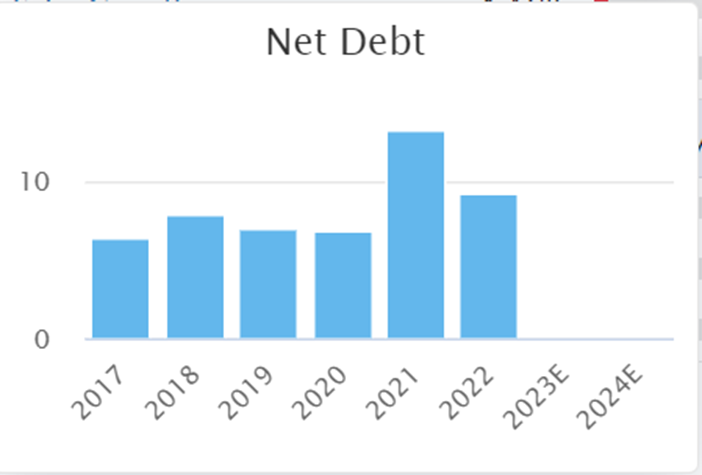
This makes the forward P/E more like 12 and, therefore, less obviously good value. As does the net debt, which at £9m is around 60% of the current market cap.
There are assets that may be able to be realised. For example, the company have the potential for £3.2m to be released from a buyout of its pension fund. And they say:
After undertaking a professional independent valuation, the fair value of the surplus properties is now estimated to be £8.1m. The current net book value is £2.8m.
So the discount to Tangible Book Value may be even larger than reported. A minor sale was announced this week at a small premium to book value. They claim they will receive planning permission and further sales of properties in the coming year, but this seems optimistic to me. They have had this surplus property for many years without achieving a realisation, and current market conditions are not conducive to this timeframe accelerating.
The Robinson Family and related parties make up all of the notifiable stakes on the share register:
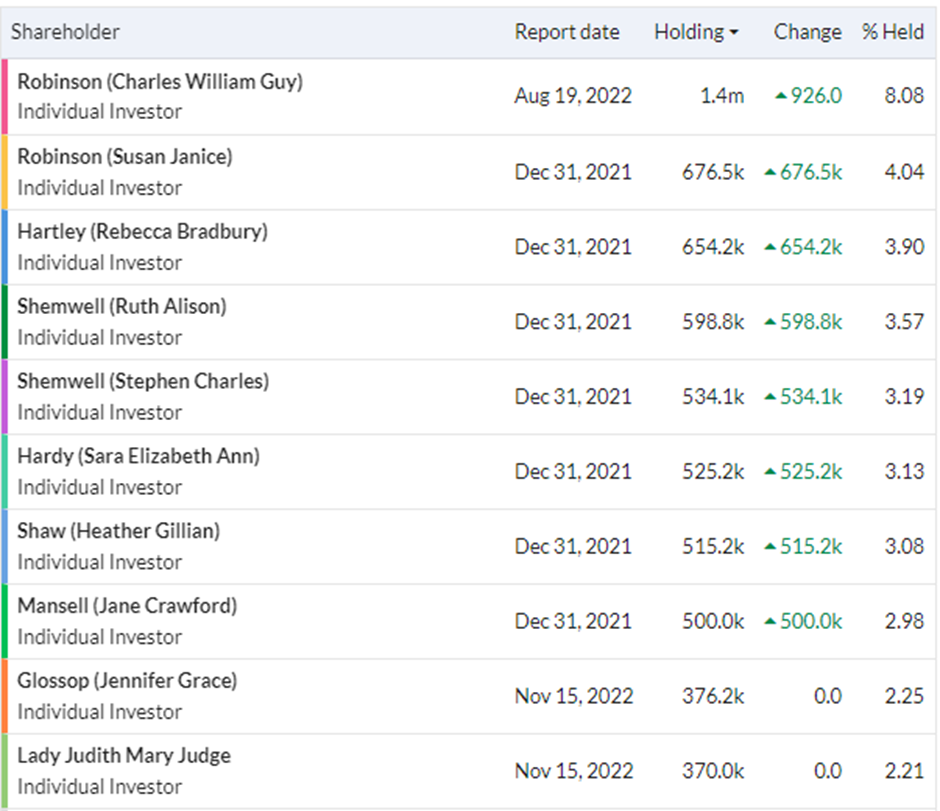
This perhaps explains why the dividend has been maintained even during tough trading periods.
The Return on Capital here has never been high:
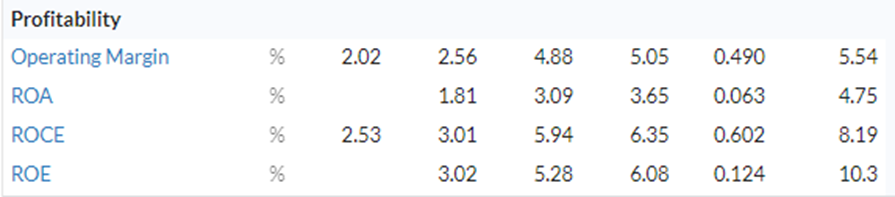
The high Quality Rank is due to the large weighting towards a Pitroski F-Score, which currently stands at 8 out of 9. However, the earnings momentum responsible for many of these positive scores is forecast to reverse in the future, meaning the Quality Rank is likely to drop significantly in the future:
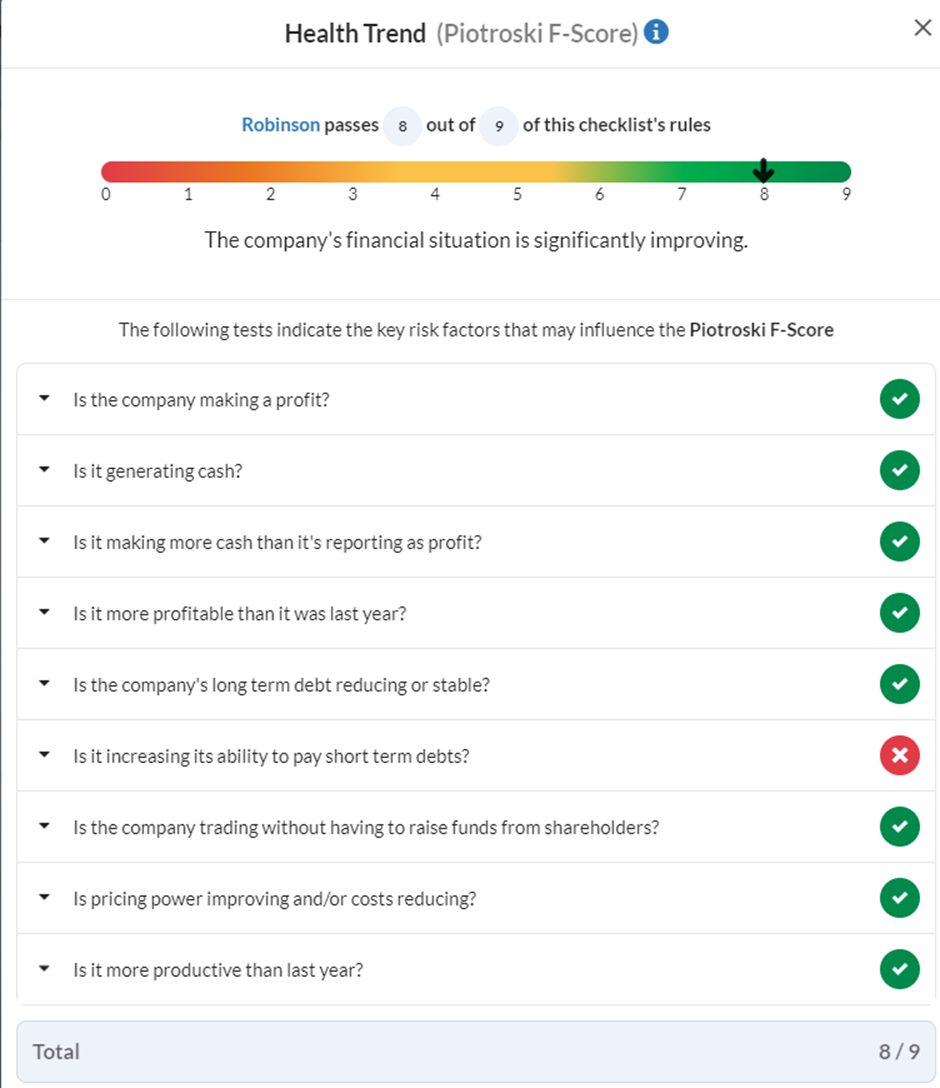
Overall, the Company looks reasonable but is not great value. It will appeal to those who like family-owned firms that pay dividends. However, both the value and quality but not as good as it first appears, and these Ranks will undoubtedly be lower in the future. Investors will also need to take a view on the long-term future for single-use plastic packaging.
SCS (LON:SCS)
ScS is a retailer of upholstered furniture. Investors will no doubt be aware of their showrooms which are present in many local retail parks. ScS tend to focus on the lower end of the market with cheaper price points. While the current economic climate may favour shoppers trading down, ScS's customers are also likely to be more affected by the current cost-of-living crisis. In the recent interim results, the Company recognises these challenges, saying:
The macroeconomic environment continues to be challenging and we are mindful of the pressures faced by many of our customers. Therefore, continuing to focus on our value driven proposition is more important than ever so that everyone is able to create the home they love.
However, they reiterate that they are trading in line with market expectations, which are:
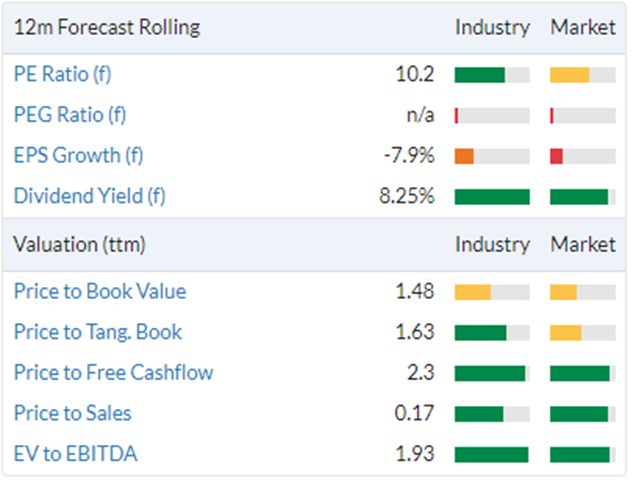
A Price Earnings Ratio of 10 is low but not outstanding for such a business. However, this may well be close to trough earnings for the cycle, and the Company also has a substantial cash balance:
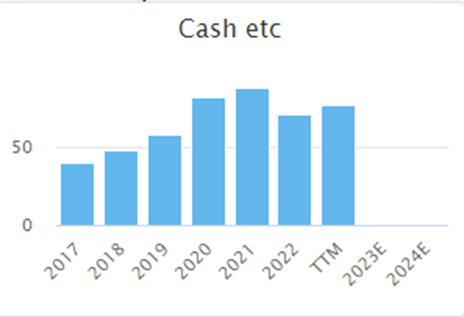
At around £77m, it exceeds the current market cap. However, the EV is larger due to significant lease liabilities:
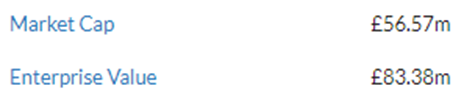
Like elsewhere, I am not convinced that including gross lease liabilities as debt is always helpful in valuation. Their negative working capital further complicates this. When I wrote about adjusting the earnings yield here, I used SCS as an example and came up with my own definition of the cash that may not be required by the business to operate in its current form and should be available for payout, investment or distribution. I called it "Shareholders' Cash" (or "Shareholders' Debt" if it is negative).
Shareholders' Cash = Cash – Debt – Provisions – Deferred Consideration + Net Working Capital - Net Lease Liabilities
(Net Working Capital is only included when negative, and Net Lease Liabilities when Lease Liabilities exceed Lease Assets.)
For SCS currently, Shareholders Cash (Debt) = £76.9 - £1.3m - £68.5m - £12.1m = (£5m). So since I looked at this previously, this has been reduced by about £20m and gone negative. This isn't a problem since the negative working capital is unlikely to unwind while they are a trading business. This cash balance means the company can easily afford to pay its generous dividend of over 8%. The Company also spent £7m on a share buyback that was completed in February. They have also been able to purchase the assets of other failed furniture retailers and use their skills and financial strength to turn these around.
Apart from the covid blip in 2020, the Company has had a very good return on Equity:
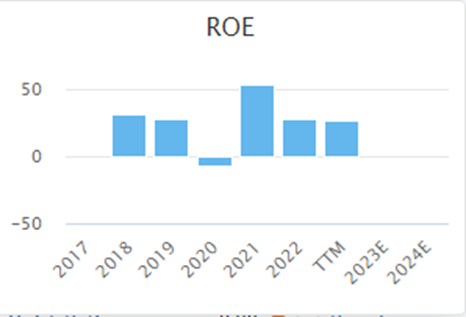
This reinforces that this is a high-quality company that tends to generate returns significantly above its cost of capital. One of the strongest arguments for investing in SCS is when you compare it with competitor DFS Furniture (LON:DFS) :
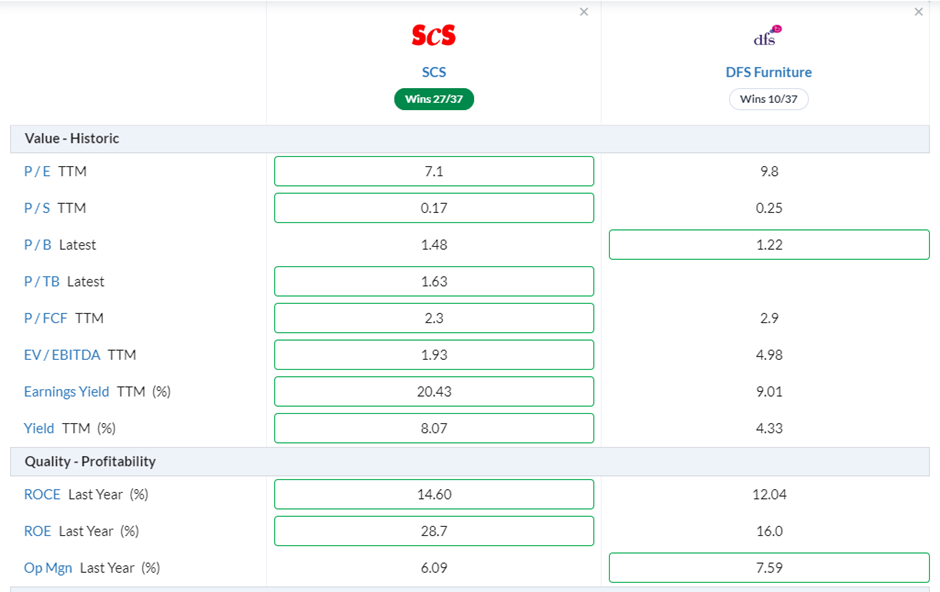
DFS being the market leader, perhaps deserves a slight premium. However, SCS trades on half the rating despite better quality metrics.
Headlam (LON:HEAD)
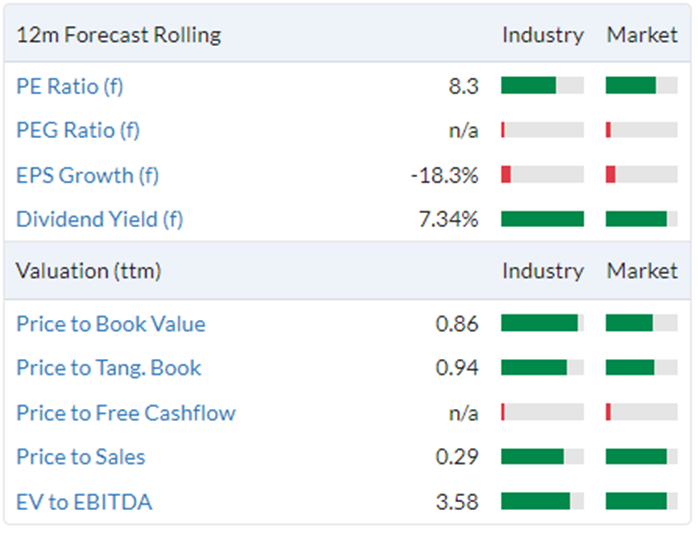
Headlam is a floor coverings distributor. It has been a consolidator of a fragmented distribution industry since the 1990s. It now operates 67 businesses and trade brands across the UK, France and the Netherlands. As you’d expect, this is a company with a lot of green on its StockReport:
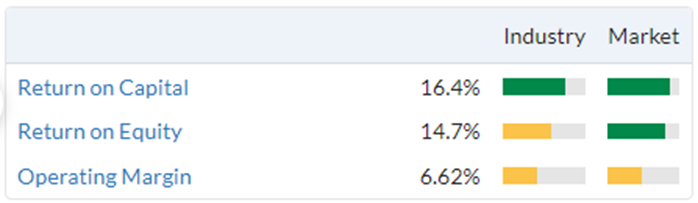
Given that this is a distribution business, the Return on Capital is very good:
However, the consensus trend here has not been encouraging:
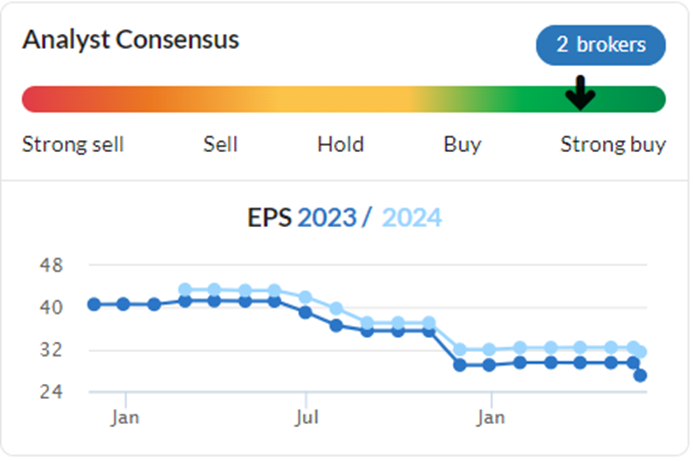
The latest dip in estimates, as well as a dip in the share price, was caused by the following part of their AGM Trading Statement:
Notwithstanding the overall positive year on year revenue performance, the lower residential volumes coupled with the moderation in price increases has reduced gross margin in the first four months of the year. However, the Company is deploying several mitigating actions. These include undertaking further cost control, reviewing prices, in particular where prices have previously been held despite the inflationary environment, and launching/relaunching products under the own product brands strategy ahead of the busier second half trading period.
The market never likes a second-half weighting since these can often be the precursor to a profits warning.
One of the biggest competitive threats to Headlam comes from Likewise (LON:LIKE) . Likewise was started in 2018 by Tony Brewer, who used to be CEO of Headlam. As Headlam did in its early days, Likewise has grown revenue rapidly via acquisition:
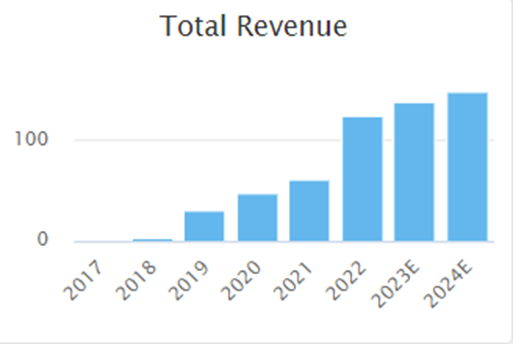
The market perhaps fears that this young upstart will eat Headlam's lunch. Did I detect a dig at their larger competitor in this week's trading update?
…despite certain adverse comment regarding the New Build and Refurbishment Markets, that its businesses in both Residential and Commercial Flooring have continued to increase following the last announcement on 16 May 2023 and the Group continues to trade in line with current market expectations.
Likewise don't seem to have completely escaped the market conditions, as their EPS trend looks very similar to Headlam's:
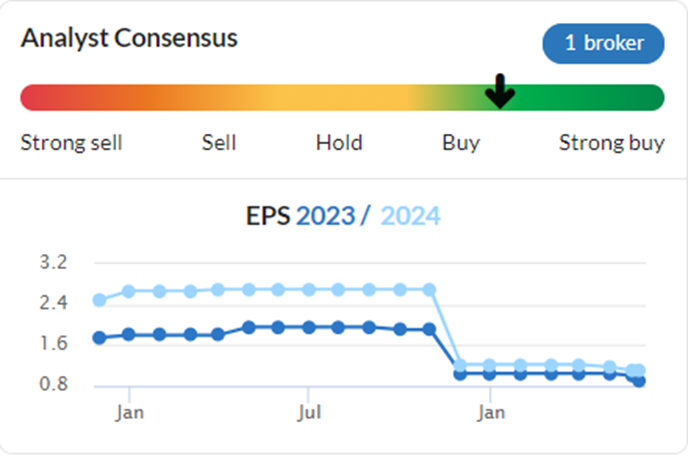
Indeed, over the last year, 2024 EPS estimates for Likewise have dropped almost 60% compared with only around 30% for Headlam. In the Stockopedia head-to-head, Headlam wins 28 out of 36:
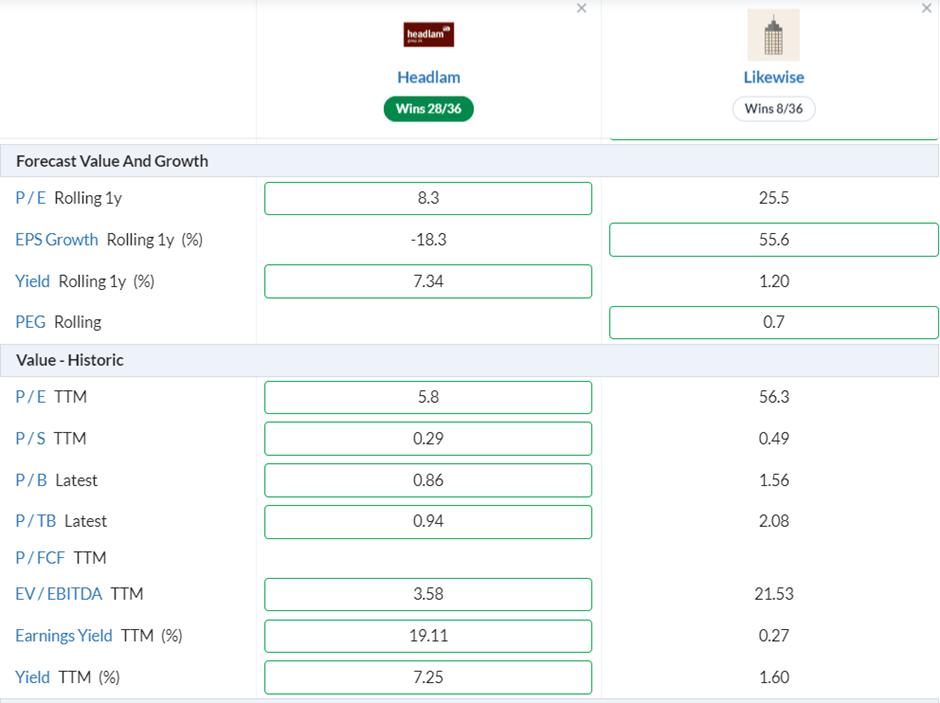
I know which Company I'd rather own, and it's not the one on a forward P/E of 26.
Greencore (LON:GNC)
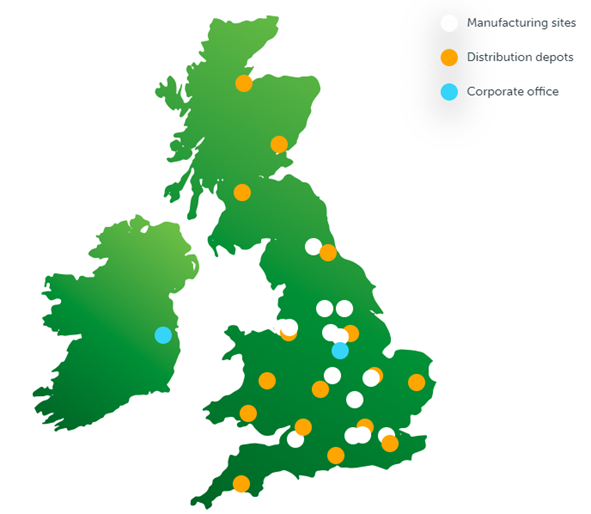
Greencore is a Main Market-listed manufacturer of convenience foods, such as pre-packed salads and sandwiches. With £1.7b in sales, it provides these products to many of the major retailers. It is headquartered in Ireland but has operations all over the UK:
The forward P/E is around 8:
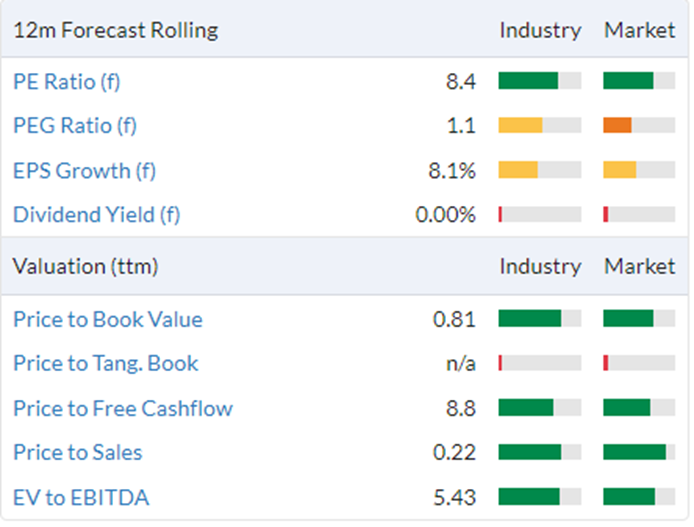
However, in H1 results reported this week, they have £219m of net debt, making their Enterprise Value some 50% higher than the market cap. Their outlook statement says they are in line with expectations:
While the UK consumer spending environment remains challenging, the Group has continued to focus on improving profitability and returns and has taken decisive action across a number of initiatives in the first half to support profitability. The Group expects to generate an FY23 outturn in line with current market expectations.
Expectations are for 7.6p EPS for the Full Year. However, with just 0.5p of adjusted EPS reported for H1, this is another company with a dreaded H2 weighting.
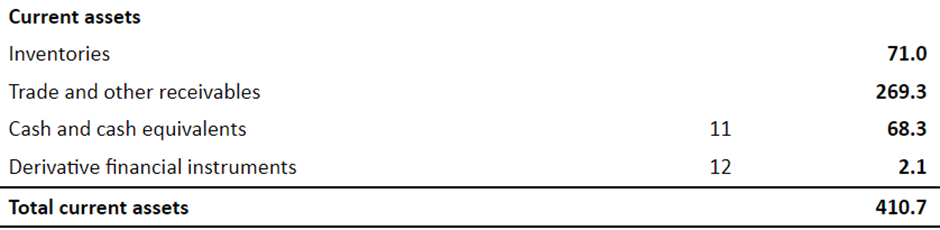
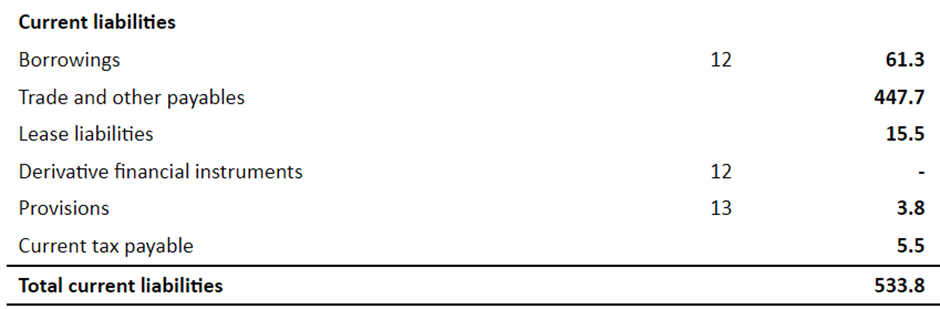
There has been no dividend since 2020, but the Company must feel its shares are undervalued as they have announced a continuation of its share buyback this week. The case for this looks less obvious to me, though. As well as the net debt, current liabilities significantly exceed current assets meaning that the balance sheet doesn't look particularly strong:
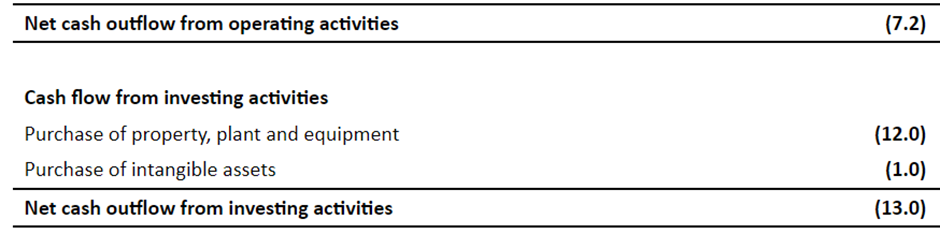
It also seems that Free Cashflow may not be as strong going forward, either. Here are the H1 figures:
This is another company where the Quality Rank is reliant on a high Piotroski F-Score. The return on capital figures are less than impressive:
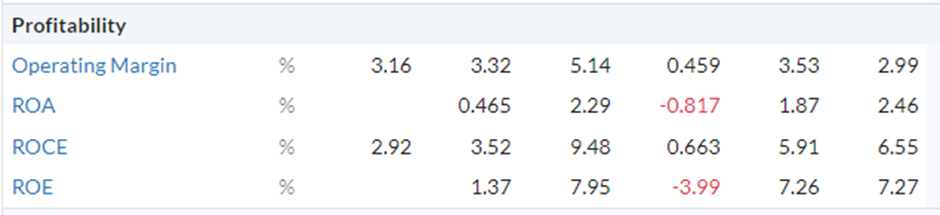
Indeed, they are potentially less than their cost of capital in a higher interest rate environment. Despite what the StockRanks are saying, I struggle to see this as significantly undervalued or a high-quality company.
Vesuvius (LON:VSVS)
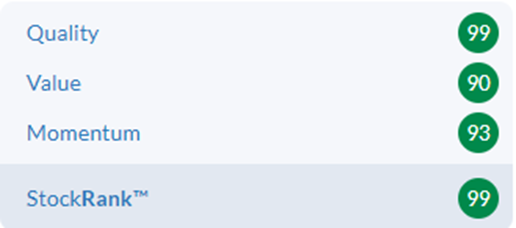
Vesuvius used to be known as Cookson PLC and is a provider of refractory materials and machinery to the steel industry. It has a top decile ranking for all of the StockRanks:
And the valuation summary shows a lot to like about the Company:
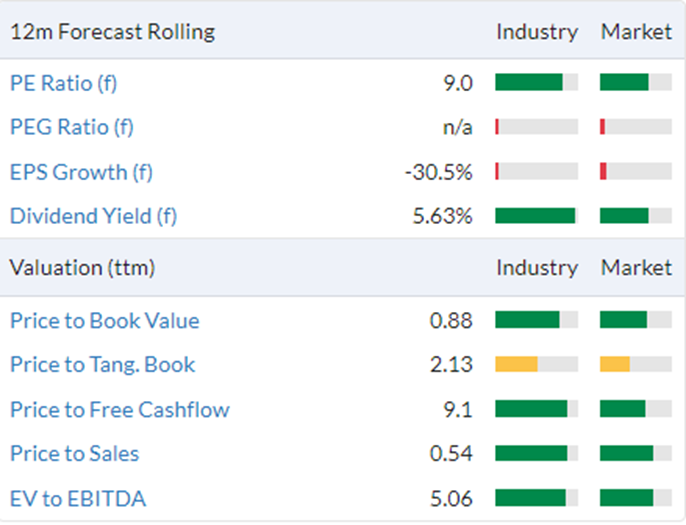
Only really the lack of EPS growth lets it down, with 2023 estimates predicting a large fall in EPS from 2022:
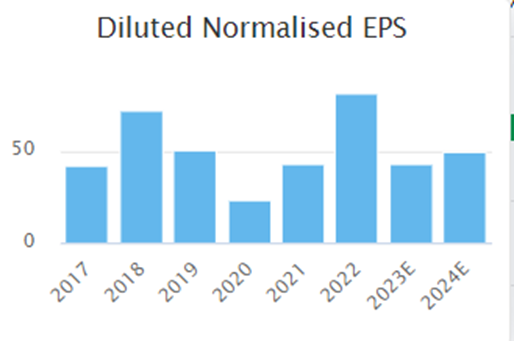
This looks to be a normal part of owning a cyclical business. The average EPS over the cycle seems to be around 50p, which compares favourably to a Share Price of around 400p. There is some debt, but this is stable and less than a quarter of the market cap:
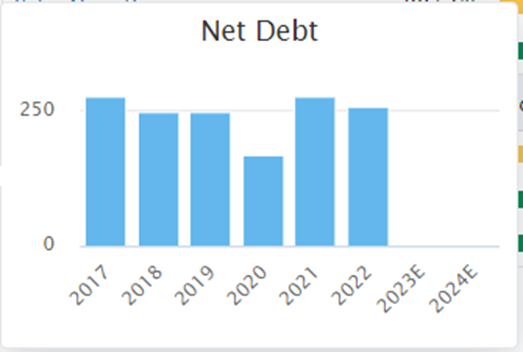
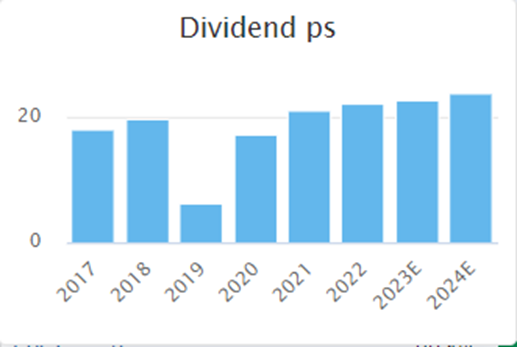
A dividend of 5.5% is good but not exceptional in current markets, although it is forecast to increase slightly going forward:
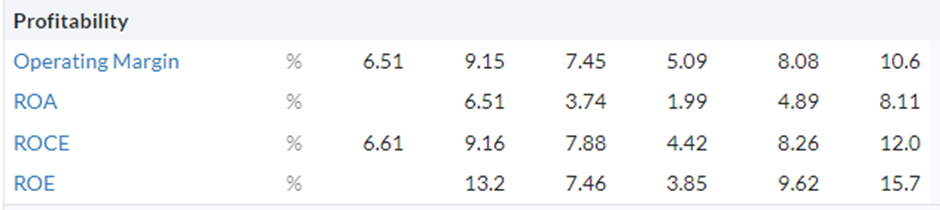
For FY22, the Return on Equity is strong at over 15%. However, this will be lower during cyclically weaker years, and the average is probably only around the Company's cost of capital:
The Company has struggled to grow in recent times, with revenue only rising slightly over time:
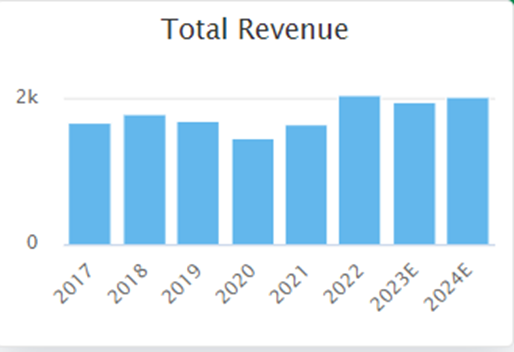
It made acquisitions in 2019 and 2021, funded from internally generated cash flow, so there is the possibility of the Company scaling up further via acquisition. However, these don't seem to have moved the needle by much. This is perhaps why the company’s share price has remained range-bound since listing 20 years ago:
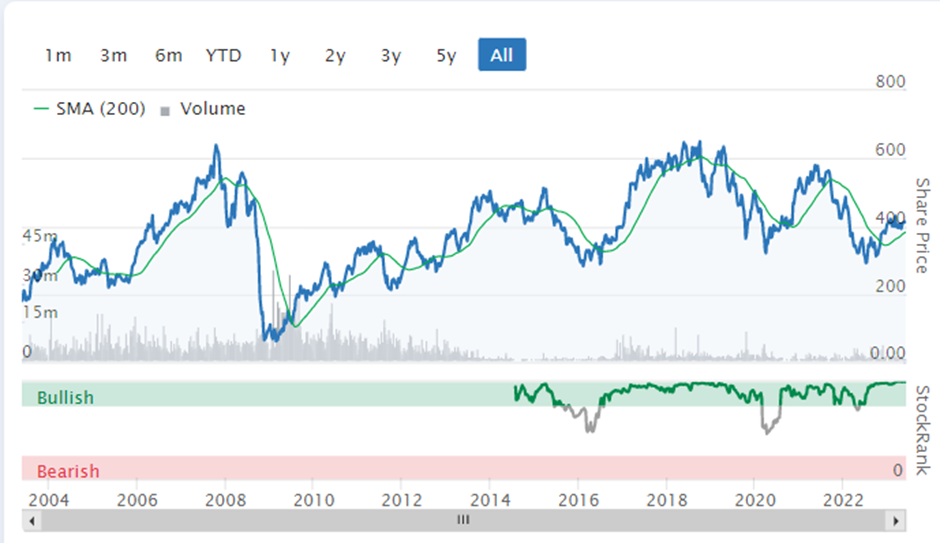
At the current price, the stock looks potentially undervalued. However, shareholders should expect steady returns rather than a business that will shoot the lights out.
Conclusion
As with all screens, there are both hits and misses here. Quiz (LON:QUIZ) SCS (LON:SCS) Headlam (LON:HEAD) and Vesuvius (LON:VSVS) get the Contrarian QV thumbs up from me. However, I don't see the attraction of Greencore (LON:GNC), personally. Robinson (LON:RBN) is interesting for its property assets if they can be realised, but it is more of a deep value play than a QV stock.
[Disclosure: Mark owns shares in Quiz (LON:QUIZ) & SCS (LON:SCS) ]
Disclaimer
This is not financial advice. Our content is intended to be used and must be used for information and education purposes only. Please read our disclaimer and terms and conditions to understand our obligations.

12 comments
Quiz (LON:QUIZ) pops up on a lot of screens I run. I have held, but recent announcements have made me run for the hills. The full year sales growth looks great but the recent quarterly trends aren't and I expect more of the same in coming Q1. On the director shareholdings, yes there's lots of skin in the game but you have to wonder why the CFO holds so few shares if it's a storming value play. For a company this size, there has to be a risk of it going private, so if I held it again, it would probably be in a SIPP and not an ISA.
And while I'm at it, I don't think the 60% gross margins quoted are comparable with other retailers, I don't believe they include store staff or property costs for example. I suspect therefore true gross margins are materially lower so am not convinced this stat signals any particular quality.
Hi M48 and Mark
I think you'll find that gross margin is simply sale price - cost price = Gross Profit and hence Gross Margin can easily be calculated by dividing the difference by the sale price x 100 to give as a %
The costs you mention are deducted, along with all other costs, to give you net profit/margin.
What I am wondering (and therefore waiting for this years audited accounts to come out) is what the level of costs are that are annual, regular and recurring costs and what are one offs. Or put another way, with over £90m of revenues, a Gross Margin in excess of 60% yet net profit is only £2m, this suggests the company has some pretty massive overheads/running costs??
I am planning to look back at previous accounts this weekend to see if that can shed any light on this. I am assuming that the costs of restructuring and lease/landlord changes were dealt with in previous year's accounts.
Ps Really like these kind of articles Mark, please keep them coming.
Norfolk, what you say is true but the point I was trying to make is that I believe most other retailers include more than just the product cost in their gross margin. It goes partly I think to explain your comment that Quiz seems to have lots of other overheads below gross margin - I think you’ll find a lot of it is simply the store staff, property, running costs.
I was looking at the results presentation for Card Factory (LON:CARD) today which split all this info out clearly. As a comparison, their ‘product margin’ is 68%, but by the time you deduct all the store costs, (staff, property, electricity etc.), you halve that to 34%. Makes a big difference. For a long time, I thought Quiz was somehow better than other retailers till I twigged it was an apples vs pears comparison.
Hi M48
Thanks for your reply. Agree with what you say. Looking at Card Factory and their margins, they produce a Net Profit of 9.5% of turnover and must have similar overheads. Quiz are showing a Net Profit of less than 2.6% when measured against turnover.
I'm hoping their latest accounts, when released will shine some light on this. If most of the costs are fixed then at least any growth in turnover at these margins should find its way quickly to the bottom line.
Card Factory (LON:CARD) call Product Margin what Quiz (LON:QUIZ) calls Gross Profit. It is a shame there is no standard terminology for retailers. Although, whatever you call it, above 60% is good IMO. It is just a shame that Card Factory (LON:CARD) 'S balance sheet is terrible. With a current ratio of just 0.44, Card Factory (LON:CARD) is an incredibly risky stock.
Card Factory (LON:CARD), Paul Scott has a different view, from his review in May, 2023 "I no longer have any concerns about the balance sheet."
Is the current ratio on Stockopedia?
Yes, it is on the StockReport here:
This is what Paul said in SCVR in April:
The finances are not completely sorted out yet, but that pales into insignificance given the strength of the P&L, and cash generation. Weak balance sheets are only a concern when those other measures are poor.
Which I agree with. I'm just a much more cautious investor than Paul. I can easily see a place for Card Factory (LON:CARD) amongst a diversified portfolio, just that it isn't in a great place to weather any downturn in trading. If that downturn never comes, or they rebuild the balance sheet from cash flow in the meantime, then they will be fine.
Mark, thanks, I could not see for looking. Have added as a column to my folios. Card Factory (LON:CARD) is the second lowest, only Ecora Resources (LON:ECOR) is lower of my current holdings. I have been using Debt/profit but a lot debt can be leases, debatable whether that should be classed as debt. I know many people don't like the rule change.
I agree that Card Factory (LON:CARD) has some risk, I only have a small holding.
Great article again Mark. You give really clear analytical commentary. Thank you.
I hold SCS (LON:SCS) Vesuvius (LON:VSVS) and Quiz (LON:QUIZ)
An excellent article Mark, many thanks. I own or have owned most of the shares you mention but it's always good having a sense check from someone else and a fresh view of a stocks virtues.
Great article. I bought shares in Vesuvius for my grandson so I was pleased to see your confirmation of my decision