Small Cap Value Report (27 Aug) - LOQ, PTD, BPI, UTV

Good morning! We have a soft open indicated by the FTSE 100 futures, which are currently 42 points down at 6,467. Although once again, I think it is important to note that small caps have been out-performing considerably - check out the chart below for FTSE Small Cap Index XIT (FTSE:SMXX), with the FTSE 100 overlaid onto it (the beige line). This shows the remarkable divergence since Nov 2012, when small caps began a significant rise. So if you invest in small caps, and are pleased with how you're out-performing the FTSE 100, then you're comparing yourself to the wrong index!

Lo-Q (LON:LOQ) announce a common sense decision to move their year end date from 31 Oct to 31 Dexc. This will result in a one-off 14 month period, but more importantly should balance their H1/H2 trading split more evenly from 2014 onwards. Since their product is in use at theme parks, which are seasonal, generally being closed over the winter, then their current H1 to 30 April each year has negligible trading, whereas H2 has almost all turnover. The split in the last full year was 12.7% turnover in H1, and 87.33% in H2, which is clearly ridiculous. A 30 June half year end should balance things more sensibly, so is to be welcomed, in my opinion.
Interim results from Pittards (LON:PTD) look impressive. This is a £10m market cap UK-based leather products manufacturer, using hides imported from Ethiopia. The company has been somewhat accident-prone in the past, and had a poor year in 2012. Things look to be on the mend now, with interim figures to 30 Jun 2013 showing a strong rebound in profitability to £954k profit before tax (versus just £12k last year's first half).
Also, I note that they have a fairly sound Balance Sheet, with net tangible assets considerably higher than the market cap, at £16.9m. Stock seems very high, at £15.6m though, which is more than six months cost of sales (at £14.6m), so that seems a rather inefficient use of capital, and seems to be the underlying reason for the company having £6.7m of net debt.
Further good news is that Pittards state that they intend paying a dividend in the next 12 months, and intend carrying out a share consolidation, which makes sense given that the share price at 2.25p is outside the normal range that investors are comfortable with.
There is no meaningful outlook statement, which is a bit of an oversight. I see they have changed banks from RBS to LloydsTSB. I wish them well on that, as in my experience LloydsTSB are the least flexible, and most ruthless High Street bank, although maybe that's changed since they were bailed out by the taxpayer?
Stockopedia shows the full year forecast at 0.4p EPS, which puts them on a PER of just 5. If you accept that the net debt could probably be reduced if they managed their stocks position better, then this valuation looks attractive. As 0.2p EPS was delivered in H1, the full year forecast looks achievable, assuming no significant seasonality. I note that there was a very low Corporation Tax charge, which flatters EPS, since it is calculated using after tax profits.
I see these shares have risent to 2.25p Bid / 2.5p Offer this morning, so assuming one has to pay the full offer price, then the PER is 6.25, but that's still good value in my opinion. I won't be buying any myself, as am fully committed with other positions, but I can see upside potential on this share price.
Interim results published today by British Polythene Industries (LON:BPI) look potentially interesting as a cyclical recovery investment. The shares are up 3% to 587p at the time of writing, which with 26.8m shares in issue, gives a market cap of £157m.
Profit before tax rose 17% to £14.1m for the six months to 30 Jun 2013. Adjusted EPS rose 12.5% to 40.12p. Remember that's just for half the year, although judging from last year's results, H1 is stronger than H2. The outlook statements seem a bit contradictory, with prominence given to a positive-sounding outlook at the start of today's report, which says:
The second half has started well and many of our operations are busier than at this time last year. Your Board will be disappointed if the second half does not meet or exceed the outcome achieved during the same period last year.
Yet further on in the report, they sound less positive saying:
The second half looks challenging with increases in raw material prices but demand is beginning to look less uncertain. The hot dry weather experienced in July may reduce demand for silage products in the second half but we remain confident of delivering acceptable results.
Full year consensus forecast is for 55.3p EPS, which looks achievable, or even a bit light perhaps?
So at 582p the shares are not expensive, on a current year PER of just over 10. Net debt seems fine, at £20.9m at 30 Jun 2013, although that's probably been managed down a bit for the period end. They seem to have ample bank facilities totalling £75m, although £10m is repayable in 2014, and £40m repayable in 2015. Although with decent results, I cannot see any reason why renewal of the bank facilities should be a concern.
There's a rather large pension deficit, although the table below is interesting, in showing how increased corporate bond yields had a significant benefit in reducing the pension deficit. Although as one reader pointed out recently, higher inflation assumptions are working the other way, increasing deficits. So quite a few moving parts, including investment returns, and scheme member longevity assumptions:
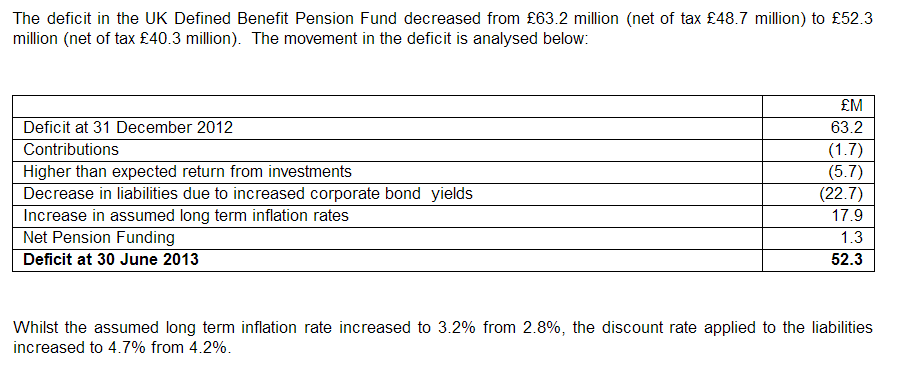
So it's up to each investor to decide how significant the pension deficit is for you. Is it a problem, or does it provide an opportunity to buy the shares more cheaply than is deserved?
A couple of other accounting points to note about BPI. There's a larger than usual divergence between normal EPS and diluted EPS, which indicates that management have perhaps been greedy with their share options, but it depends on the terms of the options. Note 7 to the accounts today indicates that 2.18m share options are in issue, which is over £10m-worth, which strikes me as rather excessive. So that would need looking at in more detail before I could invest here.
Director remuneration looks reasonable, with the exception of the CEO who looks expensive on a total package of £620k (including bonuses).
Also, I note that the Balance Sheet shows £51.3m net assets attributable to equity holders, and £21.6m attributable to "non-controlling interests". Checking note 15 to the accounts, this is described as "Pension Partnership", so that needs investigating, to ascertain why they seem to be shown as a minority interest on the Balance Sheet. That usually occurs where subsidiaries are not 100% owned, so perhaps the pension fund has an equity stake in some of the group subsidiaries? Not sure, but am just flagging it as needing investigation. Do any readers know about this? If so please leave a comment below.
The dividend yield at BPI is OK, at about 2.5%, and the payout has been gently rising since 2010.
My problem with BPI is the chart (see the 3 year chart below). It's risen a lot already, and it's very difficult to buy into something this late. I know that shouldn't matter, but it does.
Finally, I've had a quick skim of the interim results to 30 Jun 2013 from UTV Media (LON:UTV), a radio & TV business. They're not very good. Turnover fell 10.4% to £55.2m, and pre-tax profits fell from £10.7m last year to £6.1m. So although they talk optimistically about H2, having performed poorly in H1 the full year figures look like they might be a stretch. So the risk of a profits warning in the next few months looks high to me.
Also, it has a horrible Balance Sheet. Whilst these things are subjective to a certain extent, the narrative describing their Balance Sheet as "robust" is laughable. The £92.9m net assets becomes minus £87.3m once you write off intangibles. Working capital is slightly negative, with £32m current assets, and £33.4m current liabilities, which is not great, but not disastrous. However, long term creditors total £100.7m, including £56.3m in bank debt, a £6m pension deficit, and £38m deferred tax liability.
In no way is that a "robust" Balance Sheet, and it easily fails my review, so I won't be investing here.
That's it for today. See you tomorrow!
Regards, Paul.
(of the companies mentioned today, Paul has no long or short positions)
Disclaimer
This is not financial advice. Our content is intended to be used and must be used for information and education purposes only. Please read our disclaimer and terms and conditions to understand our obligations.

7 comments
Fundamentals most important but I would never invest without looking at the chart. It can help massively on timing entries and exits. Anthony Bolton, before he went walkabout in China, always used the chart to help determine when to buy in. The chart on Globo (LON:GBO), my best stock this year, was instrumental in helping me time my purchase at the end of December. If you look at the current Globo (LON:GBO) chart why would anyone sell now?
Hi Paul,
Many thanks for the reply. I've been to a few 'free seminars' (i.e. sales pitches) on charting but never been tempted to enrol on any of the "Normally £3,995 but if you enrol today it's only £1,995" courses LOL!
In terms of simple charts that I like - my favourite one is to buy a share that has been in a long downtrend, and then has moved sideways for several months. I've found that is often a turning point, where negative sentiment has been exhausted & everyone who is going to sell, has sold. Hence once it starts moving up, it can really shoot up. - See more at: http://www.stockopedia.com/content/small-cap-value-report-27-aug-loq-ptd-bpi-utv-76540/#1
I very much agree with you on that point. For me, the Begbies Traynor (LON:BEG) 5-year chart is a great example of this.
http://tools.morningstar.co.uk/uk/stockreport/default.aspx?Site=uk&id=0P00007O07&LanguageId=en-GB&SecurityToken=0P00007O07]3]0]E0WWE$$ALL
Steve
Hi Paul,
I was wondering if you'd glanced at the Plus500 (LON:PLUS) interims this morning? I know they're an Israeli company and not your usual bag, but they do trade in the UK, and have just announced a maiden divi with a commitment to redistribute 50% of profit.
Paul,
Not a comment on this article but a general thank you for your reports. I find then very helpful in an area which hopefully is going to continue to attract more investor interest.
Christopher
As you say Pittards looks very cheap especially as earnings forecasts may be conservative at 0.4p.also the return to the dividend list implies some confidence on the outlook. Company is seen as somewhat accident prone and at mercy of events outside its control.. Shares should re-rate to 5p -maybe higher if things continue to improve.
Hi Paul,
Obviously you concentrate mainly on detailed fundamental analysis of the accounts when looking at a company but you seem to be using charts more than you used to when deciding whether or not to buy shares. To what extent do you think that technical analysis has a place when analysing small caps? If memory serves - and I do apologise without reservation if I am wrong here - you were previously very sceptical about the value of TA.
Thanks as always for the excellent reports.
Steve
Hi Steve,
I've read a couple of books on charting, but am not in any way an expert on it, so my comments should be taken in that context.
Most chartists seem to earn their living by running courses on charting. That strikes me as a major failing, because if it worked then they would be too rich to need to bother running courses. Also chartists always seem to avoid giving proper predictions, but say that if X happens then the shares will go up, but if Y happens, then they will go down. That's about as much use as a chocolate teapot.
On the other hand, the chart is the best summary we have of investor sentiment over time. So I can certainly see the merit in studying the chart, and working out what events drove sentiment, e.g. how the price tends to move around results time, market reactions to trading statements, etc.
In my view giving some thought to the chart, combined with detailed research on the fundamentals, can deliver better returns, and I know quite a lot of successful investors who mainly focus on fundamentals, but also pay attention to signals the chart is giving them too. On the other hand, I've never met anyone who has made a lot of money consistently over the long term, from charting alone. Maybe they do exist, but just keep quiet about their methods, which is the obvious way to play it, if you are successful!
So if I like a company on fundamentals, and I read on a bulletin board that chartists are getting excited about seeing a "nice bowl developing", then I will factor that into my thinking - i.e. that the odds of the share rising are now higher because a favourable chart pattern is pulling in new buyers.
In terms of simple charts that I like - my favourite one is to buy a share that has been in a long downtrend, and then has moved sideways for several months. I've found that is often a turning point, where negative sentiment has been exhausted & everyone who is going to sell, has sold. Hence once it starts moving up, it can really shoot up. That's exactly what happened with Trinity Mirror (LON:TNI) last year - when it flat-lined at 25p for several months, on a PER of under 1! I loved it on fundamentals at that price, and thought the flat chart also indicated that another move down was looking unlikely.
Also, the other reason I like flat charts that suddenly start moving up, is because there are so many other market participants who like to buy on chart breakouts, and momentum. So once a new up-trend is established, it can just carry on rising, not only to reach a full valuation, but to an excessive valuation.
So for me, I'd say that the fundamentals are about 90% of what drives my investment decisions, but investor psychology/charts will make up the other 10% roughly.
What do others think?
Cheers, Paul.