
Good morning from Paul & Graham!
I updated my SCVR summary spreadsheet over the weekend, and we are now up to 552 unique companies covered here (including brief comments) 2024 YTD.
"Profitable Growth"
This phrase seems to be appearing with greater frequency in trading updates. It strikes me as being vague, and not really telling us much, if anything. Do you share that view, or is it just me over-thinking things, and/or being neurotic? Let's find out! I've set up a quick & simple online poll here. Please don't share this link, as I'm just trying to gauge opinion amongst Stockopedia subscribers. Then I can share the results with the PR/broking community, to give them some feedback. There's also a comment field where you can leave any additional views (up to 100 characters, the max allowed). Just a bit of fun, and if people like this, we can do some more polls!
Tell us your opinion here!
Apologies, the survey is now full, as they start charging after just 25 responses, so I'll have to find some better survey system (I might set up my own on Google Forms, leave that with me for later).
Explanatory notes -
A quick reminder that we don’t recommend any shares. We aim to review trading updates & results of the day and offer our opinions on them as possible candidates for further research if they interest you. Our opinions will sometimes turn out to be right, and sometimes wrong, because it's anybody's guess what direction market sentiment will take & nobody can predict the future with certainty. We are analysing the company fundamentals, not trying to predict market sentiment.
We stick to companies that have issued news on the day, with market caps (usually) between £10m and £1bn. We usually avoid the smallest, and most speculative companies, and also avoid a few specialist sectors (e.g. natural resources, pharma/biotech, investment cos). Although if something is newsworthy and interesting, we'll try to comment on it. Please bear in mind the "list of companies reporting" is precisely that - it's not a to do list. We typically cover c.5 companies per day, with a particular emphasis on under/over expectations updates, and we follow the "most viewed" list of readers, so if you're collectively interested in a company, we'll try to cover it. Obviously with the resources available, we can't cover everything! Add you own comments if you see something interesting, and feel free to discuss anything shares-related in the comments.
A key assumption is that readers DYOR (do your own research), and make your own investment decisions. Reader comments are welcomed - please be civil, rational, and include the company name/ticker, otherwise people won't necessarily know what company you are referring to, if they are using unthreaded viewing of comments.
What does our colour-coding mean? Will it guarantee instant, easy riches? Sadly not! Share prices move up or down for many reasons, and can often detach from the company fundamentals. So we're not making any predictions about what share prices will do.
Green (thumbs up) - means in our opinion, a company is well-financed (so low risk of dilution/insolvency), is trading well, and has a reasonably good outlook, with the shares reasonably priced. And/or it's such deep value that we see a good chance of a turnaround, and think that the share price might have overshot on the downside.
Amber - means we don't have a strong view either way, and can see some positives, and some negatives. Often companies like this are good, but expensive.
Red (thumbs down) - means we see significant, or serious problems, so anyone looking at the share needs to be aware of the high risk. Sometimes risky shares can produce high returns, if they survive/recover. So again, we're not saying the share price will necessarily under-perform, we're just flagging the high risk.
Others: PINK = takeover approach, BLACK = profit warning, GREY = possible de-listing.
Links:
Paul & Graham's 2024 share ideas - live price-tracking spreadsheet (2 separate tabs at bottom), Video update of results so far, June 2024.
Frozen SCVR summary spreadsheet for calendar 2023.
New SCVR summary spreadsheet from July 2023 onwards.
Paul's podcasts (weekly summary of SCVRs & macro views) - or search on any podcast provider for "Paul Scott small caps" - eg Apple, Spotify.
Phil Hanson's data analysis measuring performance of our colour-coding system in the SCVRs, from July 2023- Mar 2024 (with live prices). My video explaining/reviewing it.
My other video (June 2024) - How to screen for broker upgrades on Stockopedia.
Companies Reporting
Other mid-morning movers (with news)
Creightons (LON:CRL) - down 10% to 19.0p (£13m) - Update on Asset Impairment - Paul - AMBER
Creightons plc (LSE: CRL), the product developer, brand owner and manufacturer of personal care, beauty, and fragrance products, today announces an update on its annual impairment review of goodwill and brand values…
Interesting, it looks as if some small shareholders panicked first thing, with trades printed as low as 14.5p. Since then it’s been steadily recovering to only down 10% at the time of writing (11:08).
My summary -
Audit for FY 3/2024 still underway.
Impairment of the Emma Hardie brand/goodwill will be a non-cash, post tax write off of £4.62m.
No impairments required on any other brands.
Underlying trading -
“The operational performance of the Group in the year to 31 March 2024, will show improved underlying profit and cash generation in the second half of the year in comparison to the first half.”
Results due out 18/7/2024, webinar at 11:00, 24/7/2024.
Paul’s view - storm in a teacup. I nearly always write off intangible assets anyway, so it doesn’t really matter to me when these are impaired. Also it's a process driven by the auditors, so often may not be anticipated earlier in the year. It’s not a cash cost now, although as others have pointed out, impairments are usually a historical cash cost from when the acquisition was originally made. My understanding is that CRL was already known to have a patchy track record in the brands and companies it has previously purchased.
For me all that matters is current, and future trading, which sounds OK in the bit I’ve highlighted above.
What is missing from the announcement? I think it needed a clear statement of performance vs expectations for the underlying business. Also since I can’t see any forecasts, then it needed a footnote saying what market expectations are. Finally, I would have liked confirmation of the current net cash/debt and liquidity position.
CRL has been through some turmoil, I don’t cover it often here, but I see from 4/12/2023 I noted that the long-serving CEO seemed to have been booted out.
The Emma Hardie brand only delivered £1.5m revenues in H1, so CRL clearly made a bad buy there. Overpriced anyway, but presumably investors would have already worked that out from its modest sales?
Is CRL at risk from insolvency? I think not. Its last balance sheet looks pretty solid, with c.£12m NTAV (which of course has already written off all intangibles, so won’t change after today’s news).
Overall then, I’m happy to stick at AMBER, and keep an open mind, since I don’t know how it’s likely to trade in future. But there are no alarm signals either in today’s update, not in the historical accounts, so nothing for me to warn you about.
The obvious questions to ask management are what went wrong with this acquisition, and how will they avoid making a similar mistake again?
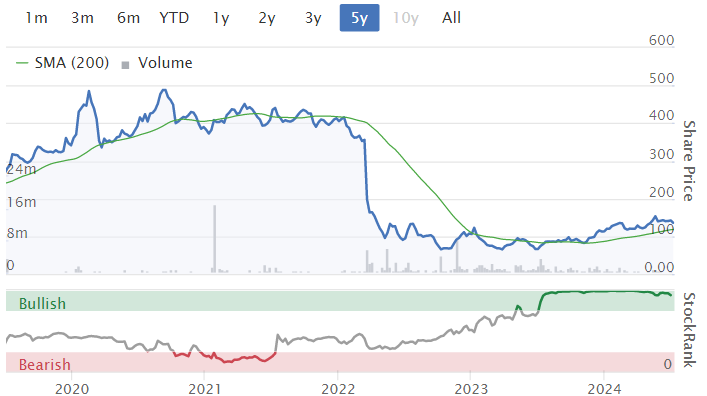
Zinc Media (LON:ZIN) - down 16% to 70p (£16m) - Trading Update - Paul - RED
Zinc Media Group plc (AIM: ZIN), the award-winning television and content production group, today announces a trading update for the six months ended 30 June 2024 ("H1 FY24").
Customers taking longer to sign contracts, and £2m revenues have slipped from FY 12/2024 into next year.
Cash at 6/2024 was £4.0m. What this RNS omits to say, is that it also has £3.5m of debt (propped up by Herald Inv Trust, and another shareholder). So net cash will only be c.£0.5m - highly misleading to only mention gross cash and ignore debt, in a trading update - a pet hate of mine - it's deliberate deception, simple as that.
Outlook - despite various problems, it says cost-cutting has been done. This comment has rattled my cage -
“which provides the Board with confidence in the Group's ability to deliver continued profitable growth in FY24 and FY25."”
It’s not profitable! So how can it deliver “profitable growth”, let alone “continued” profitable growth, when I don’t think it’s ever made a genuine profit (PBT)?
Paul’s view - I find the investor communications from ZIN to be one of the most dishonest out there. I've learned to completely disregard everything management say. Check out the recordings of its webinars to see what I mean. I remember seeing one on Mello and thinking this sounds great. Then I looked at the historical numbers, and there was almost no correlation between what its CEO said, and the actual numbers! He talks as if this is a profitable, successful company. Reality is that it’s on its knees financially, having only avoided insolvency from shareholder loans, and has been consistently loss-making. I worry that naive investors are being sucked into buying something pretty rubbish at an inflated price. Hence the warnings here, one of the few places out there that tell you the unvarnished truth as we see it, because we don't take any fees from companies to lie for them - unlike city advisers.
Creditors look stretched, and I suspect this share is a strong candidate for ending up at zero, so a complete bargepole stock for me. Harsh? Not really - have a look at the figures, they’re dreadful.
Summaries
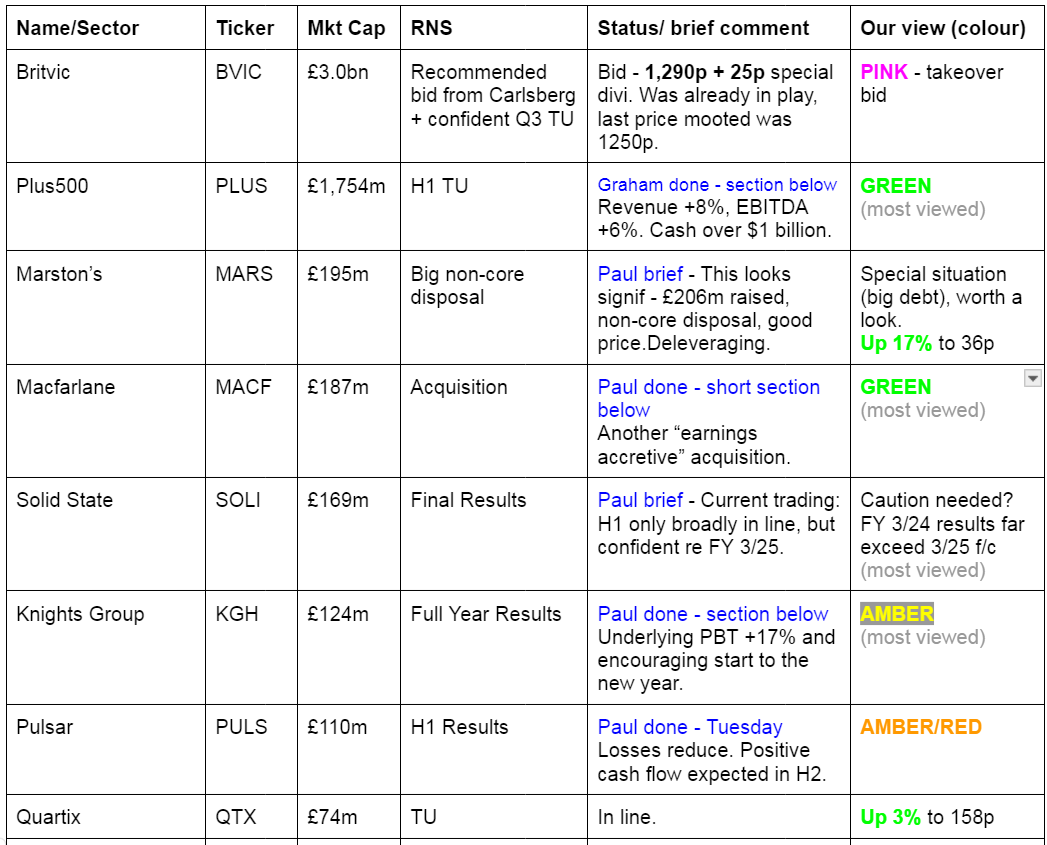
Knights group (LON:KGH) - unch 145p (at 08:21) £124m - FY 4/2024 Results - Paul - AMBER
Headline numbers look great, but the deeper I got into the detail below, the less keen I became. Cashflow in particular don't look up to scratch. So I've come down a notch from amber/green to just AMBER. There's nothing particularly bad here, it's just not the great bargain that it initially looks, in my view.
Plus500 (LON:PLUS) - down 4% to £22.28 (£1.7 billion / $2.2 billion) - Half Year 2024 Trading Update - Graham - GREEN
The outlook is in line with expectations for the full year after this H1 update shows good progress in revenue and EBITDA despite the impact of Euro 2024. I think the company has a great chance of beating consensus expectations this year, and perhaps investors were expecting it to say as much today.
Macfarlane (LON:MACF) - up 3% to 121p (£192m) - Acquisition - Paul - GREEN
Quick comment [no section below] - the latest acquisition in this packaging group’s buy & build strategy is called Polyformes. Funded through existing debt facility. Says it’s earnings accretive. In FY 12/2023 Polyformes made £1.4m PBT on £9.3m revenues. Initial consideration c.£6.7m, plus potential 2-year earnout of £4.8m maximum - seems a reasonable price.
Paul’s view - I remain of the view that MACF seems a decent business, with a good strategy to self-fund lots of bolt on acquisitions. Shares always seem cheap, and the fwd PER is now only 9.4x.
There was a wobble on 7/5/2024, when it revealed soft Q1 performance, hoping to be made up in H2, which can be a deferred profit warning sometimes. Although given a good long-term track record, personally I’d see temporarily softer trading as more of a buying than selling opportunity. [
Paul’s Section:
Knights group (LON:KGH)
Unch 145p (at 08:21) £124m - FY 4/2024 Results - Paul - AMBER
Knights, the legal and professional services business, today announces its full year results for the year ended 30 April 2024.
A good performance, reflecting resilience, scale and financial discipline
Plan to double the business in medium term
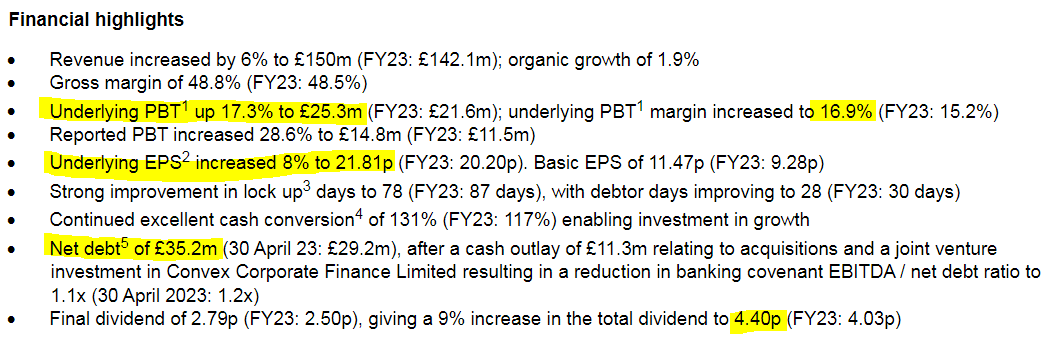
I’m drawn to the numbers I’ve highlighted below - showing nice profit growth vs LY, a good PBT margin, and the PER is only 6.6x adj EPS of 21.81p - more than enough to make me want to dig deeper.
Although using statutory diluted EPS of 11.1p, the PER is 13.1x - about the valuation I would expect. So the key question for investors in this share, is whether or not you accept the profit adjustments. If you do, it’s cheap. If you don’t, then it’s probably priced about right.
The Chairman’s statement says -
“… the Group's financial performance was in line with the Board's and market expectations, with a significant rise in profitability.”
Adjustments are large - with adj PBT £25.3m enhanced by 71% from statutory PBT of £14.8m. Are adjustments reasonable? I’m not entirely sure, as I’ve never really got my head around the issue of contingent acquisition payments treated as remuneration. Note also the size & repeat nature of “other non-underlying costs”, which suggests some of these are regular things. It strikes me as a fairly aggressive level of adjustments overall, hence I can see why some investors wouldn’t want to chase up the PER multiple very high -
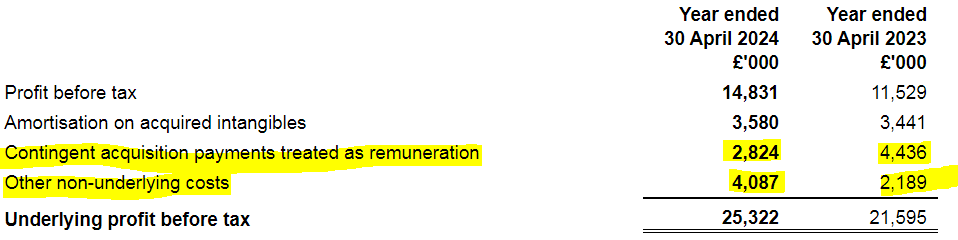
“Underlying profit before tax excludes amortisation of acquired intangibles, transaction, and onerous lease expenses in relation to acquisitions, contingent acquisition payments, disposals of acquired assets, one-off restructuring and professional costs mainly incurred in the streamlining of support functions or strategic reorganisations. “
Acquisitions - two completed in the year, with both performing ahead of expectations, per the CEO review.
Outlook - this sounds positive, but it’s somewhat vague, and doesn’t directly confirm market expectations, thus introducing doubt -
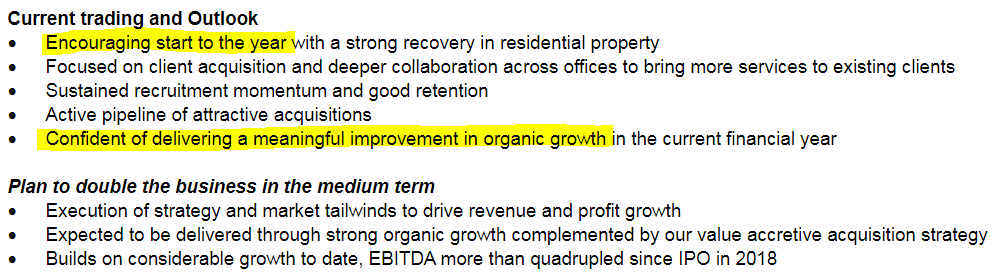
Balance sheet - NAV of £100m is dominated by goodwill & similar of £87m, so only £13m of NTAV.
Lease entries are quite high too, so it’s obviously got a lot of office space - hence its policy on working from home, and any issues with surplus property would be good questions to ask. The commentary mentions “rightsizing” its property portfolio. Remember that it’s one thing to make a provision for onerous leases, and adjust it out of profit, but the rents still have to be paid in cash! Note 33 shows £4.8m of property provisions (dilapidations), but only £244k in onerous leases, the latter being less than I was expecting.
A drawback with solicitors’ accounts is the working capital tied up in both billed, and unbilled fees which have been booked to revenue & profit, but not yet received in cash. These are £32.8m + £40.2m here, total £73.0m. That’s almost half the full year’s revenue of £150m. Billed of £32.8m probably includes VAT, so taking that down to pre-VAT would reduce the total to £67.5m. Still 164 days revenues. That includes prepayments and amounts due from a JV, so if I adjust those out, trade debtors (exc VAT) comes down to £58m, or 141 days. My figure is way higher than the company’s “lock up” figure of 78 days shown in the financial highlights, so this area needs some more work, as I’m not convinced the company’s reporting number of 78 days is realistic of the reality of how much customers owe.
Bank net debt is £35.2m, which is towards the top end of what I’m comfortable with. I’m not keen on Knights doing more acquisitions funded with debt.
Cashflow statement - these usually reveal what’s really going on! This looks quite poor to me. In particular, capex cash outflows of £8.2m look high, and seem to relate to property (note 23). Yet the large disposal number doesn’t come through into cash, suggesting to me that capex is a cash cost, but disposals look to be losses (ie not cash coming in).
The way I look at it, the acquisitions and dividends look to have been funded from increased bank debt.
Lease and other finance costs are hefty cash outflows of £5.1m and £4.5m.
Overall then, I’m raising an amber/red flag over poor cash generation. Well, almost no cash generation actually.
Paul’s opinion - the headline low PER and good profit growth look great at first sight.
Although the deeper I dig, particularly into the cashflows, the less enthusiastic I’ve become.
For that reason I’m moving it down a notch from amber/green, to just AMBER.
I prefer simpler, more obviously cash generative companies, which this isn’t.
Cheap on a PER basis, but for good reasons, is my view. Just an opinion as always, so feel free to disagree & post your reasons why.
EDIT: Many thanks to Brothersinarms, who points out below in the reader comments that interest on client monies is a huge number, which is mainly what has driven the profit increase. I didn't spot that on my initial review, so appreciate this important point being thrown into the discussion. The company's commentary confirms this -
"Other operating income has increased to £10.4m from £6.7m driven by an increase in interest earned on client monies held due to higher interest rates in FY24 than the previous year."
Graham’s Section:
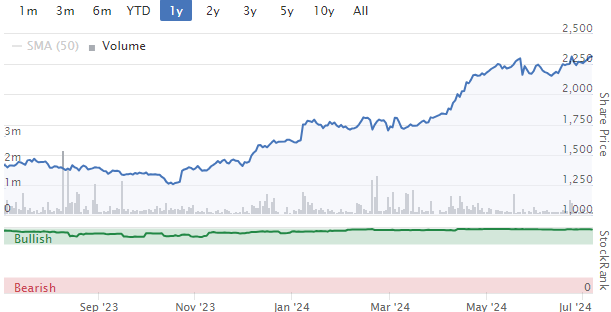
Plus500 (LON:PLUS)
Down 4% to £22.28 (£1.7 billion / $2.2 billion) - Half Year 2024 Trading Update - Graham - GREEN
Plus500, a global multi-asset fintech group operating proprietary technology-based trading platforms, announces its trading update for the six months ended 30 June 2024.
Over time, I’ve turned more positive on this CFD provider as it built a lengthy track record of profitability, cash generation and shareholder rewards.
I am also a long-term shareholder in IG group (LON:IGG) and I’ve included CMC Markets (LON:CMCX) in my best ideas list for 2024, so this is a sector I tend to be very positive on!
It has been a fabulous time to be a PLUS shareholder:
Today’s H1 trading update has the following key info:
H1 revenue +8% to $398m. Q2 revenue +14%.
H1 EBITDA +6% to $184m. Q2 EBITDA +11%.
CEO comment describes “excellent financial and operational performance despite difficult market conditions”.
There were “lower levels of activity across financial markets” towards the end of the period due to the UEFA Euro 2024 tournament - so customers are betting on/watching the footie instead of trading.
Cash was over $1 billion by the end of H1.
Customers: 56.8k new customers were onboarded in H1, and the total base of active customers was 175.9k. The total number of active customers in H1 is about the same as last year.
Shareholder returns: $81m of PLUS stock was bought back in H1. In total, $175m of dividends and buybacks were announced in H1. New shareholder returns will be announced with the H1 results:
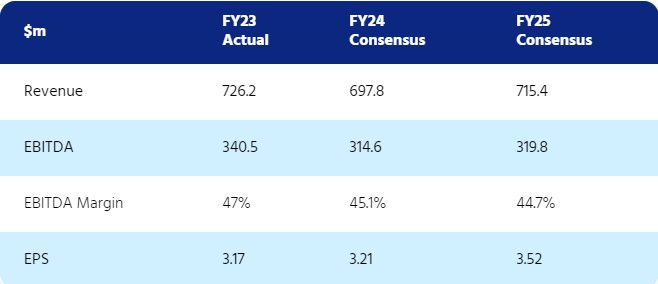
Outlook: in line with current market expectations.
Expectations are shown on the company’s website, with a small dip in revenues and EBITDA expected this year:
Graham’s view
I’m comfortable with my positive stance here, as I think that Plus500 has proven itself as a consistent generator of cash.
Some of the old arguments against the stock are still valid, in my view, but have been overtaken in importance by the fact that the company has generated mountains of cash - and returned large amounts of that cash to shareholders.
For example, there is the claim that Plus500 profits directly from customers’ trading losses. The company still insists that the contribution of customers’ trading losses is expected to be “broadly neutral over time”. It calls this item Customer Trading Performance.
In 2023, it benefited to the tune of $74m from Customer Trading Performance.
In 2022, Customer Trading Performance contributed $193m.
In 2021, it contributed $16m.
The right way to analyse the stock is probably to value it first excluding Customer Trading Performance, and then try to value the contributions from Customer Trading Performance separately
The volatile and sometimes large impact of Customer Trading Performance adds a degree of uncertainty to all financial forecasts for PLUS - e.g. I think the company could easily beat its consensus forecasts this year, but it’s too soon for anyone to predict this with confidence. But PLUS has already earned 57% of its full-year revenue forecast and 58% of its full-year EBITDA forecast.
Being a cash-rich company, it is also sensitive to interest rates: interest income last year was over $50m and this figure is included in top-line revenue.
The other old argument from bears like myself relates to customer churn. We can see from the H1 figures that new customers in H1 (56.8k) account for a high proportion of total active customers (175.9k). My impression is that the company has made some progress when it comes to increasing the longevity of the average customer, but a high degree of churn is still indicated to me by these numbers.
So when it comes to the quality of the business, I still have a preference for IGG and CMCX, which I believe have higher-quality customers along with more sophisticated and robust hedging policies.
While PLUS would probably deny it, my impression is that PLUS are happy to book their clients because a) their clients are more likely than not to lose, in aggregate and over time; and b) PLUS is happy to carry an extraordinarily large cash balance. So it can afford to pay out in the event that customers don’t lose.
Ultimately, the bearish arguments here don’t matter if the company continues to execute with a combination of successful marketing and a platform that customers enjoy using. The regulators have gone quiet in this sector for now. Traders are trading and the platforms are making money. It’s a nice time to be a shareholder.
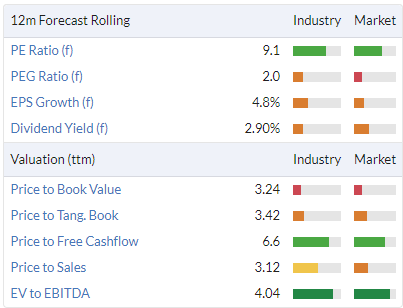
With a $1 billion cushion to be deducted from the PLUS market cap, the enterprise value here is only $1.2 billion. So you can count the EV/EBITDA multiple on the fingers of one hand. Even allowing for the issues raised above, I still see value here.
See what our investor community has to say
Enjoying the free article? Unlock access to all subscriber comments and dive deeper into discussions from our experienced community of private investors. Don't miss out on valuable insights. Start your free trial today!
Start your free trialWe require a payment card to verify your account, but you can cancel anytime with a single click and won’t be charged.